. 2025 Jul 1;16(1):5866.
doi: 10.1038/s41467-025-60189-3.

Machine learning reveals genes impacting oxidative stress resistance across yeasts

Affiliations

Machine learning reveals genes impacting oxidative stress resistance across yeasts

Katarina Aranguiz et al. Nat Commun. .

Abstract

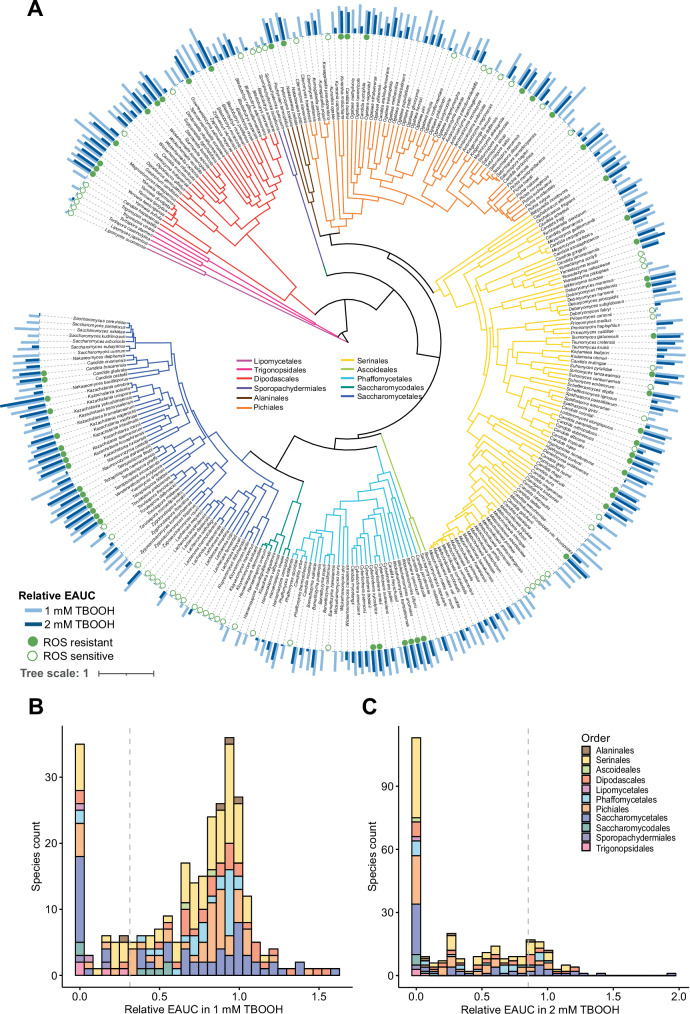
Reactive oxygen species (ROS) are highly reactive molecules encountered by yeasts during routine metabolism and during interactions with other organisms, including host infection. Here, we characterize the variation in resistance to the ROS-inducing compound tert-butyl hydroperoxide across the ancient yeast subphylum Saccharomycotina and use machine learning (ML) to identify gene families whose sizes are predictive of ROS resistance. The most predictive features are enriched in gene families related to cell wall organization and include two reductase gene families. We estimate the quantitative contributions of features to each species' classification to guide experimental validation and show that overexpression of the old yellow enzyme (OYE) reductase increases ROS resistance in Kluyveromyces lactis, while Saccharomyces cerevisiae mutants lacking multiple mannosyltransferase-encoding genes are hypersensitive to ROS. Altogether, this work provides a framework for how ML can uncover genetic mechanisms underlying trait variation across diverse species and inform trait manipulation for clinical and biotechnological applications.


Conflict of interest statement

Competing interests: A.R. is a scientific consultant for LifeMine Therapeutics, Inc. The other authors declare no competing interests.

Figures

Fig. 1
Fig. 1. The relative growth of yeast species grown in the presence of ROS.
A The empirical area under the curve (EAUC) values in 1 mM of the ROS-generator tert-butyl hydroperoxide (TBOOH, light blue) and 2 mM TBOOH (dark blue) are shown for each tested yeast species. The bar height represents the mean of three biological replicates. B, C Histograms showing the distribution of species’ relative growth in the presence of TBOOH. B A histogram displaying the relative growth in 1 mM TBOOH with a vertical dashed line indicating the cutoff for the poorest-growing 20% of species, which were classified as ROS-sensitive (empty circles in A). C A histogram displaying the relative growth in 2 mM TBOOH with a vertical dashed line to highlight the cutoff for the best-growing 20% of species, which were classified as ROS-resistant (filled circles in A). Note that using both 1 mM and 2 mM TBOOH concentrations provided better contrasts to bin ROS-sensitive and ROS-resistant yeasts. Source data are provided as a Source Data file.
Fig. 2
Fig. 2. Output metrics from the Random Forest classifier model.
A The area under the curve of the receiver operating characteristic (AUC-ROC) highlighting increasing identification of true positive classifications at varying thresholds of false positives. The standard deviation in the true positive rate (SD_TPR) is shown as a gray ribbon, whereas the black line represents the mean true positive rate. B The mean balanced confusion matrix from 100 model replicates, which highlights that model performance was generally accurate for both positive and negative classes. C A table summarizing the major model performance metrics for both the validation set of data, as well as the testing set that was not used to build the model; AUC-PR is the area under the curve of the precision-recall metric, and the F1 statistic is the harmonic mean of precision and recall. Source data are provided as a Source Data file.
Fig. 3
Fig. 3. Top features used to predict ROS resistance are enriched in genes involved in reductase activity and cell wall organization and biogenesis.
A The top 20 important features for the Random Forest classifier in their ranked order. For each gene family, the orthogroup (OG) and a general description of the gene are listed. B, C The enriched gene ontology (GO) terms based on the (B) S. cerevisiae and (C) C. albicans orthologs in the important features with a minimum of 5 genes and an FDR < 0.001 based on Fisher’s exact test. D, E STRING (Search Tool for the Retrieval of Interacting Genes/Proteins) networks using the orthologs from (D) S. cerevisiae and (E) C. albicans highlighting the number and diversity of genes involved in (i) cell wall organization and biogenesis, (ii) mannosyltransferase activity, and (iii) oxidoreductase activity. Source data are provided as a Source Data file.
Fig. 4
Fig. 4. Influence of gene families on classification across species using SHAP values.
A phylogenetic tree including the 114 species included in the ML model. The green filled circles indicate that the species was ROS-resistant (Actual Classification), whereas the blue filled circles indicated that the species was predicted as ROS-resistant by the model (Predicted Classification). The SHAP values for each species across the top gene families identified in the model related to reductase activity and cell wall organization are shown as a heat map. The red shading indicates a negative SHAP value, which contributes to classification as ROS-sensitive; whereas blue shading indicates a positive SHAP value, which contributes to classification as ROS-resistant. Source data are provided as a Source Data file.
Fig. 5
Fig. 5. Increased old yellow enzyme (OYE) gene family size promotes ROS resistance in yeasts.
A A phylogenetic tree showing the variation in size of the OYE gene family in bars for the species included in the ML model. The classification of each species is indicated as a filled circle for ROS-resistant species and an empty circle for ROS-sensitive species. B A categorical comparison showing that ROS-resistant yeasts (Class 1) had, on average, more copies of OYE genes than ROS-sensitive yeasts (Class 0). The statistical significance was determined using a two-sided t-test, and the dots represent each species included in the model (n = 57 per class). C The correlation between the number of OYE genes in each species and their relative growth (empirical area under the curve, EAUC) at either 1 or 2 mM TBOOH as specified where the shaded area represents the 95% confidence interval. The p-values shown are based on t-tests of regression coefficients phylogenetically corrected with a generalized least squares model, and the R values are adjusted for phylogenetic effects. D A spot assay showing growth of the K. lactis strains transformed with the following plasmids: an empty vector (pIL75), three independent transformants overexpressing the OYE ortholog KYE1 (pIL75-PKlTEF1-KYE1) or GFP (pIL75-PKlTEF1-GFP) to control for the effect of protein overexpression. Plates were supplemented with varying concentrations of TBOOH as indicated and incubated at 30 °C for four days before imaging. Spot assays are representative images of three replicates. E The K. lactis strains were grown in liquid SC + MSG + G418 medium with or without 0.5 mM TBOOH in a 96-well plate format. The ROS resistance of these strains was compared using the EAUC in 0.5 mM TBOOH relative to no-TBOOH controls. The points in the boxplots represent biological replicates (n = 3 for pIL75, n = 6 for KYE1 and n = 3 for GFP), and the p-values are based on two-sided t-tests relative to the GFP control. For all boxplots in this figure, the center line represents the media, the bounds of the boxes represent the interquartile range, and the whiskers represent the spread of the data. Source data are provided as a Source Data file.
Fig. 6
Fig. 6. The mannosyltransferase-encoding gene family contributes to ROS resistance in yeasts.
A A phylogenetic tree showing the variation in size of the mannosyltransferase-encoding (MNT) gene family represented as the length of the bars for the species included in the ML model. The classification of each species is indicated as a filled circle for ROS-resistant and an empty circle for ROS-sensitive. B A comparison of the number of MNT genes showing that ROS-resistant yeasts (Class 1) had, on average, larger gene families than ROS-sensitive yeasts (Class 0). The statistical significance was determined using a two-sided t-test, and the dots represent each species included in the model (n = 57 per class). C The correlation between the number of MNT genes in each species and their relative growth (empirical area under the curve, EAUC) at either 1 or 2 mM TBOOH as specified where the shaded area represents the 95% confidence interval. The p-values shown are based on t-tests of regression coefficients phylogenetically corrected with a generalized least squares model, and the R values are adjusted for phylogeny. D A spot assay showing growth of the S. cerevisiae MNT deletion strains at varying concentrations of TBOOH as indicated. Plates were incubated at 30 °C for three days before imaging. Spot assays are representative images of three replicates. E A categorical comparison of the impact of ROS stress on the growth of each strain in liquid medium based on the empirical area under the curve (EAUC) of growth curves in 1.5 mM TBOOH relative to no-TBOOH controls. The points in the boxplots represent six biological replicates per strain, the boxes represent the interquartile range, the dashed line indicates the median for the wild-type (WT) strain, and the p-values are based on two-sided t-tests relative to the WT control. For all boxplots in this figure, the center line represents the media, the bounds of the boxes represent the interquartile range, and the whiskers represent the spread of the data. Source data are provided as a Source Data file.

Similar articles

References

    1. Shen, X. X. et al. Tempo and mode of genome evolution in the budding yeast subphylum. Cell175, 1533–1545.e20 (2018). - PMC - PubMed
    1. Opulente, D. A. et al. Factors driving metabolic diversity in the budding yeast subphylum. BMC Biol.16, 26 (2018). - PMC - PubMed
    1. Opulente, D. A. et al. Genomic factors shape carbon and nitrogen metabolic niche breadth across Saccharomycotina yeasts. Science384, eadj4503 (2024). - PMC - PubMed
    1. Hittinger, C. T. et al. Genomics and the making of yeast biodiversity. Curr. Opin. Genet. Dev.35, 100–109 (2015). - PMC - PubMed
    1. Kurtzman, C. P., Fell, J. W. & Boekhout, T. The Yeasts: A Taxonomic Study, 5, Elsevier (Elsevier, 2011).

MeSH terms

Supplementary concepts

LinkOut - more resources