. 2025 Jul 1;16(1):5756.
doi: 10.1038/s41467-025-60862-7.

Identification of immunogenic and cross-reactive chikungunya virus epitopes for CD4+ T cells in chronic chikungunya disease

Affiliations

Identification of immunogenic and cross-reactive chikungunya virus epitopes for CD4+ T cells in chronic chikungunya disease

Rimjhim Agarwal et al. Nat Commun. .

Abstract

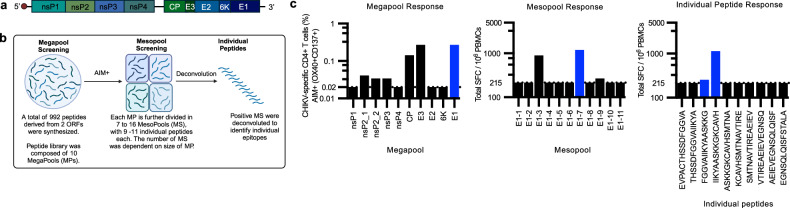
Chikungunya virus (CHIKV), a mosquito-borne alphavirus, causes acute febrile illness that can progress into chronic arthritis-like disease (CHIKVD) in humans. CD4+ T cells have important functions in CHIKV infection, yet the CHIKV target proteins for these CD4 + T cells are poorly characterized. Here, by stimulating PBMCs collected from individuals with chronic CHIKVD with peptides spanning the entire CHIKV proteome, we provide a comprehensive landscape of CHIKV CD4+ T cell epitopes. We identify three immunodominant regions and associated core motifs in CHIKV E1, nsP1 and CP proteins. In addition, by in silico assessment of the sequence conservation of CHIKV proteome with closely related alphaviruses, we define CHIKV epitopes conserved across arthritogenic and encephalitic viruses. Overall, our work describes CD4+ T cell targets of CHIKV in humans, thereby assisting in studying the functions of CD4+ T cells in CHIKV pathogenesis and vaccine design.


Conflict of interest statement

Competing interests: D.W is a consultant for Moderna. A.S. is a consultant for Alcimed, Arcturus, Darwin Health, Desna Therapeutics, EmerVax, Gilead Sciences, Guggenheim Securities, Link University and RiverVest Venture Partners. LJI has filed for patent protection for various aspects of T cell epitope and vaccine design work. The remaining authors declare no conflicts of interest.

Figures

Fig. 1
Fig. 1. Experimental workflow for screening CD4+ T cell epitopes in CHIKV.
a Schematic representation of CHIKV proteome comprising four non-structural (nsP1, nsP2, nsP3 and nsP4) and five structural proteins (Capsid or CP, E3, E2 and E1). b Workflow of epitope screening. All donors were tested in the AIM assay by stimulation with 10 megapools (MP) corresponding to each CHIKV protein (nsP1, nsP2_1, nsP2_2, nsP3, nsP4, CP, E3, E2, 6 K, E1). Positive donors in the AIM assay (OX40+ CD137+ or OX40+ CD40L+ ) were tested in the FluoroSpot assay by stimulating with smaller pools of MP, called mesopools (MS), each of which contained 9–11 individual peptides. Each MS was deconvoluted to determine individual epitopes. Created in BioRender. Weiskopf, D. (2025) https://BioRender.com/2bdm25t. c An example of the experimental workflow for the responses of one donor to the E1 protein. The first panel shows responses in the AIM assay to all CHIKV MPs tested. The middle panel shows SFCs per million PBMCs to each MS of the E1 protein. The third panel depicts responses to individual peptides in E1-7 MS. The dotted line indicates the threshold of positivity. The blue highlighted bars depict an example of a positive response from one donor.
Fig. 2
Fig. 2. Immunodominant proteins in CHIKV proteome recognized by CD4+ T cells.
a Frequency (%) of epitopes detected per CHIKV protein. n refers to the number of total epitopes identified. b The magnitude (SFC/106 PBMCs) of positive response to each epitope in the entire CHIKV proteome. The percentage shows the percent of the overall magnitude of responses elicited by each protein. The heatmap under the graph and the heatmap legend of the side of the graph indicates the number of donors that recognize each epitope, ranging from 0–9 donors. c The lower bound of the 95% confidence interval of response frequency of each epitope plotted for the non-structural (top) and structural polyprotein (bottom). Each overlapping peptide was mapped to the sequence of the representative isolate, and the response frequency for each residue was calculated using the ImmunomeBrowser tool in IEDB-AR. The lower bound of the confidence interval was plotted for each residue to visualize regions with dominant responses. The dotted line indicates the threshold of positivity (0.2). The highlighted regions depict the residue number that reaches the threshold of positivity and the associated peptide sequences.
Fig. 3
Fig. 3. Immunodominant epitopes in CHIKV recognized by CD4+ T cells.
a The magnitude of all positive responses, shown as the total number of IFNγ spot-forming cells per million PBMCs (SFC/106 PBMCs). Average response is at 1128 SFC/106 PBMCs, with responses varying from 220-21200 SFC/106 PBMCs. Each dot refers to a CHIKV epitope (n = 123). b Percentage of the total of average response for all donors plotted as a function of the total number of epitopes. Epitopes were ranked in descending order of average magnitude, and the percentage of total magnitude was calculated based on the cumulative sum of response. Dotted lines represent the number of epitopes that account for 50, 75 and 90% of total responses. c Number of epitopes recognized by each donor (n = 15). An average of 12 epitopes were identified. d The pie chart indicates the frequency of positive donor responses for each epitope. Parenthesis indicates the number of epitopes recognized by the specified number of donors. eg SFC/106 PBMCs shown for individual chronic (blue line) and recovered (gray line) donors against 15-mer peptides overlapping by 14 residues sequentially spanning the immunodominant region of (e) the nsP1 (chronic: n = 3, recovered: n = 2), (f) E1 (chronic: n = 5, recovered: n = 3) and (g) CP (chronic: n = 4) regions. The black lines indicate the average SFC/106 PBMCs for all donors shown, and the blue shaded regions depict the region with the highest response. The pie charts on the right show the percentage of HLA alleles predicted to bind to the indicated peptide sequences (i.e., the mapped epitope and negative control peptides on the N- and C-termini) shown under the pie chart. Chi-square value (two-tailed), along with the degree of freedom used and the resulting p-value, is reported for all peptide sequences. Each condition was tested in triplicate (technical replicates) in a FluoroSpot assay. Data are represented as mean ± SD (panels b, c) or geomean ± geometric SD (panels a, eg).
Fig. 4
Fig. 4. CHIKV CD4+ T cell specific epitope megapool induces a robust response.
a Frequency of antigen-specific CD4+ T cells quantified by the AIM assay (OX40+CD137+) after 24 h stimulation with CHIKV epitope megapools (MP) consisting of epitopes from structural (S), non-structural (NS) and combined structural and non-structural (CHIKV_S + NS) proteins in 19 chronic CHIKV donors (chronic; blue dots) and seven CHIKV seronegative or uninfected donors (black dots; uninfected controls (UC)), with n representing the number of donors. % Positive refers to the percent of donors who are above the LOS (0.04), indicated by the dotted line. b Frequency of specific cytokine-producing cells (IFNγ, TNFα and IL-2) from the CHIKV-specific CD4+ T cells (AIM + OX40+CD40L+) after stimulation with the combined structural and non-structural CHIKV epitope MP (CHIKV_S + NS) in chronic CHIKV donors (n = 19). % Positive refers to the percent of donors that are above the LOS (0.003), indicated by the dotted line. c Frequency of CHIKV-specific AIM + CD4+ T cell memory subsets (AIM + OX40+CD137+) in chronic CHIKV donors (n = 19) post-stimulation with the CHIKV_S + NS epitope MP, based on the expression of CCR7 and CD45RA in AIM + CD4+ T cells as: T naïve (CCR7+CD45RA+), TCM (T central memory; CCR7+CD45RA-), TEM (T effector memory; CCR7-CD45RA-) and TEMRA (T effector memory re-expressing CD45RA; CCR7-CD45RA+). Each condition was tested once in individual experiments. Data are represented as geomean ± geometric SD (panels a and b) or as mean ± SD (panel c).
Fig. 5
Fig. 5. Sequence conservation of CHIKV proteome in arthritogenic and encephalitic alphaviruses.
a Phylogenetic tree indicating the viral sequences used to calculate the percentage of conservation of CHIKV peptides. The tree is divided into arthritogenic (blue) and encephalitic (green) alphaviral sub-groups. The tree was created using the ITOL server (Letunic and Bork (2024) Nucleic Acids Res doi: 10.1093/nar/gkae268). b Magnitude of response and median percent conservation of CHIKV peptides in arthritogenic (blue) and encephalitic (green) alphaviruses. The left y-axis and gray bars refer to the magnitude of response of each CHIKV epitope. The right y-axis and blue and green lines refer to median percent conservation for each CHIKV peptide. The solid lines separate each CHIKV protein. The median of percent conservation for each CHIKV protein is shown in the table below for arthritogenic (except CHIKV) and encephalitic alphaviruses. c Median percent conservation of all CHIKV epitopes in arthritogenic (except CHIKV sequences; blue) and encephalitic (green) alphaviruses separated based on non-structural (nsP1, nsP2, nsP3 and nsP4) and structural (CP, E3, E2, 6K and E1) proteins. Each dot indicates a CHIKV epitope (non-structural proteins: n = 62; structural proteins: n = 75). d Median percent conservation of each epitope recognized by two or more donors in arthritogenic (except CHIKV sequences; blue) and encephalitic (green) alphaviruses separated based on non-structural (nsP1, nsP2, nsP3 and nsP4) and structural (CP, E3, E2, 6K and E1) proteins. Each dot indicates a CHIKV epitope (non-structural proteins: n = 5; structural proteins: n = 35). For (c) and (d), the dotted lines refer to a 67% threshold that has previously been shown to define cross-reactive epitopes. The median percent conservation for each subgroup is shown below. Data were analyzed for statistical significance using a two-tailed paired Wilcoxon signed-rank test (p > 0.05, ns = nonsignificant). Exact p-values for respective figure panels are detailed in the Source Data File.

Similar articles

References

    1. Suhrbier, A. & La Linn, M. Clinical and pathologic aspects of arthritis due to Ross River virus and other alphaviruses. Curr. Opin. Rheumatol.16, 374 (2004). - PubMed
    1. Toivanen, A. Alphaviruses: an emerging cause of arthritis?. Curr. Opin. Rheumatol.20, 486 (2008). - PubMed
    1. Zacks, M. A. & Paessler, S. Encephalitic alphaviruses. Vet. Microbiol.140, 281 (2010). - PMC - PubMed
    1. Powers, A. M. et al. Evolutionary relationships and systematics of the alphaviruses. J. Virol.75, 10118–10131 (2001). - PMC - PubMed
    1. Gérardin, P. et al. Multidisciplinary prospective study of mother-to-child Chikungunya virus infections on the Island of La Réunion. PLOS Med.5, e60 (2008). - PMC - PubMed

Substances