. 2025 Jul 1;16(1):5662.
doi: 10.1038/s41467-025-60758-6.

New molecular components of high and low affinity iron import systems in Drosophila

Affiliations

New molecular components of high and low affinity iron import systems in Drosophila

Sattar Soltani et al. Nat Commun. .

Abstract

The high abundance and molecular versatility of iron have led to its universal presence in biological systems, yet its absorption is exceptionally challenging. Animals and yeasts use divalent metal transporters to import iron, but yeasts also employ the multicopper oxidase Fet3p for high-affinity iron uptake when iron-starved. Using long-term iron depletion in Drosophila, we identified four components involved in iron absorption: Multicopper oxidase-4 (Mco4), a Fet3p ortholog, is essential for surviving iron starvation, whereas the cytochrome b561 enzymes Fire (Ferric Iron Reductase) and Fire-like, as well as cytochrome b5 protein Firewood, are required for iron absorption under normal conditions. This study reports the presence of a high-affinity iron uptake system in an animal, a cytochrome b5 electron donor for ferric iron reduction, and intestinal ferric reductases, and provides a valuable resource for further exploration of genes involved in iron homeostasis, transport, and absorption.


Conflict of interest statement

Competing interests: The authors declare no competing interests.

Figures
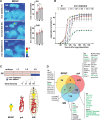
Fig. 1
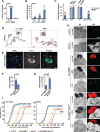
Fig. 1. RNA-Seq strategy to examine genomic response to dietary iron.
A X-Ray Fluorescence Microscopy (XRF) images of BRGC (brain-ring gland complex) samples and quantification of iron levels in the ring gland (RG) and central nervous system (CNS). Larvae were reared for one generation on iron-enriched (+i), normal (N), and in iron-depleted (−i) media, and BRGCs were dissected from L3 larvae. Average iron concentrations in the RG, (red dotted line) and CNS (white dotted line) were calculated from three replicates based on Kα emission/area ratios. Dotted lines indicate regions used to measure iron levels. Scale bars: 30 µm. The color scale bar reflects log2-based iron levels. Asterisks denote significance thresholds (*p < 0.05 and ***p < 0.001). B Survival rates and developmental progression of fly populations as a result of multi-generational iron deprivation. w1118 flies were reared for five generations (G1–G5) on either a normal diet (N) or media supplemented with BPS. Y-axes denote the percentage of pupariated animals, and X-axes show hours after egg deposition. Dotted line indicates 50% pupariation. Error bars indicate standard deviation from three biological replicates; means are centered. C Schematic of the RNA-Seq experimental design. Eggs from G5 flies reared on iron-depleted media (see B) were used to produce the G6 generation. G6 larvae were staged within 30 min after the L2/L3 molt and split into two groups: one cohort was transferred to iron-supplemented food (FAC) and the other to fresh iron-depleted media. At 4, 8, 12, and 16 h after the L2/L3 molt, BRGC (Ring gland = green, CNS = yellow), guts (red) and whole larvae (WB = whole body) were collected. L1/L2/L3 denote first, second, and third instar larvae. D Venn diagram summarizing RNA-Seq results for a total of 683 differentially expressed genes for i) the BRGC (88 genes), ii) the gut (486 genes) and iii) WB (176 genes). Example genes shown for selected sections. Green: known iron-related genes. Source data are available in the accompanying source data file.
Fig. 2
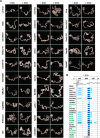
Fig. 2. Differentially expressed genes in response to dietary iron supplementation in the gut and whole-body samples.
A, B Cluster analysis of 486 and 176 differentially expressed genes in the gut and whole body (WB), respectively. On the left, 10 clusters (C1–10) and 8 clusters (C1–8) are shown as circular heat maps. For each gene, the highest RPKM value was set to 100 (red), with the remaining seven time points normalized to this maximum. Numbers indicate hours after the dietary switch. The inner four circles depict iron-depleted conditions (“−iron”), and the outer four circles show iron-supplemented conditions (“+iron”). The graphs on the right show cluster profiles (C1–10 for gut and C1–8 for WB), each paired with a representative gene. All graphs show normalized RNA-Seq expression data. Time points (x-axis) indicate hours after the dietary switch. For each gene, the highest RPKM value was set to 100%, and the remaining time points were scaled proportionally. Each cluster profile represents the average relative expression (% of maximum) across all genes in that cluster at each time point. Error bars indicate the standard error at each time point. Asterisks denote significance based on a two-sided Student’s t test (*p < 0.05 and ***p < 0.001). Source data are provided in the accompanying source data file.
Fig. 3
Fig. 3. Prussian blue staining of larval guts from selected RNAi lines.
A For each condition, 5–10 larval guts were stained with Prussian blue (ferrocyanide) and representative images are shown. Larvae were reared on iron-depleted (“− iron”, BPS-supplemented) or iron-supplemented (“+ iron”) diets. RNAi was driven by NP3084-Gal4, and NP3084 > w1118 animals served as controls. Blue staining indicates both the spatial distribution and relative levels of ferric iron accumulation. B Schematic summarizing the Prussian blue staining results shown in panel (A). Genes above the green line show higher expression under iron-depleted conditions, while those below the line are more highly expressed under iron-supplemented conditions. Gene names in green indicate known links to iron biology. AM anterior midgut, MM middle midgut, PM posterior midgut. Source data are provided in the accompanying source data file.
Fig. 4
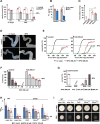
Fig. 4. Ferric iron reduction mediated by Fire, Fire-like and Firewood.
A Schematic of iron reduction and uptake mediated by Fire, Fire-like, Firewood and Malvolio (Mvl). B Diagram of the larval midgut showing the iron region (IR, green arrow) and BPS precipitation region (BPR, red arrow) in third instar larvae (L3). C Brightfield images of the BPR in midgut sections of control (Tub > w1118), Tub>fireIR, Tub>fire-likeIR, Tub>firewoodIR, fire-/-, fire-like-/- (fire2xKO) and firewoodKO animals reared on BPS-supplemented media. Also shown: control (w1118) and fire2xKO larvae reared on BPS- and L-ascorbic acid (L-AA)-supplemented media. Scale bars: 80 µm. D In situ hybridization brightfield images of fire, fire-like, firewood and Mvl in control guts (Tub > w1118). Larvae were reared on normal (no suppl.) or BPS-containing diets, and dissected at 44 h after the L2/L3 molt. Red arrows: BPR. Green arrows: IR. Scale bars: 150 µm. E Fluorescent images of the anterior midgut (AM) and IR region in larvae expressing fire-mCherry, fire-like-eGFP, reared on a BPS-supplemented diet. Scale bar: 80 µm. BF Brightfield, Green: Fire-like-eGFP, Red: Fire-mCherry. F BPR and gut pH. Top: controls (w1118) fed with BPS and bromocresol purple sodium (BCP.Na). Bottom: as above, with acetazolamide (AZM) added. Scale bars: 150 µm. G Brightfield images of the BPR in control larvae (w1118) fed i) BPS, ii) BPS + 100 µM AZM or iii) BPS + 250 µM AZM. Scale bars: 150 µm. H qPCR analysis of fire and fire-like in L3 guts from Tub>fireIR and Tub>fire-likeIR larvae. I Survival of control and fire2xKO on 250 µM BPS media. Dotted line: 50% pupariation. L1/L2/L3: 1st, 2nd and 3rd instar larvae. P: Pupae. Ad: Adults. Error bars: standard error (n = 3). J, K Total iron levels in L2 larvae (20 h after the L1/L2 molt) of control (w1118), fire2xKO and Mvl 97f larvae reared on normal or 250 μM BPS-supplemented diets. Iron was quantified by ICP-OES and normalized to body weight. Error bars: standard deviation (n = 5 for J; n = 4 for K, except Mvl 97f on BPS: n = 2). L Ferric reductase activity of lysis buffer (“buffer”) and cell lysates expressing empty vector (“emp. cells”), wild-type firewood (“firewood”), double-mutant firewood (“firewood**), fire and fire-like, or combinations thereof. Fe2+ levels were measured by ferrozine assay. Error bars: Standard error (n = 4). Statistics in (JL): ANOVA; different letters indicate significant differences (two-sided p < 0.05). M qPCR analysis of fire, fire-like, firewood, Mvl and Fer1HCH in gut vs. carcass (larval body without gut). N Expression of fire, fire-like and firewood on normal (no suppl.) or BPS-supplemented diets. H, M, N Data represent three biological replicates, each tested in triplicate. Error bars: 95% confidence intervals, center lines indicate means. Asterisks: significance by two-sided Student’s t test (***p < 0.01). Source data are provided in the accompanying source data file.
Fig. 5
Fig. 5. Mco4 is required for iron uptake into the prothoracic gland.
A RNA-Seq analysis of Mco4 expression in G6 BRGCs from larvae reared on BPS- or FAC-supplemented (iron-rich, normalized to 1) diets. B qPCR analysis of Mco4 in ring glands (RG) of control (w1118) larvae at 12, 16 and 44 h after L2/L3 molt. Larvae were reared on normal (no suppl.) and on BPS- (iron-depleted) diets. C qPCR analysis of Mco4 expression in the carcass, gut, proventriculus (PV), and gut without proventriculus (gut w/o PV) of control (w1118) larvae reared on normal (no suppl.) or BPS-supplemented diets. In (B, C), expression data are based on three biological replicates, each tested in triplicate. Error bars represent 95% confidence intervals, asterisks denote significance by two-sided Student’s t test (***p < 0.01). D Brightfield images of Mco4 in situ hybridization in control (w1118) guts from larvae reared on normal or BPS-supplemented diets. Scale bars: 150 µm. E Immunodetection of Mco4 in the proventriculus (PV) of Mco43xFLA knock-in larvae. Blue: nuclei (DAPI), gray and green: Mco4 signal. Scale bars: 100 µm. F qPCR analysis of Mco4 expression in ring glands (RG) from PG > AGBEIR and PG>Evi5IR larvae, normalized to PG > w1118 controls (set to 1). G qPCR analysis of ALAS expression in ring glands from PG > AGBEIR and PG > AGBEIR; Mco4KO larvae. F, G Data are from three biological replicates, each tested in triplicate. Error bars: 95% confidence intervals; asterisks: two-sided Student’s t test (***p < 0.01). DG All larvae were dissected at 44 h after the L2/L3 molt. H Red autofluorescence in ring glands of i) control, ii) Mco4KO, iii) PG > AGBEIR and iv) PG > AGBEIR; Mco4KO larvae reared on normal (no suppl.), iron-rich (+FAC) and iron-depleted (+BPS) diets. UV ultraviolet, BF brightfield. Scale bars: 250 µm. I Developmental timing analysis of control, Mco4KO, PG > AGBEIR and PG > AGBEIR; Mco4KO larvae reared on normal (no suppl.) or BPS-supplemented diets. Y-axis: percentage pupariated. X-axis: hours after egg deposition. Dotted line marks 50% pupariation. Error bars: standard error (n = 3); center lines in (B, C, F, G, and I) represent means. Source data are provided in the accompanying source data file.
Fig. 6
Fig. 6. Mco4 functions as a ferroxidase in dietary iron absorption.
A Adult survival of Mco4KO and control (w1118) flies on normal (no suppl.) and iron-depleted diets (BPS). Flies were reared for three generations (G1-G3) on BPS-containing media. Dotted line: 50% pupariation. Error bars: standard error (n = 3). B Iron content of L3 control and Mco4KO larvae measured by ICP-MS. Animals reared on normal (no suppl.) or BPS media, L3 larvae collected at 44 h after the L2/L3 molt. Y-axes: elemental iron (µg) per body weight (gram). Error bars: standard error (n = 3). C Ferroxidase assay of S2 cell extracts expressing empty vector (emp. vec.), human hephaestin (HEPH) or Mco4. Error bars: standard error (n = 4). Asterisks in (AC) indicate significance (two-sided Student’s t test, ***p < 0.01). D Prussian blue staining of larval guts from Tub > w1118 and Tub>Mco4-cDNA larvae reared on normal (no suppl.) or BPS-supplemented diets. Blue color indicates ferric iron accumulation. Scale bars: 80 µm. E Developmental timing of control (Tub > w1118) and Tub>Mco4-cDNA larvae reared on normal diet (no suppl.) or BPS-supplemented food (300 µM, red; 500 µM, green). Y-axis: percentage pupariated. X-axis: hours after egg deposition. F Survival analysis of control and Tub>Mco4-cDNA larvae on 500 µM BPS-supplemented diet. Dotted line marks 50% pupariation. L1/L2/L3: 1st, 2nd, 3rd instar larvae, P pupae, AD adults. G Survival of adult controls (w1118) on i) normal (no suppl.), ii) 500 µM BPS, iii-v) 500 µM BPS plus 160 µM, 300 µM and 500 µM FAC diets. Dotted line denotes 50% pupariation. H OD600 measurements of wild-type and ∆Fet3 yeast transformed with plasmids expressing Mco4 cDNA, Fet3 cDNA, or empty vector (emp. vector). Plasmids expressing Fet3 or Mco4 also co-expressed Ftr1. Cells were grown in synthetic drop-out medium containing zero (no suppl.), 80 and  160 µM BPS. Statistics: ANOVA; different letters denote significant differences (two-sided p-value < 0.05). EH Error bars: standard error (n = 3); center lines represent means. I Growth of transformed yeast colonies on control (no suppl.) and BPS-supplemented (80 µM) media. Scale bars: 5 mm. Source data are provided in the accompanying source data file.

Similar articles

References

    1. Sheftel, A. D., Mason, A. B. & Ponka, P. The long history of iron in the Universe and in health and disease. Biochim. Biophys. Acta1820, 161–187 (2012). - PMC - PubMed
    1. Muckenthaler, M. U., Rivella, S., Hentze, M. W. & Galy, B. A red carpet for iron metabolism. Cell168, 344–361 (2017). - PMC - PubMed
    1. Lill, R. Function and biogenesis of iron-sulphur proteins. Nature460, 831–838 (2009). - PubMed
    1. Barupala, D. P., Dzul, S. P., Riggs-Gelasco, P. J. & Stemmler, T. L. Synthesis, delivery and regulation of eukaryotic heme and Fe-S cluster cofactors. Arch. Biochem. Biophys.592, 60–75 (2016). - PMC - PubMed
    1. Caldas Nogueira, M. L., Pastore, A. J. & Davidson, V. L. Diversity of structures and functions of oxo-bridged non-heme diiron proteins. Arch. Biochem. Biophys.705, 108917 (2021). - PMC - PubMed

MeSH terms

LinkOut - more resources