. 2025 Jul 1;16(1):5833.
doi: 10.1038/s41467-025-60866-3.

Rewiring of 3D chromatin topology orchestrates transcriptional reprogramming in muscle fiber-type specification and transformation

Affiliations

Rewiring of 3D chromatin topology orchestrates transcriptional reprogramming in muscle fiber-type specification and transformation

Baohua Tan et al. Nat Commun. .

Abstract

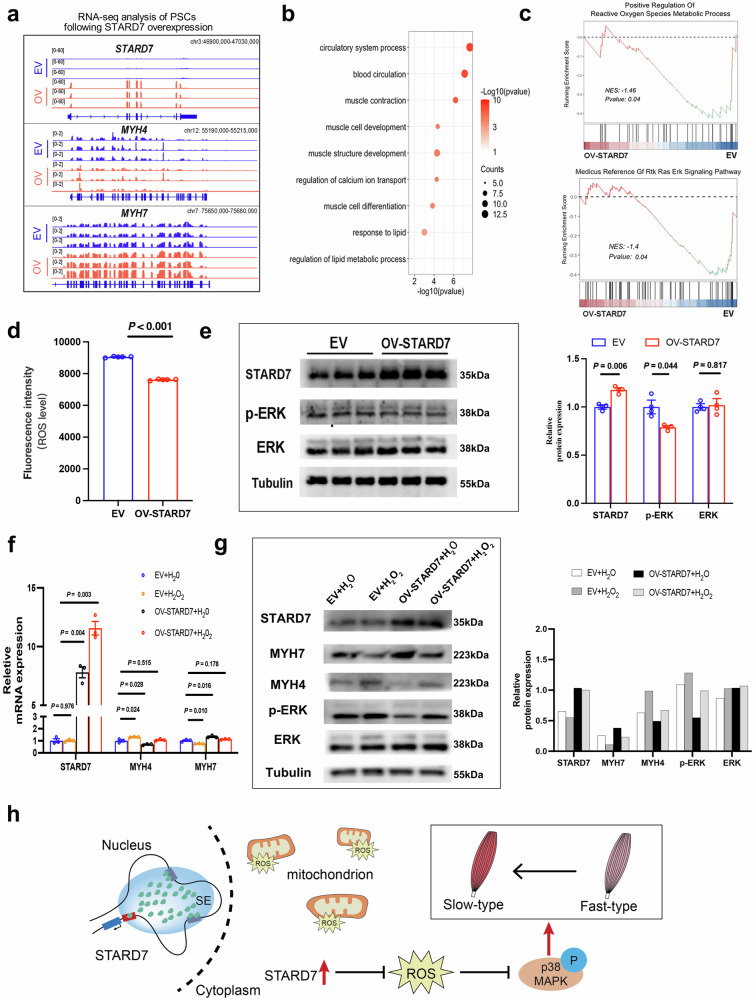
The composition of muscle fibers, characterized by distinct contractile and metabolic properties, significantly influences meat quality and glucose homeostasis. However, the mechanisms by which three-dimensional (3D) genome topology integrates with epigenetic states to regulate muscle fiber specification and transformation remain poorly understood. Here, we present an integrative analysis of the transcriptome, epigenome, and 3D genome architecture in the slow-twitch glycolytic extensor digitorum longus (EDL) and fast-twitch oxidative soleus (SOL) muscles of the pig (Sus scrofa). Global remodeling of enhancer-promoter (E-P) interactions emerged as a central driver of transcriptional reprogramming associated with muscle contraction and glucose metabolism. We identified tissue-specific super-enhancers (SEs) that regulate muscle fiber-type specification through cooperation of chromatin looping and transcription factors such as KLF5. Notably, the SE-driven activation of STARD7 facilitated the transformation of glycolytic fibers into oxidative fibers by mitigating reactive oxygen species levels and suppressing ERK MAPK signaling. This study elucidates the principles of 3D genome organization in the epigenetic regulation of muscle fiber specification and transformation, providing a foundation for novel therapeutic strategies targeting metabolic disorders and enhancing meat quality.


Conflict of interest statement

Competing interests: The authors declare no competing interests.

Figures

Fig. 1
Fig. 1. Transcriptome dynamics and genome-wide analysis of CREs in SOL and EDL.
a Isolated EDL and SOL muscles. b Representative immunofluorescent staining of slow-twitch MyHC I (red) and fast-twitch MyHC IIb (green) in SOL and EDL sections. Magnification: ×20, Bar = 200 μm. c Heatmap of muscle fiber-type marker gene expression. d Classification and annotation of chromatin states, with each row representing a chromatin state and each column denoting histone marks, chromatin accessibility, genomic annotation, and gene expression levels. TssAFlank1 (n = 56, median = 1.076648): high H3K4me3 and ATAC-seq signal; TssAFlank2 (n = 214, median = 1.129079): high H3K4me3 but weak ATAC-seq signal. EnhA1 (n = 55, median = 1.476194): high H3K27ac and ATAC-seq signal; EnhA2 (n = 161, median = 1.460204): weak H3K27ac and ATAC-seq signal. RepPC (n = 65, median = 0.5147669): high H3K27me3 signal. Quiescent (n = 192, median = 0.6704646): lack epigenetics signal. e Tissue specificity of identified CREs. f Alluvial diagram depicting changes in promoter chromatin states of DEGs. g Expression changes of DEGs with switched chromatin states. Boxes represent the interquartile range with the median as a horizontal line; whiskers extend to the 5th and 95th percentiles. Significance was tested using a two-sided Wilcoxon test. h Functional enrichment analysis of tissue-specific enhancers using GREAT. Significance was tested using binomial test. i ATAC-seq tracks, chromatin states, and histone modifications at SLN and UQCR10 loci and their associated enhancers in SOL and EDL.
Fig. 2
Fig. 2. Characterization of the 3D Chromatin Organization in SOL and EDL.
a Compartment switching between SOL and EDL. b The expression changes of genes located within regions that underwent the compartment switch. A-to-B (n = 576, median = 0.163); B-to-A (n = 536, median = −0.0529); stable (n = 11581, median = 0.0071). c SIM1 gene locus underwent a B-to-A switch from SOL to EDL, with higher expression in EDL than SOL. Tracks for RNA-seq and ATAC-seq signal, and histone modification are shown. d Overlap of TAD boundaries between SOL and EDL. e Pearson correlation coefficient was calculated between the insulation scores of TADs (n = 2981) in SOL and EDL. Statistical significance was assessed using a two-sided Pearson correlation test. f The distribution of DEGs and CREs in changed TADs and cTADs. g Gene expression levels in cTADs (n = 2376) with relatively low, medium, or high D-scores. h The enriched GO terms for genes within the cTADs with higher D-scores in EDL (EDL) and cTADs with higher D-scores in SOL (SOL). Significance was tested using binomial test. i Representative cTAD with different D-scores in two tissues. Top: Hi-C contact heatmaps of the genomic region containing MYH2 gene locus. D-scores of cTAD were marked. Middle: TAD boundaries and genome browser tracks of PC1 values. Bottom: tracks for RNA-seq and ATAC-seq signal, CTCF, and histone modification. For (b and g), boxes represent the interquartile range with the median as a horizontal line; whiskers extend to the 5th and 95th percentiles. Significance was tested using a two-sided Wilcoxon test (b) and two-sided Kruskal–Wallis test (g).
Fig. 3
Fig. 3. Global remodeling of E-P interactions underpins functional divergence in SOL and EDL.
a APA analysis of chromatin loops in SOL (n = 16,086) and EDL (n = 12,923). Bin size: 10 kb. b Proportion of inter-TAD and intra-TAD loops. c Distribution of loop interaction types: P-S (promoter-silencer), P-P (promoter-promoter), P-E (promoter-enhancer), and P-none (promoter with no other CREs). d Overlap of genes with distinct E-P interactions (top-left). Schematic representation of E-P rewiring for Groups I–III. e The proportion of DEGs in Groups I–III. f Transcriptional changes for genes in Groups I–III. Log2 (Foldchange) represents as the change of gene expression in SOL compared to EDL. ALL (n = 15125, median = 0.0093); I (n = 27, median = −1.0220); II (n = 36, median = −1.1904); III (n = 100, median = 1.2397). Boxes represent the interquartile range with the median as a horizontal line; whiskers extend to the 5th and 95th percentiles. Significance was tested using a two-sided Wilcoxon test. g The expression and binding enrichment of Top 10 TFs enriched in I–III loops. Color scale represent original values as indicated in the color bar. h Percentage of loops with TFBS for selected TFs. i The enriched GO terms for genes in Group I–III. II_activated: GO term that more activated in Group II; III_activated: GO term that more activated in Group III; Common: GO term common in three Groups. j Chromatin interactions around TNNI1 and TNNI2 locus. Top: Virtual 4 C profile of loop contact differences. Tracks for chromatin loops, RNA-seq, ATAC-seq, CTCF, histone modifications, and TFBS are shown below. Enhancers are marked in green.
Fig. 4
Fig. 4. Super-enhancers control muscle fiber-type specification via proximity and chromatin looping.
a Hockey stick plots based on input-normalized H3K27ac signals in SOL and EDL, highlighting SOL-specific genes (red) and EDL-specific genes (blue). b GO term enrichment for SE-proximal genes. c Tracks of RNA-seq, ATAC-seq, CTCF, histone modifications, and TFBS at the MYH7 locus. SE regions are marked in green. d Expression heatmap of SE-anchored genes. e Epigenetic states and chromatin interactions at MYH1 and MYH4 locus. Virtual 4 C plots show chromatin contact differences; tracks for RNA-seq, ATAC-seq, CTCF, and histone modifications are included. SE regions are marked in green. f 3D chromatin conformation models around the gene locus (bin size: 10 kb). g MYH7 and MYH4 expression changes after SE deletion in differentiated PSCs (n = 3). h Immunofluorescence staining of KLF5, Fast-type MyHC, and Slow-type MyhC in the EDL muscle. (Green: Slow-MyHC; Red: Fast-MyhC; Purple: KLF5; Blue: Nuclei) (n = 3). Fast-MyHC antibody detects total fast skeletal myosin heavy chain isoforms including MYH2, MYH4, and MYH8. The percentages indicate the proportion of KLF5-positive nuclei within slow-type or fast-type fibers. i Aggregate TF footprint plots for KLF5 in SOL and EDL muscles. j Track of KLF5 ChIP-seq in C2C12 myotubes differentiated for 0 day, 2 days, and 5 days. KLF5 peak was filled in green. k qPCR showing the expression change after KLF5 overexpression in differentiated PSCs (n = 3). l ChIP-qPCR showing the enrichment change of H3K27ac in SE-MYH1/4 after KLF5 overexpression in differentiated PSCs (n = 3). The enrichment level is shown as a percentage of input. IgG was used as a negative control. m Dual-reporter assay detecting the enhancer activity of SE-MYH1/4 after KLF5 overexpression in differentiated PSCs (n = 4). n 3C-qPCR showing the interaction frequencies of SE-MYH1/4 with gene promoters after KLF5 overexpression in differentiated PSCs (n = 3). For (g, kn), significance was tested by a two-tailed unpaired student’s t-test. All values are presented as mean ± SEM.
Fig. 5
Fig. 5. The function of super-enhancers in muscle fiber-type transformation.
a Top: Pearson correlation coefficients between SE-regulated DEGs and MYH7 or MYH4. Bottom: Expression heatmap of SE-regulated DEGs in postnatal pig skeletal muscle at eight developmental stages. b Heatmap of 22 SE-regulated DEGs that conserved between pig and mouse SOL and EDL muscles. c Virtual 4 C plot of chromatin interactions around the STARD7 locus. Enhancers are marked in green. d 3D chromatin models of the STARD7 locus based on Hi-C data. e 3C-qPCR analysis of STARD7 promoter interactions in SOL and EDL. Interaction frequency is calculated relative to the R1 site. f Dual-luciferase reporter assay validating enhancer activity of TE-STARD7 and SE-STARD7 in PSCs (n = 3 per group). g, h Expression changes of STARD7 after TE-STARD7 (g) and SE-STARD7 (h) deletion in PSCs (n = 3 per group). For (eh), significance was tested by a two-tailed unpaired student’s t-test. All values are presented as mean ± SEM.
Fig. 6
Fig. 6. STARD7 induces the transformation of glycolytic fiber to oxidative fiber.
a, b Immunofluorescence staining of fast-type MyHC and slow-type MyHC following STARD7 knockdown (a) and overexpression (b) in differentiated PSCs (n = 3). left panel: Representative images of immunofluorescence staining. Right panel: Statistical analysis of MYH7+ and MYH4+ fibers. Magnification, × 10, Bar = 200 µm. c, d qPCR and WB depicting the gene expression change between STARD7 knockdown and control group in differentiated PSCs (n = 3). e, f qPCR and WB showing the gene expression change between STARD7 overexpression and expression vector (EV) group in differentiated PSCs (n = 3). g, h The change of ECAR after STARD7-knockdown (g) and overexpression (h) in differentiated PSCs. Values represent the average of three independent experiments with four technical replicates for each assay. i, j The expression changes of maker genes (oxidative: COX5B, COX6B, CS, NDUFB4, PGC-1α, UQCR10; glycolytic: GPI, HK2, PKM, LDHA, LDHB; slow-type troponin: TNNC1, TNNI1, and TNNT1; fast-type troponin: TNNC2, TNNI2, and TNNT2) after STARD7 knockdown (i) and overexpression (j) in differentiated PSCs. k Representative images of GAS muscles from the left (shNC) or right (shSTARD7) hindlimbs. l, m qPCR and WB depicting of gene expression in GAS muscles from LV3-shSTARD7 and LV3-shNC groups (n = 3). n Expression changes of maker genes in GAS muscles from LV3-shSTARD7 and LV3-shNC group (n = 3 per group). o Immunofluorescence staining of fast-type myosin and slow-type myosin of GAS muscles from LV3-shSTARD7 and LV3-shNC group (n = 3 per group). Left: Representative images of immunofluorescence staining. Right: statistical analysis of the proportion changes of slow-type fibers (green) and fast-type fibers (red). Magnification, ×20, Bar = 50 µm. pr The comparison of GAS muscle (n = 3 per group) in terms of weight, cross-sectional area, and meat color. L: lightness value; a*: redness value; b*: yellowness value. For (aj), significance was tested by a two-tailed unpaired student’s t-test. two-sided unpaired t-test. For (lr), significance was tested by a two-tailed paired student’s t-test. All values are presented as mean ± SEM.
Fig. 7
Fig. 7. STARD7 reduces intracellular ROS levels and ERK MAPK activity.
a RNA-seq tracks for STARD7, MYH4, and MYH7 loci in OV-STARD7 and empty vector (EV) PSC cells. b GO enrichment analysis of DEGs between OV-STARD7 and EV cells. c GSEA analysis of OV-STARD7 and EV cells. d Quantification of intracellular ROS levels in OV-STARD7 and EV cells (n = 3 per group). Excitation wavelength: 488 nm, emission wavelength: 525 nm. e Levels of phosphorylated ERK (p-ERK) and total ERK in OV-STARD7 and control cells (n = 3 per group). f, g qPCR and WB results showing the impact of exogenous H₂O₂ on STARD7-mediated muscle fiber-type transformation. h Schematic model of STARD7 regulation in muscle fiber-type transformation. For (dg), significance was tested by a two-tailed unpaired student’s t-test. All values are presented as mean ± SEM.

References

    1. Wu, H. & Ballantyne, C. M. Skeletal muscle inflammation and insulin resistance in obesity. J. Clin. Invest.127, 43–54 (2017). - PMC - PubMed
    1. Picard, B., Lefaucheur, L., Berri, C. & Duclos, M. J. Muscle fibre ontogenesis in farm animal species. Reprod. Nutr. Dev.42, 415–431 (2002). - PubMed
    1. Tajsharghi, H. & Oldfors, A. Myosinopathies: pathology and mechanisms. Acta Neuropathol.125, 3–18 (2013). - PMC - PubMed
    1. Schiaffino, S. & Reggiani, C. Fiber types in mammalian skeletal muscles. Physiol. Rev.91, 1447–1531 (2011). - PubMed
    1. Oberbach, A. et al. Altered fiber distribution and fiber-specific glycolytic and oxidative enzyme activity in skeletal muscle of patients with type 2 diabetes. Diabetes Care29, 895–900 (2006). - PubMed

LinkOut - more resources