. 2025 Jul 1;11(1):294.
doi: 10.1038/s41420-025-02577-8.

N6-methyladenosine modification of MEF2A weakens cetuximab sensitivity in colorectal cancer via PD-L1/SOX12 axis

Affiliations

N6-methyladenosine modification of MEF2A weakens cetuximab sensitivity in colorectal cancer via PD-L1/SOX12 axis

Cao Gao et al. Cell Death Discov. .

Abstract

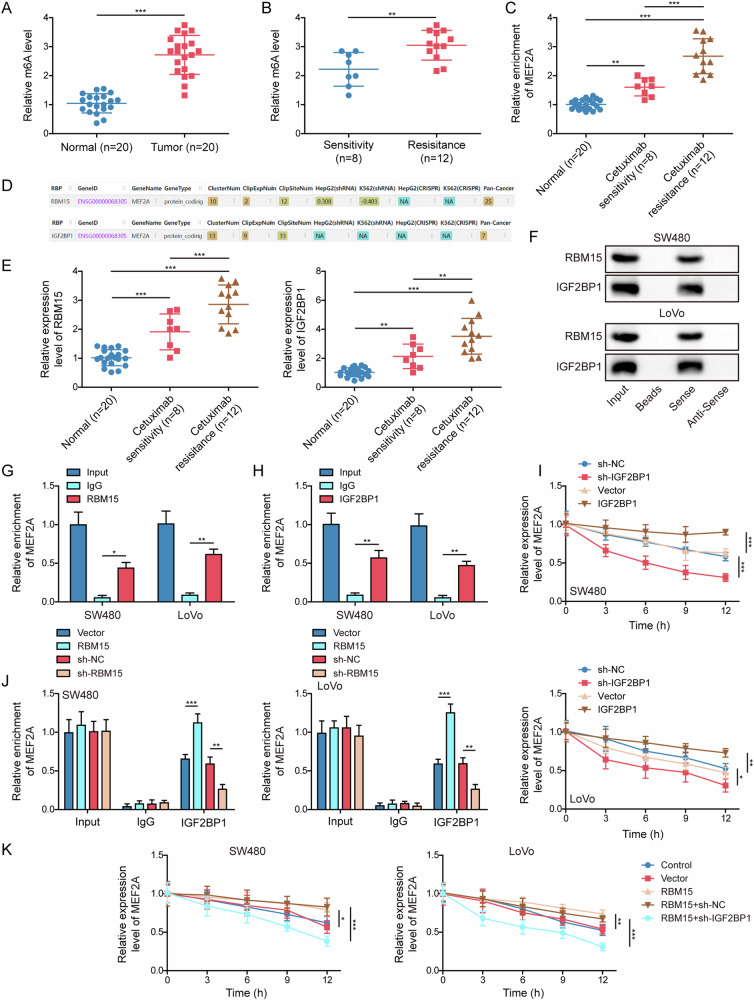
Colorectal cancer (CRC) treatment is still a challenge due to chemoresistance. We explored MEF2A function and underlying mechanism on cetuximab sensitivity in CRC. In this study, cancer tissues and adjacent non-cancerous samples were harvested from CRC patients. Cell viability, proliferation and apoptosis in CRC cells were tested by CCK-8, EdU, colony formation, and flow cytometry assays. The binding of MEF2A on the PD-L1 promoter was validated using luciferase reporter assay, CHIP, and EMSA, while the relationship of PD-L1 and SOX12 mRNA, as well as RBM15/IGF2BP1 and MEF2A mRNA, was verified by RIP, RNA pull-down, or FISH combined with immunofluorescence. m6A modification level of MEF2A mRNA was assayed by MeRIP. The expressions of key genes and proteins, including MEF2A, PD-L1, SOX12, RBM15, IGF2BP1, apoptosis- and cell cycle-related proteins, were determined with RT-qPCR, western blot, or immunohistochemistry. In vivo function of MEF2A was validated by establishing a xenograft nude mice model. The results showed that MEF2A was increased in CRC cells and tissues, while it was higher in cetuximab-resistant CRC tissues. Silencing MEF2A improved the sensitivity of cetuximab in CRC cells and xenograft mice. MEF2A binds to PD-L1 promoter to transcriptionally upregulate PD-L1 expression. Increased cetuximab sensitivity was observed in PD-L1 knockout (KO) CRC cells. PD-L1 overexpression reversed the enhanced cetuximab sensitivity induced by MEF2A knockdown. PD-L1 binds to SOX12 mRNA to stabilize its expression. PD-L1 knockdown augmented cetuximab sensitivity, which was overturned by SOX12 overexpression. The m6A modification mediated by RBM15/IGF2BP1 upregulated MEF2A expression in cetuximab-resistant CRC tissues. In conclusion, m6A-modified MEF2A alleviated cetuximab sensitivity in CRC via PD-L1/SOX12 mRNA axis, indicating that MEF2A might function as a promising therapeutic target against cetuximab-resistant CRC.


Conflict of interest statement

Competing interests: The authors declare no competing interests. Ethics approval and consent to participate: The present research was approved by the Ethics Committee of Soochow University, and written consent was gained from all individuals. Animal experiments had been approved by the Animal Care and Use Committee of Soochow University.

Figures

Fig. 1
Fig. 1. MEF2A was increased in CRC tissues, cetuximab-resistant CRC tissues, as well as CRC cell lines.
CRC patients (n = 20, including 8 cetuximab-sensitive and 12 cetuximab-resistant specimens) were recruited for the collection of cancerous tissues and adjacent non-cancerous tissues. RT-qPCR for measuring MEF2A mRNA levels in normal tissues and cancerous tissues (A), as well as in cetuximab-resistant and cetuximab-sensitive CRC tissues (B). MEF2A protein level in clinical samples was detected with immunohistochemistry. Scale bar: 50 μm and 10 μm (C). D The association between 3-year and 5-year survival rates of CRC patients and MEF2A level showed by bioinformatics analysis (Kaplan–Meier Plotter). E In normal colonic epithelial cell line (FHC) and CRC cell lines (HCT 116, SW480, SW620, Caco-2, and LoVo), MEF2A protein levels were determined with western blot. All bar chart analysis of western blot is a repeated experiment three times. *p < 0.05, **p < 0.01, and ***p < 0.001.
Fig. 2
Fig. 2. MEF2A knockdown enhanced cetuximab sensitivity in CRC cells.
A, B sh-MEF2A was transfected into CRC cells (SW480 and LoVo) for 48 h. MEF2A mRNA and protein expressions were determined using RT-qPCR (A) and western blot (B). CRC cells were transfected with sh-MEF2A, before cetuximab exposure. CCK-8 assay was used for measuring cell viability (C), and IC50 values were calculated (D). Clonal formation assay (E) and EdU staining (F) for detecting cell proliferation. Scale bar: 100 μm. All bar chart analysis of western blot is a repeated experiment three times. *p < 0.05, **p < 0.01, and ***p < 0.001.
Fig. 3
Fig. 3. MEF2A bound to PD-L1 promoter to transcriptionally upregulate PD-L1 expression.
The binding motif for MEF2A (A) and MEF2A binding sequences at PD-L1 promoter region (B) were forecasted through JASPAR database. Luciferase reporter assay (C), CHIP (D), and EMSA (E) for analyzing the binding of MEF2A protein on PD-L1 promoter in CRC cells. F, G sh-MEF2A or MEF2A overexpression vector was transfected into CRC cells. RT-qPCR (bF) and western blot (G) for testing PD-L1 mRNA and protein expressions. All bar chart analysis of western blot is a repeated experiment three times. *p < 0.05, **p < 0.01, and ***p < 0.001.
Fig. 4
Fig. 4. Knockdown of MEF2A boosted cetuximab sensitivity in CRC by inhibiting PD-L1 transcription.
CRC cells transfected with sh-MEF2A or PD-L1 overexpression vector were exposed to cetuximab. A Western blot was performed for measuring MEF2A and PD-L1 protein expressions. B CCK-8 for measuring cell viability. Cell proliferation was detected with clonal formation assay (C) and EdU staining (D). Scale bar: 100 μm. E Flow cytometry for assessing apoptosis. F Western blot for measuring cleaved caspase-3, uncleaved PARP, cyclin D1, cyclin E1, and CDK2. All bar chart analysis of western blot is a repeated experiment three times. *p < 0.05, **p < 0.01, and ***p < 0.001.
Fig. 5
Fig. 5. PD-L1 bound to SOX12 mRNA and stabilized its expression.
A PD-L1 protein pulled down by biotinylated SOX12 probe in RNA pull-down assay. B The co-localization of SOX12 mRNA and PD-L1 was measured using FISH combined with immunofluorescence. Scale bar: 25 μm. Representative immunofluorescence (C) and FISH (D) images in the negative control experiments. Scale bar: 25 μm. E RIP for detecting the binding relationship between PD-L1 and SOX12 mRNA. F Actinomycin D was added into CRC cells transfected with sh-PD-L1 or PD-L1 overexpression vector. SOX12 mRNA expressions were tested using RT-qPCR. G SOX12 level in CRC was analyzed using bioinformatics analysis (UALCAN). H SOX12 mRNA levels in normal tissues (n = 20), cetuximab-sensitive (n = 8) and cetuximab-resistant (n = 12) CRC tissues were detected with RT-qPCR. I Western blot for determining SOX12 protein level in CRC cells. All bar chart analysis of western blot is a repeated experiment three times. *p < 0.05, **p < 0.01, and ***p < 0.001.
Fig. 6
Fig. 6. PD-L1 knockdown strengthened cetuximab sensitivity by inhibiting the stability of SOX12 mRNA.
CRC cells transfected with sh-PD-L1 or SOX12 overexpression vector were exposed to cetuximab. A Western blot for testing PD-L1 and SOX12 protein expressions. B CCK-8 assay for cell viability measurement. EdU staining (C) and clonal formation assay (D) for determining cell proliferation. Scale bar: 100 μm. E Apoptosis analyzed by flow cytometry. F Western blot for determining the expressions of cleaved caspase-3, uncleaved PARP, cyclin D1, cyclin E1 and CDK2. All bar chart analysis of western blot is a repeated experiment three times. *p < 0.05, **p < 0.01, and ***p < 0.001.
Fig. 7
Fig. 7. RBM15/IGF2BP1-mediated m6A modification led to upregulation of MEF2A in cetuximab-resistant CRC tissues.
A Total m6A levels in adjacent normal tissues and cancerous tissues (n = 20) were tested by commercial kit. B Total m6A levels in cetuximab-sensitive (n = 8) and resistant (n = 12) CRC tissues. C MeRIP for measuring m6A modification level of MEF2A mRNA in normal tissues (n = 20), cetuximab-sensitive (n = 8) and resistant (n = 12) CRC tissues. D Bioinformatics prediction (ENCORI) showed the recognition of MEF2A mRNA by both “writer” RBM15 and “reader” IGF2BP1. E RT-qPCR for testing the mRNA expressions of RBM15 and IGF2BP1 in normal tissues (n = 20), cetuximab-sensitive (n = 8) and resistant (n = 12) CRC tissues. The combination of RBM15/IGF2BP1 with MEF2A mRNA was validated using RNA pull-down (F) and RIP (G, H) in CRC cells. I Actinomycin D was added into CRC cells transfected with sh-IGF2BP1 or IGF2BP1 overexpression vector. MEF2A mRNA level was determined by RT-qPCR. J CRC cells were transfected with sh-RBM15 or RBM15 overexpression vector. RIP was used to verify IGF2BP1 binding to MEF2A mRNA. K RBM15 overexpression vector or sh-IGF2BP1 was co-transfected into CRC cells, before actinomycin D treatment. MEF2A mRNA expression was tested by RT-qPCR. *p < 0.05, **p < 0.01, and ***p < 0.001.
Fig. 8
Fig. 8. MEF2A knockdown promoted cetuximab sensitivity in CRC xenograft nude mice.
CRC cells (SW480 or LoVo) with stable MEF2A knockdown were subcutaneously injected into nude mice, before cetuximab treatment. A Tumors formed in each group. B Tumor size. C Tumor weight. D Immunohistochemistry for observing Ki-67 expression in tumor tissues. Scale bar: 50 μm. E TUNEL staining for assessing apoptosis in tumor tissues. Scale bar: 50 μm. F Immunohistochemistry for measuring MEF2A expression in tumor tissues. Scale bar: 50 μm. G MEF2A, PD-L1, and SOX12 protein levels in tumor tissues were determined using western blot. H The protein expressions of cleaved caspase-3, uncleaved PARP, cyclin D1, cyclin E1, and CDK2 in tumor tissues were tested by western blot. All bar chart analysis of western blot is a repeated experiment three times. *p < 0.05, **p < 0.01, and ***p < 0.001.

Similar articles

References

    1. Patel SG, Dominitz JA. Screening for colorectal cancer. Ann Intern Med. 2024;177:ITC49–ITC64. 10.7326/AITC202404160. - PubMed
    1. Carlsen L, Huntington KE, El-Deiry WS. Immunotherapy for colorectal cancer: mechanisms and predictive biomarkers. Cancers. 2022;14. 10.3390/cancers14041028. - PMC - PubMed
    1. Zhou J, Ji Q, Li Q. Resistance to anti-EGFR therapies in metastatic colorectal cancer: underlying mechanisms and reversal strategies. J Exp Clin Cancer Res. 2021;40:328 10.1186/s13046-021-02130-2. - PMC - PubMed
    1. Rios-Hoyo A, Monzonis X, Vidal J, Linares J, Montagut C. Unveiling acquired resistance to anti-EGFR therapies in colorectal cancer: a long and winding road. Front Pharm. 2024;15:1398419. 10.3389/fphar.2024.1398419. - PMC - PubMed
    1. Di Giorgio E, Hancock WW, Brancolini C. MEF2 and the tumorigenic process, hic sunt leones. Biochim Biophys Acta Rev Cancer. 2018;1870:261–73. 10.1016/j.bbcan.2018.05.007. - PubMed

LinkOut - more resources