. 2025 Jul 1;16(1):482.
doi: 10.1038/s41419-025-07766-y.

Exploiting mitochondrial dysfunction to overcome BRAF inhibitor resistance in advanced melanoma: the role of disulfiram as a copper ionophore

Affiliations

Exploiting mitochondrial dysfunction to overcome BRAF inhibitor resistance in advanced melanoma: the role of disulfiram as a copper ionophore

Bolun Zhao et al. Cell Death Dis. .

Abstract

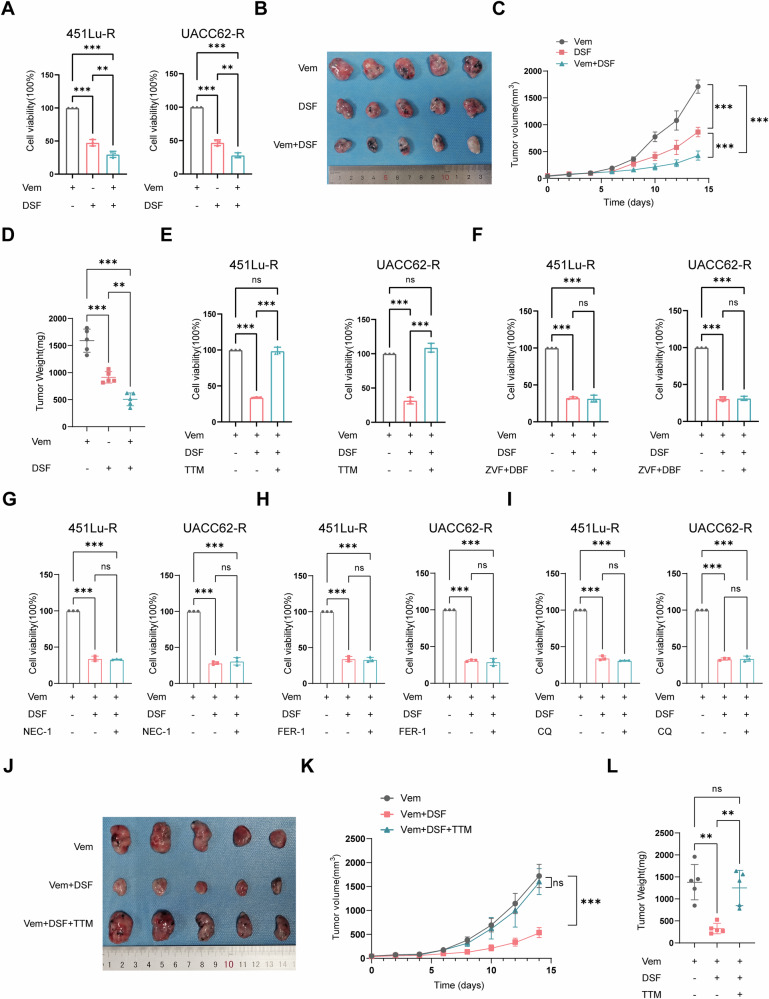
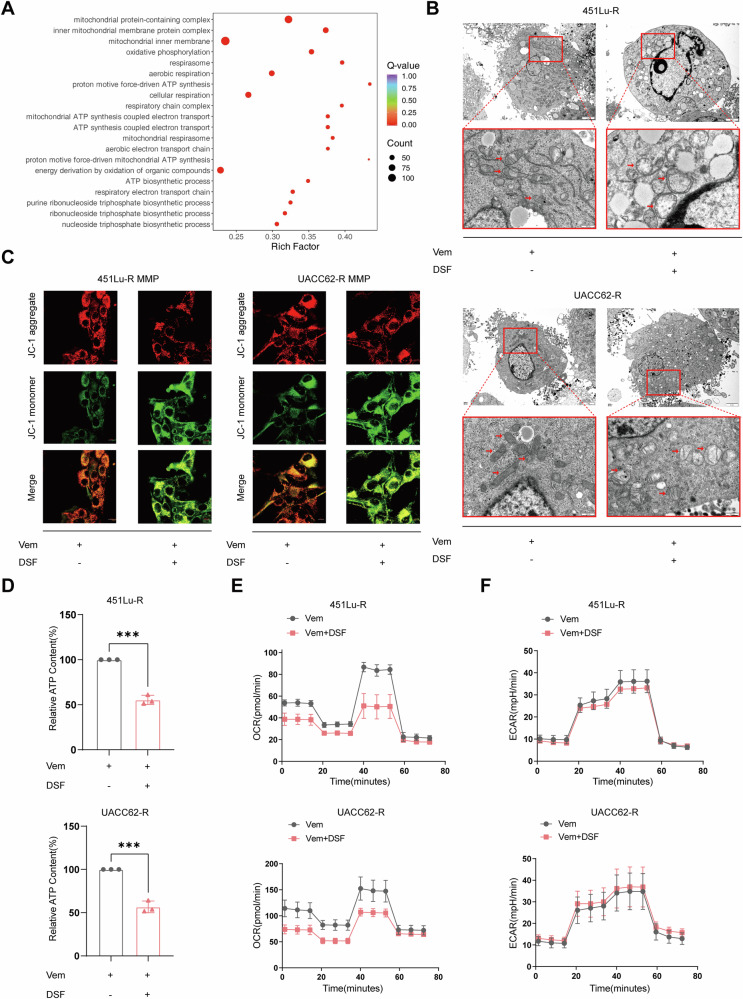
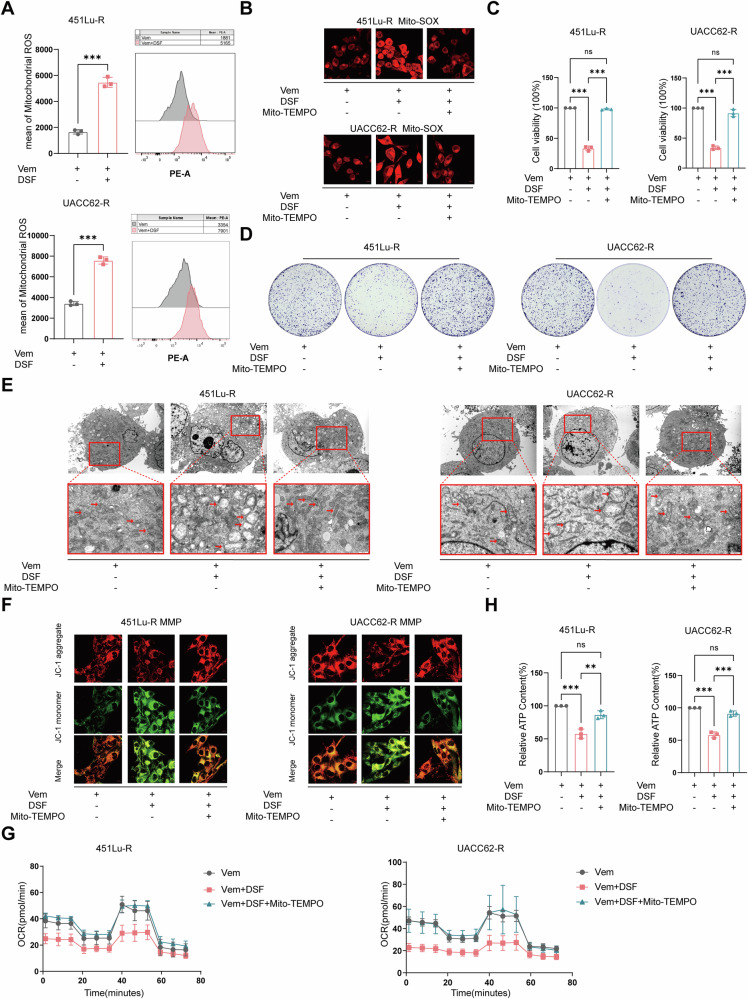
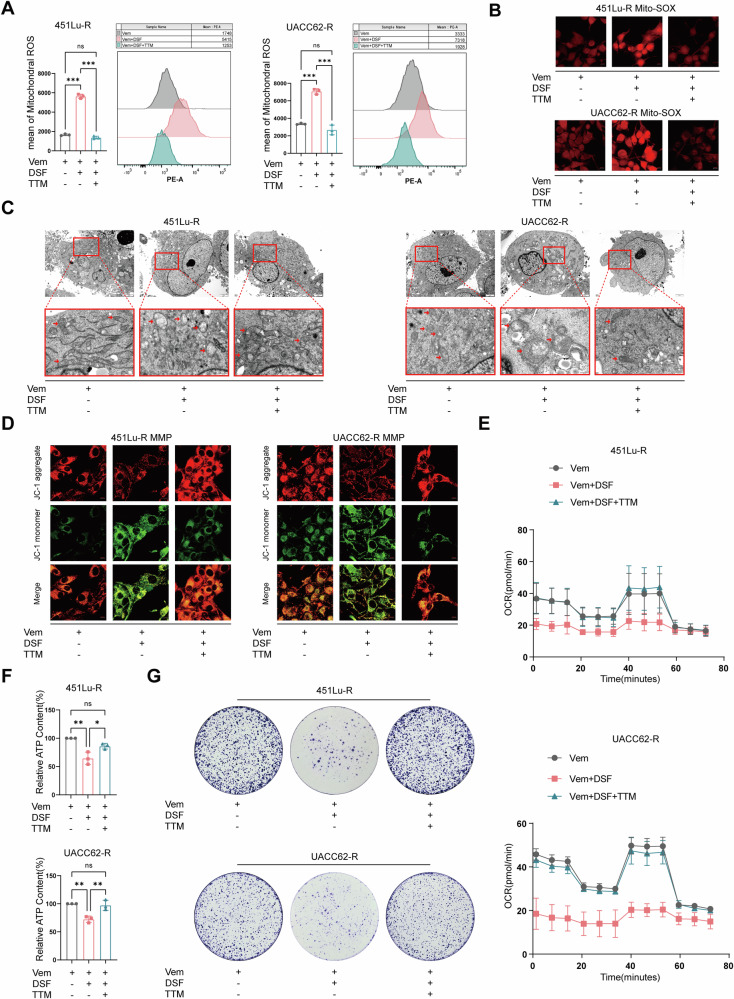
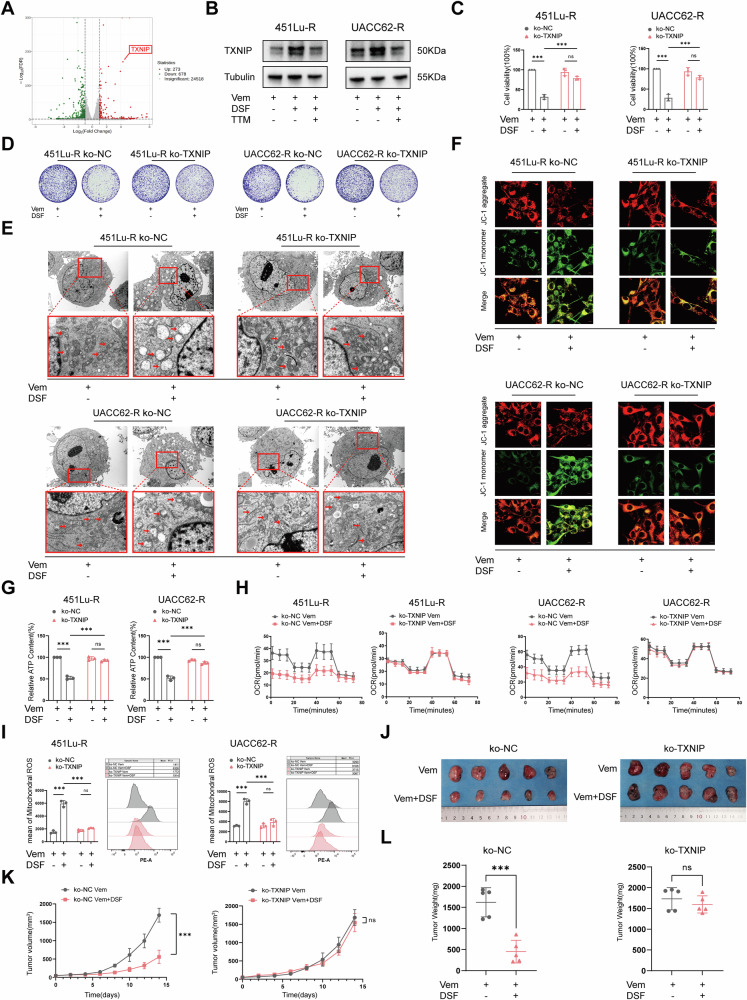
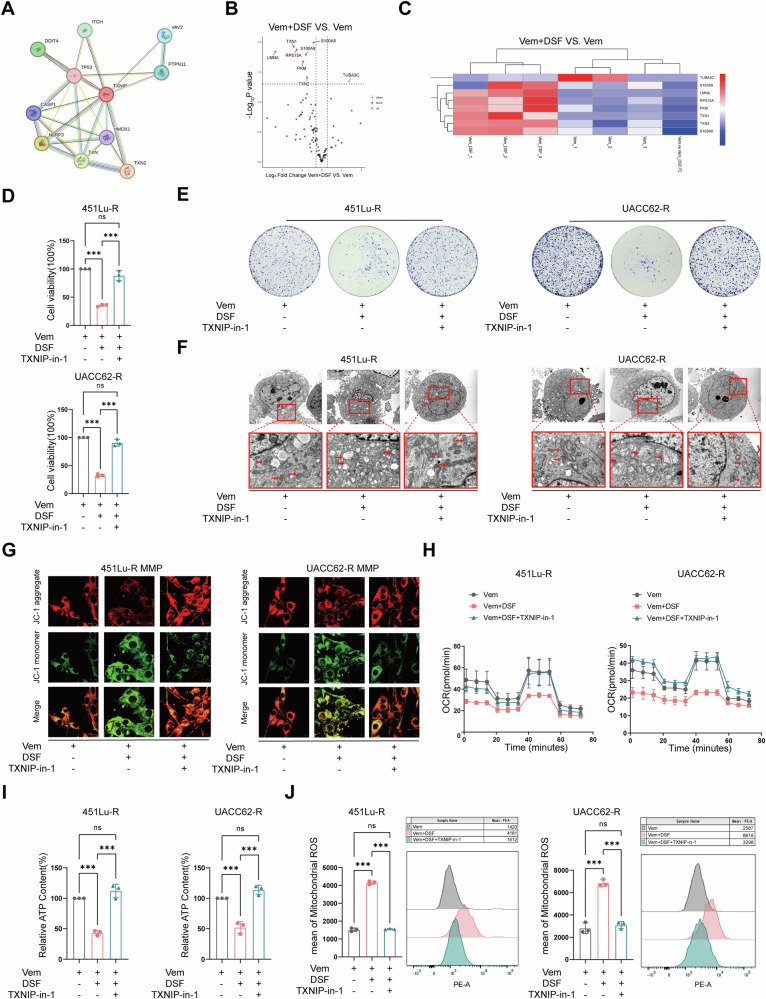
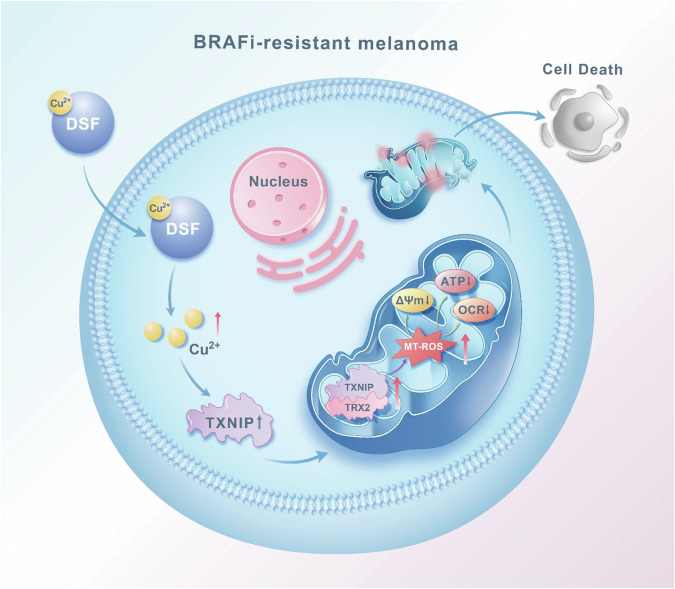
Resistance to targeted therapies poses a significant challenge in advanced melanoma with BRAF mutations. Even with a BRAF + MEK inhibitor combination, about 70% of patients experience disease progression within two years, highlighting the need for novel strategies beyond MAPK signaling inhibition. This study investigates whether mitochondrial dysfunction induced by the copper ionophore disulfiram (DSF) can effectively counteract resistance to BRAF inhibitors. We established two BRAF inhibitor (BRAFi)-resistant melanoma cell lines using BRAF mutant 451Lu and UACC62. In vivo experiments were conducted using subcutaneous implantation in nude mice. Cell viability and colony formation assays assessed treatment efficacy, while mitochondrial morphology was evaluated via transmission electron microscopy. Mitochondrial respiration was measured using a Seahorse metabolic analyzer, and oxidative stress was assessed through flow cytometry and confocal microscopy. RNA sequencing identified downstream factors regulated by intracellular copper levels, and the CRISPR-Cas9 system was used to knock out candidate genes in BRAFi-resistant cells for mechanistic validation. We provided evidence that DSF induced cell death in BRAFi-resistant melanoma in a copper-dependent manner, severely impairing mitochondrial structure and function through increased oxidative stress. RNA-seq and immunoblotting revealed that thioredoxin-interacting protein (TXNIP) expression significantly increased in response to DSF. TXNIP knockout reduced DSF-induced cytotoxicity by mitigating oxidative stress. These findings were supported by in vivo experiments. Furthermore, we demonstrated that the oxidative damage mediated by TXNIP involved its interaction with thioredoxin 2 (TRX2). In conclusion, targeting mitochondrial function with disulfiram effectively inhibits BRAFi-resistant melanoma cells, independent of MAPK signaling blockage. These results point to the potential of combining disulfiram with BRAF inhibitors as a promising strategy to overcome BRAFi resistance.


Conflict of interest statement

Competing interests: The authors declare no competing interests. Ethics approval: The study was approved by the Animal Protection and Utilization Committee of the animal facility at the Fourth Military Medical University. All animal experiments were conducted in accordance with the Guide for the Care and Use of Laboratory Animal by International Committees. Every effort was made to minimize the numbers and suffering of the included animals.

Figures

Fig. 1
Fig. 1. DSF inhibits BRAFi-resistant melanoma growth in a copper-dependent way.
A CCK-8 assay of cell viability of two vemurafenib-resistant cell lines treated with vemurafenib (Vem) alone, disulfiram (DSF) alone, or Vem in combination with DSF for 48 h. BD Images of tumors from mice that received Vem alone, DSF alone, or Vem in combination with DSF (B). Tumor volumes and weights in each group were measured and displayed in (C) and (D). E Viability of vemurafenib-resistant cells with and without pretreatment of 20 μM TTM exposed to Vem or Vem+DSF. F Viability of vemurafenib-resistant cells pretreated with 30 μM Z-VAD-FMK (ZVF) and 50 μM D-Boc-FMK(DBF), followed by treatment with Vem or DSF+Vem. G Viability of vemurafenib-resistant cells pretreated with 20 μM Necrostatin-1 (NEC-1), followed by treatment with Vem or DSF+Vem. H Viability of vemurafenib-resistant cells pretreated with 10 μM ferrostatin-1 (FER-1), followed by treatment with Vem or DSF+Vem. I Viability of vemurafenib-resistant cells pretreated with 5 μM chloroquine (CQ), followed by treatment with Vem or DSF+Vem. JL Images of tumors from mice that received the indicated treatment (J). Tumor volumes and weights in each group were measured and displayed in (K) and (L). The symbol of one dot indicates one tumor sample, and the error bars are the mean ± SD. The differences were analyzed using one-way ANOVA. *P < 0.05, **P < 0.01, and ***P < 0.001. ns non-significant, ZVF Z-VAD-FMK, BDF Boc-D-FMK, NEC-1 Necrostatin-1, FER-1 Ferrostatin-1, CQ chloroquine.
Fig. 2
Fig. 2. DSF reverses the resistance to BRAFi by inducing mitochondrial dysfunction.
A RNA sequencing (RNA-seq) analysis of gene enrichment pathways comparing cells treated with Vem+DSF to cells treated with Vem. B Transmission electron microscopy (TEM) of mitochondrial morphology in cells treated with Vem or Vem+DSF for 48 h. C Immunofluorescence staining of mitochondrial membrane potential (MMP) in vemurafenib-resistant cells treated with Vem or Vem+DSF. D Detection of ATP levels in vemurafenib-resistant cells treated with Vem or Vem+DSF. E, F Seahorse assay to analyze mitochondrial oxidative phosphorylation (E) and glycolysis in vemurafenib-resistant cells Vem or Vem+DSF (F). Data are represented as mean ± SD of triplicate. P-value was calculated by two-­tailed Student’s t-­test. *P < 0.05, **P < 0.01, and ***P < 0.001. ns non-significant.
Fig. 3
Fig. 3. Mitochondrial dysfunction caused by DSF depends on exacerbated oxidative stress.
A Flow cytometry staining was used to analyze mitochondrial reactive oxygen species (mt-ROS) levels. B Immunofluorescence staining was conducted to assess the mt-ROS level. C CCK-8 assay of cell viability of -resistant cells treated with Vem or DSF+Vem with or without Mito-TEMPO pretreatment. D Colony forming assay was used to describe the growth of cells pretreated with or without Mito-TEMPO, followed by Vem or DSF+Vem exposure. E TEM analyzed the mitochondrial morphology changes in vemurafenib-resistant cells pretreated with or without Mito-TEMPO, followed by Vem or DSF+Vem exposure. F Immunofluorescence staining of MMP levels. G Seahorse assay was used to assess the mitochondrial oxidative phosphorylation. H ATP levels of vemurafenib-resistant cells pretreated with or without Mito-TEMPO, followed by Vem or DSF+Vem exposure. Data represent the mean ± SD of triplicate. The differences were analyzed using one-way ANOVA. *P < 0.05, **P < 0.01, and ***P < 0.001. ns non-significant.
Fig. 4
Fig. 4. Depletion of copper rescues the DSF-induced mitochondrial dysfunction by reversing the oxidative damage.
A Flow cytometry analysis of mt-ROS levels of vemurafenib-resistant cells pretreated with or without 20 μM TTM, followed by Vem or DSF+Vem exposure. B Immunofluorescence staining of mt-ROS levels. C TEM photography of the mitochondrial morphology of vemurafenib-resistant cells pretreated with or without 20 μM TTM, followed by Vem or DSF+Vem exposure. D Immunofluorescence staining of MMP levels. E Seahorse assay of vemurafenib-resistant cells pretreated with or without 20 μM TTM, followed by Vem or DSF+Vem exposure. F ATP level evaluation of cells pretreated with or without 20 μM TTM, followed by Vem or DSF+Vem exposure. G Colony formation assay vemurafenib-resistant cells were exposed to the indicated treatments. Data represent the mean ± SD of triplicate. The differences were analyzed using one-way ANOVA. *P < 0.05, **P < 0.01, and ***P < 0.001. ns non-significant.
Fig. 5
Fig. 5. TXNIP is responsible for DSF-induced mitochondrial dysfunction.
A Significantly changed genes by RNA-seq comparing vemurafenib-resistant cells treated with Vem+DSF to cells treated with Vem. B WB of TXNIP expression in vemurafenib-resistant cells exposed to Vem or Vem+DSF. C CCK-8 assay of vemurafenib-resistant cells with TXNIP knockout exposed to Vem+DSF or Vem. D Colony formation of vemurafenib-resistant cells with TXNIP knockout exposed to Vem+DSF or Vem. E TEM observation of vemurafenib-resistant cells with TXNIP knockout exposed to Vem+DSF or Vem. F Immunofluorescence staining of MMP levels in vemurafenib-resistant cells with TXNIP knockout exposed to Vem+DSF or Vem. G ATP content in vemurafenib-resistant cells with TXNIP knockout exposed to Vem+DSF or Vem. H Seahorse assay of vemurafenib-resistant cells with TXNIP knockout exposed to Vem+DSF or Vem. I Flow cytometry assay of mt-ROS levels in vemurafenib-resistant cells with TXNIP knockout exposed to Vem+DSF or Vem. JL Tumors removed from nude mice bearing 451Lu-R ko-NC cells or 451Lu-R ko-TXNIP after 14 days of treatment with Vem+DSF or Vem (J). Tumor volumes and weights in each group were calculated and displayed in (K) and (L). Symbols of one dot indicate one mouse, and the error bars are mean ± SD. The differences were analyzed using Student’s t-test and one-way ANOVA. *P < 0.05, **P < 0.01, and ***P < 0.001. ns non-significant, ko-NC knockout negative control, ko-TXNIP knockout of TXNIP.
Fig. 6
Fig. 6. TXNIP provokes mitochondrial oxidative stress in vemurafenib-resistant cells via the interaction with TRX2.
A Interactome of TXNIP by the STRING database. B The volcano plot of proteins interacting with TXNIP by Data-Independent Acquisition (DIA) quantitative proteomics. C The heatmap of the proteins interacting with TXNIP by Data-Independent Acquisition (DIA) quantitative proteomics. D CCK-8 assay of TXNIP-in-1 pretreated vemurafenib-resistant cells exposed to Vem or Vem+DSF. E Colony formation of TXNIP-in-1 pretreated vemurafenib-resistant cells exposed to Vem or Vem+DSF. F TEM observation of TXNIP-in-1 pretreated vemurafenib-resistant cells exposed to Vem or Vem+DSF. G Immunofluorescence to determine MMP of TXNIP-in-1 pretreated vemurafenib-resistant cells exposed to Vem or Vem+DSF. H Seahorse assay of TXNIP-in-1 pretreated vemurafenib-resistant cells exposed to Vem or Vem+DSF. I ATP levels of TXNIP-in-1 pretreated vemurafenib-resistant cells exposed to Vem or Vem+DSF. J Flow cytometry to detect mt-ROS of TXNIP-in-1 pretreated vemurafenib-resistant cells exposed to Vem or Vem+DSF. Data represent the mean ± SD of triplicate. The differences were analyzed using one-way ANOVA. *P < 0.05, **P < 0.01, and ***P < 0.001. ns non-significant.
Fig. 7
Fig. 7. A schematic illustration depicting the mechanism by which disulfiram(DSF) exerts its inhibitory effect on BRAFi-resistant cells by inducing mitochondrial dysfunction.
DSF disulfiram, TXNIP thioredoxin-interacting protein, TRX2 thioredoxin 2, MT-ROS mitochondrial reactive oxygen species, OCR, oxygen consumption rate, ΔΨm mitochondrial membrane potential, BRAFi BRAF inhibitors.

Similar articles

References

    1. Davies H, Bignell GR, Cox C, Stephens P, Edkins S, Clegg S, et al. Mutations of the BRAF gene in human cancer. Nature. 2002;417:949–54. - PubMed
    1. Larkin J, Lao CD, Urba WJ, Mcdermott DF, Horak C, Jiang J, et al. Efficacy and safety of nivolumab in patients with BRAF V600 mutant and BRAF wild-type advanced melanoma: a pooled analysis of 4 clinical trials. JAMA Oncol. 2015;1:433–40. - PubMed
    1. Chapman PB, Hauschild A, Robert C, Haanen JB, Ascierto P, Larkin J, et al. Improved survival with vemurafenib in melanoma with BRAF V600E mutation. N Engl J Med. 2011;364:2507–16. - PMC - PubMed
    1. Hauschild A, Ascierto PA, Schadendorf D, Grob JJ, Ribas A, Kiecker F, et al. Long-term outcomes in patients with BRAF V600-mutant metastatic melanoma receiving dabrafenib monotherapy: analysis from phase 2 and 3 clinical trials. Eur J Cancer. 2020;125:114–20. - PMC - PubMed
    1. Ascierto PA, Dreno B, Larkin J, Ribas A, Liszkay G, Maio M, et al. 5-Year outcomes with cobimetinib plus vemurafenib in BRAFV600 mutation-positive advanced melanoma: extended follow-up of the coBRIM study. Clin Cancer Res. 2021;27:5225–35. - PMC - PubMed

MeSH terms