. 2025 Jul 1;16(1):5948.
doi: 10.1038/s41467-025-60903-1.

Integrated dopamine sensing and 40 Hz hippocampal stimulation improves cognitive performance in Alzheimer's mouse models

Affiliations

Integrated dopamine sensing and 40 Hz hippocampal stimulation improves cognitive performance in Alzheimer's mouse models

Shiya Lv et al. Nat Commun. .

Abstract

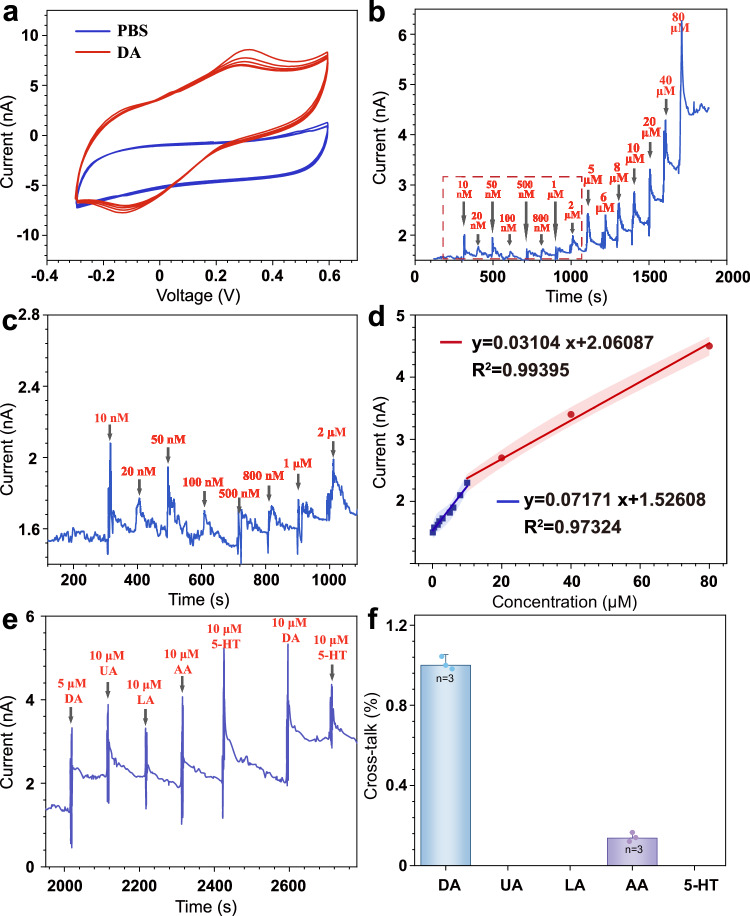
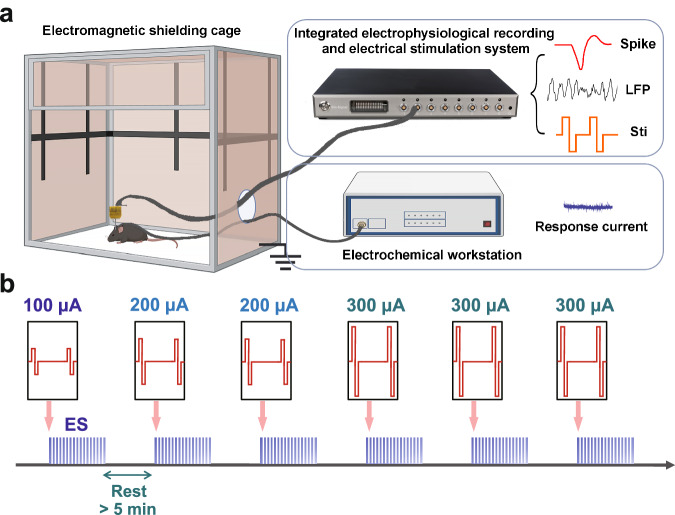
Hippocampal degeneration and reduced dopamine levels in Alzheimer's disease are associated with severe memory and cognitive impairments. However, the lack of multifunctional in situ neural chips has posed challenges for integrated investigations of Alzheimer's disease pathophysiology, dopamine dynamics, and neural activity. Therefore, we developed NeuroRevive-FlexChip, a flexible neural interface capable of precise electrical modulation and simultaneous in situ monitoring of dopamine levels and neural activity. In this study, the NeuroRevive-FlexChip demonstrates improved electrochemical detection sensitivity and modulation efficiency. Preliminary observations in APP/PS1 mice indicate that implantation of the chip in the hippocampal CA1 region, combined with 40 Hz stimulation, may contribute to the restoration of dopamine release, a reduction in neuronal hyper-synchronization, and a shift toward more stable firing patterns. These effects appear to be modulated by dopamine-related mechanisms. Furthemore, 40 Hz stimulation was observed to correlate with reduction in Aβ42 deposition and modest improvements in spatial cognition performance, as assessed by the Y-maze test. These findings highlight the potential of NeuroRevive-FlexChip as a research tool for investigating the mechanisms of 40 Hz stimulation in Alzheimer's disease models. Further studies could explore its utility in clarifying the relationship between dopamine dysfunction, neural activity, and amyloid pathology. While these early results are promising, additional preclinical and translational research will be necessary to assess the therapeutic potential of this approach for neurodegenerative diseases.


Conflict of interest statement

Competing interests: S.L., X.C., Y.S., F.M., L.J., W.X. are involved in the patent ‘Flexible Neural Electrode with Multilayer Bidirectional Signal Transmission Structure and Its Fabrication Method’. The other authors declare no competing interests. Ethics: All animal care and procedures adhered to the guidelines set by the Institutional Animal Care and Use Committee at the Aerospace Information Research Institute, Chinese Academy of Science (AIRCAS), and were approved by the Beijing Laboratory Animal Care Association and the AIRCAS Animal Care and Use Committee under approval number AIRCAS-202103-1.

Figures

Fig. 1
Fig. 1. The neurorevive-FlexChip.
a Completed Packaging of NeuroRevive-FlexChip (scale bars: 1 mm). b Full View of NeuroRevive-FlexChip (scale bars: 1 mm), and detailed image of the tip of the mfMEA in the black circle (scale bars: 100 μm). c The NeuroRevive-FlexChip fabrication process: i Deposition of a 6 μm parylene layer onto a cleaned silicon wafer; ii Spin-coating of photoresist AZ5214 onto the parylene layer; iii Photolithographic definition of patterns for the deep conductive layer; iv–v Sputtering and lift-off of the deep Cr/Au (30/200 nm) conductive layer; vi Deposition of a 2 μm parylene layer; vii Photolithographic definition of patterns for the shallow conductive layer; viii Sputtering and lift-off of the shallow Cr/Au (30/200 nm) conductive layer; ix Deposition of another 2 μm parylene layer; x Spin-coating of photoresist AZ4620 onto the parylene layer; xi–xii Exposure of microelectrodes and pads through photolithography and etching; xiii Spin-coating of photoresist AZ4903 onto the parylene layer; xiv–xv Patterning of the NeuroRevive-FlexChip contours through photolithography and etching. d Surface Potential Simulation from Electrical Stimulation (ES) (scale bars: 1 mm). e The electrochemical response under in vitro stimulation.
Fig. 2
Fig. 2. The electrical performance of the neurorevive-FlexChip.
a–c Impedance and phase of NeuroRevive-FlexChip with the following conditions: bare surface, surface modified with PtNPs, PtNPs/PPy/MWCNTs, PtNPs/PEDOT:PSS/MWCNTs, and PtNPs/PEDOT:PSS/PPy/MWCNTs (n = 3 independent detection sites per group; data are presented as mean ± s.d.; P values: Bare vs. PtNPs, P = 0.0001; PtNPs vs. PtNPs/PPy/MWCNTs, P = 0.1792; PtNPs vs PtNPs/PEDOT:PSS/MWCNTs, P = 0.0008; PtNPs vs PtNPs/PEDOT:PSS/MWCNTs/PPy P = 0.0009; PtNPs/PEDOT:PSS/MWCNTs vs. PtNPs/PEDOT:PSS/MWCNTs/PPy, P = 0.332). d–f SEM image of NeuroRevive-FlexChip with the following conditions: surface modified with PtNPs/PPy/MWCNTs, PtNPs/PEDOT:PSS/MWCNTs, and PtNPs/PEDOT:PSS/PPy/MWCNTs. g–i The CV curves of modified micro-electrodes of NeuroRevive-FlexChip. g PtNPs/PPy/MWCNTs, h PtNPs/PEDOT:PSS/MWCNTs, and i PtNPs/PEDOT:PSS/PPy/MWCNTs. j The CV scanning (0.2–0.6 V) in a 200 μM DA solution of the NeuroRevive-FlexChip. k The double layer capacitance (Cdl) of the PtNPs/PPy/MWCNTs, PtNPs/PEDOT:PSS/MWCNTs and PtNPs/PEDOT:PSS/PPy/MWCNTs modified micro-electrodes of NeuroRevive-FlexChip (n = 3 independent detection sites per group, data are presented as mean ± s.d.). l The charge storage capacity of the PtNPs/PPy/MWCNTs, PtNPs/PEDOT:PSS/MWCNTs and PtNPs/PEDOT:PSS/PPy/MWCNTs modified micro-electrodes of NeuroRevive-FlexChip (n = 3 independent detection sites per group; data are presented as mean ± s.d.; P values: PtNPs/PPy/MWCNTs vs PtNPs/PEDOT:PSS/MWCNTs, P = 0.0048; PtNPs/PEDOT:PSS/MWCNTs vs PtNPs/PEDOT:PSS/PPy/MWCNTs, P = 0.0344; PtNPs/PPy/MWCNTs vs PtNPs/PEDOT:PSS/PPy/MWCNTs, P = 0.0039). Statistical significance was assessed by unpaired two-tailed Student’s t-tests. ns, not significant (p ≥ 0.05); *p < 0.05, **p < 0.01, ***p < 0.001, ****p < 0.0001.
Fig. 3
Fig. 3. The dopamine (DA) detection performance of the NeuroRevive-FlexChip.
a Cyclic voltammograms of the NeuroRevive-FlexChip working micro-electrode in PBS and 200 μM DA solution (−0.3 ~ 0.6 V, 100 mV/s). b Calibration curve of the DA detection micro-electrode (10 nM~80 μM) (The red dashed box indicates the DA detection range of 10 nM~2 μM, which is magnified in Fig. 3c.). c Local calibration curve of the DA detection microelectrode (10 nM~2 μM). d Current response fitting curves at different DA concentrations (0 ~ 10 μM: y = 0.07171x + 1.52608, R² = 0.973; 10 ~ 80 μM: y = 0.03104x + 2.06087, R² = 0.994) (n = 3 independent detection sites per group; data are presented as mean ± s.d.). e Current response curves under the interference of UA, LA, AA, 5-HT. f Comparative current responses under interference (n = 3 independent detection sites per group; data are presented as mean ± s.d.). Statistical significance was assessed by unpaired two-tailed Student’s t-tests. ns, not significant (p ≥ 0.05); *p < 0.05, **p < 0.01, ***p < 0.001, ****p < 0.0001.
Fig. 4
Fig. 4. Electrical stimulation (ES) is rebooting DA and quelling hyper-synchronization firings.
a Changes in DA concentration after each ES in AD mice (once at 100 μA; twice at 200 μA; thrice at 300 μA). b DA concentration in AD mice from the initial valley (the first concentration nadir observed after stimulation cessation) after ES to the repetitive valley after DA reboot (the nadir of DA concentration following spontaneous reboot and decline in the absence of electrical stimulation). c Spike firing rate in wild-type mice and AD mice pre and post each ES (n  =  20 independent micro-electrode site; data are presented as mean ± s.d.; P values: wild-type vs. Pre-ES, P < 0.0001; Pre-ES vs. 100 µA, P < 0.0001; Pre-ES vs. 200 µA1, P < 0.0001; Pre-ES vs. 200 µA2, P < 0.0001; Pre-ES vs. 300 µA1, P < 0.0001; Pre-ES vs. 300 µA2, P < 0.0001; Pre-ES vs. 300 µA3, P < 0.0001; 100 µA vs. 200 µA1, P = 0.0004; 100 µA vs. 200 µA2, P < 0.0001; 200 µA2 vs. 300 µA1, P < 0.0001; 300 µA1 vs. 300 µA2, P = 0.4424; 300 µA2 vs. 300 µA3, P = 0.0671;). d Mean action potential in AD mice pre and post each ES. e Average and normalized amplitude changes in AD mice pre and post each ES (n = 4 per group; data are presented as mean ± s.d.; P values: Pre-ES vs. 100 µA, P = 0.4352; Pre-ES vs. 200 µA1, P = 0.5646; Pre-ES vs. 200 µA2, P = 0.4913; Pre-ES vs. 300 µA1, P = 0.9491; Pre-ES vs. 300 µA2, P = 0.9508; Pre-ES vs. 300 µA3, P = 0.7707). Statistical significance was assessed by unpaired two-tailed Student’s t-tests. ns, not significant (p ≥ 0.05); *p < 0.05, **p < 0.01, ***p < 0.001, ****p < 0.0001.
Fig. 5
Fig. 5. Post-ES: profound interplay of DA fluctuations and spike activity.
a DA concentration, spike, LFP, and instantaneous spike firing rate in wild-type mice and AD mice pre- and post-ES. b Inter-spike interval (ISI) during the recording period after ES. c ISI corresponding to DA rise. d ISI corresponding to DA drop.
Fig. 6
Fig. 6. Behavioral, neuro-molecular, and cellular changes in APP/PS1 mice pre- and post-Electrical-Stimulation (ES).
a Y-maze test paradigm. b P ercentage of correct spontaneous alternation behavior in wild-type and APP/PS1 mice pre- and post-ES (n  =  13 wild-type mice and n = 13 APP/PS1 mice; data are presented as mean ± s.d.; P values: AD_Pre-ES vs. AD_Post-ES, P = 0.0133; AD_Pre-ES vs. wild-type, P = 0.0025; AD_Post-ES vs. wild-type, P = 0.8161). c Percentage of decision time spent at the center of the maze in wild-type and APP/PS1 mice pre- and post- ES (n  =  13 wild-type mice and n = 13 APP/PS1 mice; data are presented as mean ± s.d.; P values: AD_Pre-ES vs. AD_Post-ES, P = 0.4568; AD_Pre-ES vs. wild-type, P = 0.0231; AD_Post-ES vs. wild-type, P = 0.1675). d42, and nuclear immunohistochemistry staining in the hippocampus of wild-type and APP/PS1 mice pre- and post-stimulation (Aβ42: brown, Hematoxylin: blue). e Microglia, Aβ42, and nuclear immunofluorescence staining in the hippocampus of wild-type and APP/PS1 mice pre- and post-stimulation (Iba1: green, Aβ42: red, DAPI: blue). f Immunofluorescence intensity in the hippocampus of wild-type and APP/PS1 mice pre- and post-stimulation (P values: AD_Pre-ES vs. AD_Post-ES, P = 0.0225; AD_Pre-ES vs. wild-type, P = 0.0054; AD_Post-ES vs. wild-type, P < 0.0001). g42 plaque count in the hippocampus of wild-type and APP/PS1 mice pre- and post-stimulation (P values: AD_Pre-ES vs. AD_Post-ES, P = 0.0463; AD_Pre-ES vs. wild-type, P = 0.0006; AD_Post-ES vs. wild-type, P = 0.0002). (f, g: n  =  4 independent samples for all data; data are presented as mean ± s.d.; Box plots show the median as a center line, the interquartile range as the box, minimum to maximum values as whiskers, individual samples as dots, and group means as white squares.). h Immunofluorescence staining of microglia, Aβ42, and nuclei in the hippocampal CA1 region of wild-type and APP/PS1 mice before and after stimulation (Iba1: green, Aβ42: red, DAPI: blue), along with the astrocytic cytoskeleton. i–k Quantification of astrocyte morphology in wild-type and APP/PS1 mice before and after stimulation: i Number of branches per single cell (P values: AD_Pre-ES vs. AD_Post-ES, P < 0.0001; AD_Pre-ES vs. wild-type, P < 0.0001; AD_Post-ES vs. wild-type, P = 0.0267), j Maximum branch length per cell (P values: AD_Pre-ES vs. AD_Post-ES, P = 0.0008; AD_Pre-ES vs. wild-type, P = 0.0001; AD_Post-ES vs. wild-type, P = 0.0998), k Number of branch endpoints per single cell (P values: AD_Pre-ES vs. AD_Post-ES, P < 0.0001; AD_Pre-ES vs. wild-type, P = 0.0485; AD_Post-ES vs. wild-type, P < 0.0001), (i–k: n  =  15 independent samples for all data; data are presented as mean ± s.d.; Box plots show the median as a center line, the interquartile range as the box, minimum to maximum values as whiskers, individual samples as dots, and group means as white squares.). Statistical significance was assessed by unpaired two-tailed Student’s t-tests. ns, not significant (p ≥ 0.05); *p < 0.05, **p < 0.01, ***p < 0.001, ****p < 0.0001.
Fig. 7
Fig. 7. Experimental setup and electrical stimulation (ES) protocol design.
a Experimental setup (including a shielded cage, integrated electrophysiological recording and ES system, and electrochemical workstation). b 40 Hz discrete ES protocol (six 400 s current pulses: one pulse at 100 μA, two pulses at 200 μA, and three pulses at 300 μA, with at least 5 min of rest between stimulations). a Created in BioRender. Lv, S. (2025) https://BioRender.com/0sxum4f.

Similar articles

References

    1. O’Riordan, K. J., Hu, N.-W. & Rowan, M. J. Aß facilitates LTD at Schaffer collateral synapses preferentially in the left hippocampus. Cell Rep.22, 2053–2065 (2018). - PubMed
    1. Braak, H. & Braak, E. Neuropathological stageing of Alzheimer-related changes. Acta Neuropathol.82, 239–259 (1991). - PubMed
    1. Moreno-Jiménez, E. P. et al. Adult hippocampal neurogenesis is abundant in neurologically healthy subjects and drops sharply in patients with Alzheimer’s disease. Nat. Med25, 554–560 (2019). - PubMed
    1. Knopman, D. S. et al. Alzheimer disease. Nat. Rev. Dis. Prim.7, 33 (2021). - PMC - PubMed
    1. Hardy, J. & Allsop, D. Amyloid deposition as the central event in the aetiology of Alzheimer’s disease. Trends Pharm. Sci.12, 383–388 (1991). - PubMed

MeSH terms