. 2025 Jul 1;16(1):5429.
doi: 10.1038/s41467-025-61203-4.

Prosit-XL: enhanced cross-linked peptide identification by fragment intensity prediction to study protein interactions and structures

Affiliations

Prosit-XL: enhanced cross-linked peptide identification by fragment intensity prediction to study protein interactions and structures

Mostafa Kalhor et al. Nat Commun. .

Abstract

It has been shown that integrating peptide property predictions such as fragment intensity into the scoring process of peptide spectrum match can greatly increase the number of confidently identified peptides compared to using traditional scoring methods. Here, we introduce Prosit-XL, a robust and accurate fragment intensity predictor covering the cleavable (DSSO/DSBU) and non-cleavable cross-linkers (DSS/BS3), achieving high accuracy on various holdout sets with consistent performance on external datasets without fine-tuning. Due to the complex nature of false positives in XL-MS, an approach to data-driven rescoring was developed that benefits from Prosit-XL's predictions while limiting the overestimation of the false discovery rate (FDR). After validating this approach using two ground truth datasets consisting of synthetic peptides and proteins, we applied Prosit-XL on a proteome-scale dataset, demonstrating an up to ~3.4-fold improvement in PPI discovery compared to classic approaches. Finally, Prosit-XL was used to increase the coverage and depth of a spatially resolved interactome map of intact human cytomegalovirus virions, leading to the discovery of previously unobserved interactions between human and cytomegalovirus proteins.


Conflict of interest statement

Competing interests: M.W. is a founder and shareholder of MSAID GmbH with no operational role and member of the scientific advisory board of Momentum Biotechnologies. The remaining authors declare no competing interests.

Figures

Fig. 1
Fig. 1. Data collection and collision energy calibration for refining Prosit to Prosit-XL.
a Pie chart showing the collected training data on cross-linked spectrum match (CSM) and unique XL-peptide (peptide pair) level, covering the cleavable cross-linkers Thiol and Alkene acquired using MS3 spectra (CMS3) and DSSO and DSBU acquired using MS2 spectra (CMS2), as well as data for non-cleavable cross-linkers DSS/BS3 acquired using MS2 spectra (NMS2). b Normalized collision energy (NCE) calibration curve for an example MS-file, showing the mean spectral angle (SA) when comparing annotated experimentally acquired spectra of the top 1000 highest scoring target peptide-spectrum matches (PSMs) to spectra predicted with Prosit at varying NCEs. The NCE with the highest average SA, indicated by the vertical red line, is used as the NCE for training. c, d Bar plots showing the number of raw files after NCEs calibration across the training data. e Violin plot comparing the annotated experimental MS2-MS3 spectra of XL-peptides with the same peptide A but different peptide B for five different cross-linkers: CMS3-Thiol, CMS3-Alkene, CMS2-DSBU, NMS2-DSS/BS3, and CMS2-DSSO. The analysis is not focused on a specific peptide A; instead, peptide A refers to the first peptide in each cross-linked pair. The number of sampled spectra (n = 1700) is indicated at the bottom. The black solid line and corresponding numbers indicate the median spectral angle (SA) and Pearson correlation (PCC) for each distribution. Mean spectral angles ± standard error of the mean (SEM) for each group are as follows: Thiol(CMS3), 0.857 ± 0.003; Alkene(CMS3), 0.827 ± 0.003; DSBU(CMS2), 0.779 ± 0.005; DSS/BS3(NMS2), 0.785 ± 0.003; and DSSO(CMS2), 0.724 ± 0.004.
Fig. 2
Fig. 2. Accurate fragment ion intensity prediction of XL-peptides by Prosit-XL.
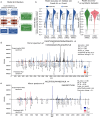
a Schematic illustration of the general architecture of Prosit-XL-CMS2 and Prosit-XL-NMS2 for fragment ion intensity prediction of XL-peptides. The input data (XL-peptide precursor charge state, normalized collision energy (NCE), peptide sequence A, and peptide sequence B) are encoded into a latent representation (latent space). These representations are then element-wise multiplied and subsequently decoded to fragment ion intensities. Prosit-XL-CMS2 contains one extra decoder compared to Prosit-XL-NMS2 covering y-long and b-long fragments. The Prosit-XL-CMS3 has the same architecture as HCD Prosit 2020, missing the Encoder 2 and Decoder 2. b Violin plot comparing the prediction accuracy of Prosit-XL models (dark blue) for CMS3, CMS2, and NMS2 compared to the prediction accuracy of the previously published HCD Prosit 2020 and CID Prosit 2020 model (light blue) on the holdout set across 5 different cross-linker types: CMS3-Alkene, CMS3-Thiol, CMS2-DSSO, CMS2-DSBU, and NMS2-DSS/BS3. The number of underlying spectra (n) is indicated at the bottom. The black solid line and corresponding numbers indicate the median spectral angle (SA) and Pearson correlation coefficient (PCC). The prediction performance was assessed separately for peptides A and B (PSM level). c Violin plot demonstrating the prediction accuracy of Prosit-XL-CMS2 and Prosit-XL-NMS2 on external unseen datasets using DSSO and DSS/BS3 as cross-linkers. The number of underlying spectra (n) is indicated at the bottom. The black solid line and corresponding numbers indicate the median spectral angle and Pearson correlation. Data are presented as mean ± SEM: DSSO (mean = 0.776, SEM = 0.002), DSS/BS3 (mean = 0.726, SEM = 0.008). d, e Mirror spectrum of two XL-peptides comparing the experimentally acquired spectrum (top spectrum) to its respective prediction by Prosit-XL for the peptide DAIATVNKQEDANFSNNAMAEAFK (peptide A) cross-linked by DSSO with VTAVDAKGATVELADGVEGYLR (peptide B) predicted by Prosit-XL-CMS2 (d) and the peptide NGLTPITSLPNYNEDYKLR (peptide A) cross-linked by DSS with EKSIPSTITVGK (peptide B) predicted by Prosit-XL-NMS2 (e). Matching peaks are visualized in dark red, red, and light red for b, b-s, and b-l and b-xl ions, respectively, and in dark blue, blue, and light blue for y, y-s, and y-l and y-xl, respectively.
Fig. 3
Fig. 3. Overview of the rescoring pipeline and its results on ground truth datasets.
a Schematic illustration of the data-driven rescoring pipeline based on Prosit-XL as implemented in Oktoberfest. First, unfiltered results from supported XL-DBSEs (xiSEARCH or Scout) and mass spectrometry (MS) files (e.g., RAW) are required as input for rescoring. Oktoberfest performs spectrum annotation, normalized collision energy (NCE) calibration, and retrieves fragment ion intensity predictions from Prosit-XL to generate an extensive set of intensity-based features for each CSM provided by the XL-DBSE search results. Percolator is run at PSM level (rather than at CSM level). The final CSM score is obtained by taking the minimum percolator discriminant score of each PSM in a CSM and is submitted to xiFDR for FDR estimation on CSM-, peptide pair-, and PPI-level. b Vennbars show the number of identified CSMs and peptide pairs lost (orange), shared (blue), and gained (green), at an FDR of 1% on CSM- and peptide pair-levels when comparing results from xiSEARCH+Prosit-XL+xiFDR to xiSEARCH+xiFDR on a synthetic peptide dataset. Percentages inside the bars represent the actual FDRs, estimated by the ground truth synthetic peptide dataset. The analysis is based on both self- and between-link comparisons. Source data are provided in Supplementary Data 2. c Vennbars show the number of identified CSMs, peptide pairs, and PPIs lost (orange), shared (blue), and gained (green) at an FDR of 1% on CSM-, peptide pair-, and PPI-level when comparing results from Scout+Prosit-XL+xiFDR to Scout+xiFDR on a synthetic protein dataset. Percentages inside the bars represent the actual FDRs. The analysis is based on between-links only. Source data are provided in Supplementary Data 3.
Fig. 4
Fig. 4. Evaluation of Prosit-XL versus large-scale datasets and extensive search space.
a Schematic illustration of the experiment designed to estimate FDR in large datasets. Briefly, two distinct large-scale datasets (E. coli and M. pneumoniae) were analyzed together by xiSEARCH with a combined protein database. Any identified XL peptide suggesting a PPI between E. coli and M. pneumoniae is considered a false positive due to this being an organism mismatch. b Vennbars show the number of identified CSMs, peptide pairs, and PPIs lost (orange), shared (blue), and gained (green) at an FDR of 1% on CSM-, peptide pair-, and PPI-level when comparing results from xiSEARCH+Prosit-XL+xiFDR (second bars) to xiSEARCH+xiFDR (first bars) on the results obtained from the experiment shown in a. Source data are provided in Supplementary Data 4. c Comparison of target-decoy separation on CSM-level using xiSEARCH scores (x-axis) and xiSEARCH+Prosit-XL+Percolator scores (y-axis). Green, blue, and orange dots represent individual target-target (TT), target-decoy (TD), and decoy-decoy (DD) CSMs, respectively. The marginal distributions show the respective score histograms. For illustration purposes, the y-axis of the marginal histograms is plotted in a log scale. The vertical and horizontal red lines indicate the 1% FDR cutoff applied at the CSM level, which yielded the results shown in b.
Fig. 5
Fig. 5. Evaluation of Prosit-XL for analyzing 3D protein structures and protein-protein interactions.
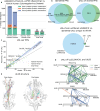
a Unique number of identified interactions; inter-protein-protein interaction (green), intra-protein-protein interaction (orange), and intra-protein-protein connection (dark blue). The bars represent the number of PPIs and self-links for human-human, human-viral, and viral-viral interactions identified by data-driven rescoring of xiSEARCH results (left) and as reported in the original study by XlinkX (right). Source data are provided in Supplementary Data 5. b Venn diagrams comparing shared PPIs and UXLs between the rescoring results and the XlinkX results. The top left Venn diagram shows the PPI-level comparison for all types of PPIs. In parentheses, the total number of UXLs detected for the corresponding PPIs is shown. Top right Venn shows the UXL-level comparison for UXLs extracted from shared PPIs only (intersection in top left Venn). The bottom Venn diagram compares the UXLs in the unfiltered search results from xiSEARCH with the UXLs that were uniquely identified by XlinkX (combination of unique PPIs and missed UXLs from shared PPIs). c Correlation between UXL counts per PPI by rescoring versus XlinkX, separated by interaction type for human-human (blue), human-viral (orange), and viral-viral (green). The diagonal and regression lines are shown in dashed black and solid blue, respectively. The shaded blue area around the regression line indicates the 95% confidence interval of the regression. Data are presented as mean ± SEM for the shared set of PPIs identified by both methods: rescoring shows a mean of 4.54 ± 0.33 UXLs per PPI, and XlinkX shows a mean of 3.52 ± 0.25 UXLs per PPI. d Network representations of the interactions among the viral proteins UL25, and UL83, as well as the human protein DDX3X, comparing results from rescoring and XlinkX. Solid green, blue, and orange lines present confidently identified UXLs by rescoring or XlinkX that were gained, shared, or lost when comparing rescoring to XlinkX, respectively. The network was visualized using xiView and modified. e Structural representations of the post-fusion (PDB: 7KDD) and the pre-fusion (PDB 7KDP) conformations of the viral proteins UL55. Lines indicate confidently identified UXLs by rescoring, highlighting the distance of the interacting sites. Colors represent individual interactions mapped onto the structure. The residue alpha carbons were depicted as gray spheres. The UXL distances shown were calculated using PyMOL.

Similar articles

References

    1. O’Reilly, F. J. & Rappsilber, J. Cross-linking mass spectrometry: methods and applications in structural, molecular and systems biology. Nat. Struct. Mol. Biol.25, 1000–1008 (2018). - PubMed
    1. Trnka, M. J., Baker, P. R., Robinson, P. J. J., Burlingame, A. L. & Chalkley, R. J. Matching cross-linked peptide spectra: only as good as the worse identification. Mol. Cell. Proteom. MCP13, 420–434 (2014). - PMC - PubMed
    1. Fischer, L. & Rappsilber, J. Quirks of error estimation in cross-linking/mass spectrometry. Anal. Chem.89, 3829–3833 (2017). - PMC - PubMed
    1. Walzthoeni, T. et al. False discovery rate estimation for cross-linked peptides identified by mass spectrometry. Nat. Methods9, 901–903 (2012). - PubMed
    1. Lenz, S. et al. Reliable identification of protein-protein interactions by crosslinking mass spectrometry. Nat. Commun.12, 3564 (2021). - PMC - PubMed

LinkOut - more resources