. 2025 Jul 1;16(1):5540.
doi: 10.1038/s41467-025-60389-x.

Klf5-adjacent super-enhancer functions as a 3D genome structure-dependent transcriptional driver to safeguard ESC identity

Affiliations

Klf5-adjacent super-enhancer functions as a 3D genome structure-dependent transcriptional driver to safeguard ESC identity

Guangsong Su et al. Nat Commun. .

Abstract

Cell-specific super-enhancers (SEs) and master transcription factors (TFs) dynamically remodel embryonic stem cell (ESC) fate, yet their regulatory interplay remains unclear. By integrating multi-omics data (H3K27ac, Hi-C, scRNA-seq) across ESC states, we identified SEs interacting with master TFs, exemplified by the Klf5-adjacent SE (K5aSE). K5aSE deletion impaired proliferation, differentiation, and Klf5 expression, partially rescued by KLF5 reintroduction. Despite phenotypic similarities between Klf5-KO and K5aSE-KO ESCs, scRNA-seq of embryoid bodies revealed distinct differentiation trajectories, suggesting K5aSE targets beyond Klf5. High-throughput 3D genome screening demonstrated K5aSE activates four distal genes via chromatin looping. CRISPRa-mediated activation of these targets rescued K5aSE-KO phenotypes and uncovered their regulatory roles. Furthermore, CTCF depletion disrupted topologically associated domains (TADs) near K5aSE, suppressing Klf5 and target gene expression, indicating CTCF-mediated TADs sustain K5aSE activity. Our study unveils a 3D genome-dependent mechanism by which SEs govern ESC identity through coordinated TF interaction and multi-gene regulation.


Conflict of interest statement

Competing interests: The authors declare no competing interests.

Figures
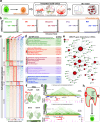
Fig. 1
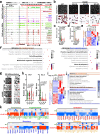
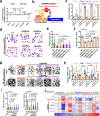
Fig. 1. Identification of a class of SEs that coordinate cell fate may be mediated by adjacent TFs.
a Workflows for multi-omics analysis in ESCs and differentiated cells to identify SE patterns, including integrated epigenomics (H3K27ac), transcriptomics (scRNA sequencing) and three-dimensional genomics (Hi-C) analysis. b Analysis of SE regions based on H3K27ac ChIP-seq data. SEs were defined by signal levels above the inflection point of the curve. All H3K27ac ChIP-seq reads were aligned to the mouse genome assembly mm10 using Bowtie2, and ChIP-seq peaks were called by MACS with default parameters. The parameter “12.5 kb” was used as the maximum distance between the two regions to be sutured, and ROSE was used to distinguish SE from TSSs. H3K27ac ChIP-seq data: ESCs (GSM6911328, generated in this study), EBs (GSM1816114), NPC (GSM1603409), Mesoderm cells (GSM1163099) and MEF (GSM2912468). Publicly available ChIP-seq data have been listed in Supplementary Table 10. c Heatmap showing cell type-specific SE distribution. H3K27ac ChIP-seq signals in a ± 5 kb window for the same SE region in different cell types. d Gene ontology-biological process (GO-BP) analysis of cell-specific PSEAGs. Genes with the closest TSS to the SE (within a 50 kb window) were defined as predicted SE-associated genes (PSEAGs). GO-BP analyses were carried out using the online tool: DAVID,. e Gene regulatory network (GRN) analysis of SE-related TFs in ESCs. The red circle represents the master transcription factor (Seed), while the green four-sided diamonds are transcription factors (TFs) that interact with the Seed. GRN analyses were carried out using the online tool: NetworkAnalyst (https://www.networkanalyst.ca/NetworkAnalyst/home.xhtml),. f UMAP embedding of single-cell RNA profiles (dots) of ESCs (green dashed line) and EBs (red dashed line). Color intensity reflects gene expression levels. g Hi-C heatmap (GSE96107), H3K27ac (GSM6911328, generated in this study) and CTCF (GSM699165) signals indicating co-localization of ESC SEs with adjacent master TFs (Klf5 and Esrrb loci). The thick red line, located at the upper part of the H3K27ac peak, delineates the SE region, whereas the thick orange line, situated at the lower part of the Hi-C heatmap, delineates the TAD region. Hi-C data are analysed and presented using online tools: 3D Genome Browser (https://3dgenome.fsm.northwestern.edu/). Publicly available ChIP-seq data have been listed in Supplementary Table 10. h Proposed SE function model: SE may regulate ESC properties by promoting the activity of adjacent TFs within the same TAD. Taking Pou5f1, Sox2, Esrrb and Klf5 loci as examples in the illustration. Source data are provided as a Source Data file.
Fig. 2
Fig. 2. K5aSE is essential for ESC proliferation and differentiation.
a IGV screenshot showing indicated ChIP-seq signals at the K5aSE locus in ESCs and differentiated cells, including epigenetic modifications (H3K27ac, H3K4me1/2/3 and H3K27me3), chromatin accessibility (ATAC), RNA transcriptional activity (POLR2A), transcriptional regulator (BRD4) and transcription factors (OCT4, SOX2, NANOG, ESRRB, PRDM14, CTNNB1, STAT3 and KLF5). Gray-shaded area, Klf5 promoter region. Red-shaded areas, OSN binding peaks. Area within the red dashed box, K5aSE knockout region. Publicly available ChIP-seq data have been listed in Supplementary Table 10. b Bright-field and AP-staining images of WT and K5aSE-KO ESCs. Scale bar: 200 μm. c Clone size of WT and K5aSE-KO ESCs, showing significantly smaller clone size in K5aSE-KO ESCs. In WT, n = 47 clones; in KO-1#, n = 32 clones; in KO-2#, n = 17 clones; in KO-3#, n = 29 clones; two-sided unpaired t-tests. The clone size is quantified using ImageJ. d Proliferation analysis based on counting of WT and K5aSE-KO ESCs over a 4-day culture period. Analysis indicates significantly lower proliferation by K5aSE-KO ESCs. Data shown as mean ± SD, n = 3 independent replicates; two-sided unpaired t tests. e Heatmap showing DEGs between WT and K5aSE-KO ESCs (genes showing at least a twofold change and p < 0.05 were considered differentially expressed). f GO analysis of DEGs described in (e), including up- and down-regulated genes. g Bright-field images of WT and K5aSE-KO EBs at 1 and 5 days of differentiation. Scale bar: 100 μm. GO analyses were carried out using the online tool: Metascape (https://metascape.org/gp/index.html#/main/step1). h The sizes of both wild-type (WT) and K5aSE knockout (K5aSE-KO) embryoid bodies (EBs) were measured on differentiation days 1 and 5. K5aSE-KO EBs are significantly smaller than WT by day 5. Day 1 (left), in WT, n = 35 EBs; in KO-1#, n = 37 EBs; in KO-2#, n = 24 EBs; in KO-3#, n = 29 EBs. Day 5 (right), in WT, n = 26 EBs; in KO-1#, n = 20 EBs; in KO-2#, n = 27 EBs; in KO-3#, n = 38 EBs; two-sided unpaired t tests. The EB size is quantified using ImageJ. i Heatmap showing DEGs in K5aSE-KO compared to WT EBs at day 5 (genes showing at least a twofold change and p < 0.05 were considered differentially expressed). j GO analysis of DEGs between in K5aSE-KO relative to WT EBs on day 5, including up- and down-regulated DEGs. GO analyses were carried out using the online tool: Metascape (https://metascape.org/gp/index.html#/main/step1). k Heatmap illustrating the expression levels of pluripotent and lineage genes in WT and K5aSE-KO EBs on day 5 (RNA-seq, n = 3 independent replicates). The expression levels of pluripotent and lineage genes in the WT EBs were normalized to 1. Source data are provided as a Source Data file.
Fig. 3
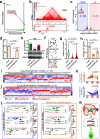
Fig. 3. KLF5 overexpression partially rescues K5aSE-KO phenotypes in ESCs.
a Showing rankings for K5aSE in ESC super-enhancers. b Hi-C (GSE96107) and H3K27ac ChIP-seq data (generated in this study) indicating that both K5aSE and Klf5 are located within the same TAD in ESCs. Red dashed box marking K5aSE region. Hi-C data are analyzed and presented using online tools: 3D Genome Browser (https://3dgenome.fsm.northwestern.edu/). c Volcano plot based on RNA-seq revealing Klf5 to be the most significant DEGs in K5aSE-KO relative to WT ESCs. Genes showing at least a twofold change and p < 0.05 were considered differentially expressed. The data showed down-regulated expression of 388 genes and up-regulated expression of 255 genes in K5aSE-KO ESCs, respectively. d RT-qPCR analysis showing relative expression of Klf5 mRNA in V-WT, V-K5aSE-KO and KLF5-K5aSE-KO ESCs. Data shown as mean ± SD, n = 3 independent replicates; two-sided unpaired t tests. e Western blot showing KLF5 protein expression in indicated ESCs (V-WT, V-K5aSE-KO and KLF5-K5aSE-KO, n = 1). KLF5 expression was normalized according to GADPH expression using ImageJ. f AP-staining of indicated ESCs (V-WT, V-K5aSE-KO and KLF5-K5aSE-KO). Scale bar: 200 μm. g Analysis of clone size in indicated ESCs (V-WT, V-K5aSE-KO and KLF5-K5aSE-KO). In V-WT, n = 34 clones; in V-K5aSE-KO, n = 96 clones; in KLF5-K5aSE-KO, n = 204 clones; two-sided unpaired t tests. The clone size is quantified using ImageJ. h Partial rescue of K5aSE-KO ESC proliferation by KLF5 overexpression. Data shown as mean ± SD, n = 3 independent replicates; two-sided unpaired t-tests. i Heatmap showing DEGs in V-K5aSE-KO compared to V-WT ESCs (FC ≥ 2, p < 0.05). j Heatmap showing rescue of DEGs shown in (i) by KLF5 overexpression (KLF5-K5aSE-KO compared to V-K5aSE-KO, FC ≥ 1, p < 0.10). k Statistical analysis of genes significantly regulated by KLF5 but aberrantly expressed in K5aSE-KO ESCs. Rescued Up-regulated genes, n = 160 genes; rescued Down-regulated genes, n = 165 genes; two-sided paired t tests. l IGV screenshots show KLF5 (GSM1208218) and H3K4me3 (GSM1871952) binding at loci of indicated genes (examples include Wnt3a, Klf10, Nek2, Sp5, Fgfbp1 and Uqcrc1) rescued by KLF5. Black arrows, direction of transcription. The relative RNA expression levels of these genes were obtained from RNA sequencing (n = 2 independent replicates). m, The schematic shows that K5aSE may regulate ESCs identity through the transcriptional regulatory network of its adjacent transcription factor KLF5. Source data are provided as a Source Data file.
Fig. 4
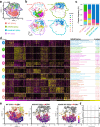
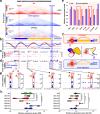
Fig. 4. scRNA-seq reveals regulation of ESC differentiation by K5aSE or Klf5 deletion.
a UMAPs of scRNA expression profiles (dots) in WT ESCs and EBs (including WT, Klf5-KO and K5aSE-KO EBs). A total of 9809 cells were enrolled in the single-cell analysis. b UMAP embeddings plots of scRNA expression profiles for different cell subsets (n = 9 clusters). Number of single cells enrolled in the analysis: WT ESCs, n = 4207 cells; WT EBs, n = 2967 cells; Klf5-KO EBs, n = 1558 cells; K5aSE-KO EBs, n = 1077 cells. c Proportion of cell subsets (using color legend shown in b) in indicated cell groups (WT ESCs, WT EBs, Klf5-KO EBs, K5aSE-KO EBs). d GO analysis of genes specifically expressed (Top100) in indicated cell subsets (n = 9 clusters). GO analyses were carried out using the online tool: DAVID,. e Monocle pseudotime analyses indicating cell state transitions from ESC-independent to EB states (Including WT ESCs, WT EBs, Klf5-KO EBs, K5aSE-KO EBs). Each cell is colored with pseudotime, a measure of changes occurring in each cell as differentiation proceeds; change trajectory is marked with a solid line on the UMAP. f Cell density plot of ESCs towards EB differentiation process along the pseudotime, including WT ESCs, WT EBs, Klf5-KO EBs and K5aSE-KO EBs.
Fig. 5
Fig. 5. K5aSE drives expression of multiple genes on the same chromosome via 3D chromatin interactions.
a Schematic illustrating that K5aSE may have target genes in addition to Klf5. b IGV screenshot showing indicated ChIP-seq signals at the K5aSE locus. Multi-colored downward-pointing arrows mark the different 4 C bait regions. Publicly available ChIP-seq data have been listed in Supplementary Table 10. c Circos plots showing candidate genes within the genome interacting with K5aSE. d GO analysis of candidate genes identified in (b). GO analyses were carried out using the online tool: DAVID,. e Heatmap showing expression of candidate genes (Identified in d) in WT and K5aSE-KO ESCs (RNA-seq, n = 3 independent replicates). Expressions of genes interacting with K5aSE were significantly lower in K5aSE-KO relative to WT ESCs; two-sided paired t tests. f The overlap of 4 C candidate genes with K5aSE-KO ESC DEGs confirmed five credible K5aSE target genes on chromosome 14, i.e., Klf5, Clybl, Farp1, Nkx3-1, and Tbc1d4; p-values referenced to RNA-seq data. g RT-qPCR showing the expression levels of K5aSE candidate target genes in WT and K5aSE-KO ESCs. Data shown as mean ± SD; in WT, n = 3 independent replicates; in K5aSE-KO, n = 9 independent replicates; two-sided unpaired t tests. Source data are provided as a Source Data file.
Fig. 6
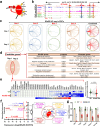
Fig. 6. Clybl, Farp1, Nkx3-1 or Tbc1d4 overexpression partially rescues K5aSE-KO phenotypes in ESCs.
a RT-qPCR showing mRNA expression levels of indicated genes (Clybl, Farp1, Nkx3-1, Tbc1d4 and Klf5) in ESCs and day 5 EBs. Two-sided unpaired t tests, n = 3 independent replicates. b Schematic diagram of the CRISPRa system used to activate target gene expression (Clybl, Farp1, Nkx3-1 and Tbc1d4). c Transcript levels of candidate K5aSE targets (Clybl, Farp1, Nkx3-1 and Tbc1d4) shown at top, as analyzed in WT ESCs, K5aSE-KO ESCs, or K5aSE-KO ESCs overexpressing the indicated target. Analysis indicates that CRISPRa restored respective target gene expression. Data shown as mean ± SD, n = 3 independent replicates; two-sided unpaired t tests. d AP-staining of indicated ESCs, including WT, K5aSE-KO, K5aSE-KO-CRISPRa-Clybl, K5aSE-KO-CRISPRa-Frap1, K5aSE-KO-CRISPRa-Nkx3-1 and K5aSE-KO-CRISPRa-Tbc1d4. Scale bar: 200 μm. e Clone size of indicated ESCs, including WT, K5aSE-KO, K5aSE-KO-CRISPRa-Clybl, K5aSE-KO-CRISPRa-Frap1, K5aSE-KO-CRISPRa-Nkx3-1 and K5aSE-KO-CRISPRa-Tbc1d4. Clone size of WT ESCs was normalized to 1. In WT, n = 71 clones; in K5aSE-KO, n = 65 clones; in K5aSE-KO-CRISPRa-Clybl, n = 57 clones; in K5aSE-KO-CRISPRa-Frap1, n = 82 clones; in K5aSE-KO-CRISPRa-Nkx3-1, n = 58 clones; in K5aSE-KO-CRISPRa-Tbc1d4, n = 83 clones; two-sided unpaired t-tests. The clone size is quantified using ImageJ. f Proliferation analysis based on counting of WT, K5aSE-KO and K5aSE-KO targets overexpressing (K5aSE-KO-CRISPRa-Clybl, K5aSE-KO-CRISPRa-Frap1, K5aSE-KO-CRISPRa-Nkx3-1 and K5aSE-KO-CRISPRa-Tbc1d4) ESCs over a 4-day culture period. The number of cells in the WT ESCs was normalized to 1. Data shown as mean ± SD, n = 4 independent replicates; two-sided unpaired t tests. g Bright-field images of indicated day 1 and day 5 EBs, including WT, K5aSE-KO, K5aSE-KO-CRISPRa-Clybl, K5aSE-KO-CRISPRa-Frap1, K5aSE-KO-CRISPRa-Nkx3-1 and K5aSE-KO-CRISPRa-Tbc1d4. Scale bar: 100 μm. h RT-qPCR analysis indicating rescue efficiency of Clybl, Farp1, Nkx3-1 and Tbc1d4 CRISPRa constructs in day 5 EBs. Data shown as mean ± SD, n = 6 independent replicates; two-sided unpaired t test. i Comparison of size of indicated EBs on days 1 (left) and 5 (right), including WT, K5aSE-KO, K5aSE-KO-CRISPRa-Clybl, K5aSE-KO-CRISPRa-Frap1, K5aSE-KO-CRISPRa-Nkx3-1 and K5aSE-KO-CRISPRa-Tbc1d4. Sizes of WT EBs were normalized to 1. EBs on days 1 (left), in WT, n = 39 clones; in K5aSE-KO, n = 69 clones; in K5aSE-KO-CRISPRa-Clybl, n = 27 clones; in K5aSE-KO-CRISPRa-Frap1, n = 49 clones; in K5aSE-KO-CRISPRa-Nkx3-1, n = 62 clones; in K5aSE-KO-CRISPRa-Tbc1d4, n = 84 clones. EBs on days 5 (right), in WT, n = 46 clones; in K5aSE-KO, n = 52 clones; in K5aSE-KO-CRISPRa-Clybl, n = 48 clones; in K5aSE-KO-CRISPRa-Frap1, n = 46 clones; in K5aSE-KO-CRISPRa-Nkx3-1, n = 49 clones; in K5aSE-KO-CRISPRa-Tbc1d4, n = 47 clones; two-sided unpaired t tests. The EB size is quantified using ImageJ. j Heatmap showing RT-qPCR analysis of pluripotency and lineage gene expression in indicated day 5 EBs. Gene expression levels in WT EBs were normalized to 1. Black asterisks, comparisons between WT and K5aSE-KO. Green asterisks, comparisons between CRISPRa groups and K5aSE-KO. Two-sided unpaired ttest, n  = 3 independent replicates, * p < 0.05, ** p < 0.01, *** p < 0.001. Source data are provided as a Source Data file.
Fig. 7
Fig. 7. Clybl, Farp1, Nkx3-1 and Tbc1d4 are ESC regulators.
a Bright-field (upper) and AP-stained (lower) images of indicated ESCs, including WT, Clybl-KO, Farp1-KO, Nkx3-1-KO and Tbc1d4-KO. Scale bar: 200 μm. b Relative clone size of indicated ESCs, including WT (n = 51 clones), Clybl-KO (n = 29), Farp1-KO (n = 44 clones), Nkx3-1-KO (n = 56 clones) and Tbc1d4-KO (n = 54 clones). Clone sizes of WT ESCs were normalized to 1. Two-sided unpaired t test. The clone size is quantified using ImageJ. c Proliferation analysis based on number of indicated ESCs. The cell numbers of WT ESCs were normalized to 1. Data shown as mean ± SD, n = 6 independent replicates; two-sided unpaired t test. d Venn diagrams showing DEGs common to indicated KO relative to WT ESCs, including commonly up- and down-regulated genes. e GO analysis of DEGs evaluated in d (including co-down-regulated and co-up-regulated genes). GO analyses were carried out using the online tool: Metascape (https://metascape.org/gp/index.html#/main/step1). f Bright-field images of indicated day 1 and day 5 EBs. Scale bar: 200 μm. g Relative size of indicated day 1 and day 5 EBs. Sizes of WT EBs were normalized to 1. EBs on days 1 (left), in WT, n = 60 clones; in Clybl-KO, n = 62 clones; in Frap1-KO, n = 89 clones; in Nkx3-1-KO, n = 54 clones; in Tbc1d4-KO, n = 104 clones. EBs on days 5 (right), in WT, n = 106 clones; in Clybl-KO, n = 212 clones; in Frap1-KO, n = 227 clones; in Nkx3-1-KO, n = 76 clones; in Tbc1d4-KO, n = 114 clones. Two-sided unpaired t tests. The EB size is quantified using ImageJ. h Venn diagrams showing common DEGs in indicated day 5 EBs, including commonly up- and down-regulated genes. i GO analysis of commonly down-regulated genes in indicated day 5 EBs. GO analyses were carried out using the online tool: Metascape (https://metascape.org/gp/index.html#/main/step1). j Expression analysis of pluripotency and lineage genes in indicated day 5 EBs. Expression levels of pluripotency and lineage genes in WT EBs were normalized to 1(as shown by the gray dashed line). Two-sided paired t test. Source data are provided as a Source Data file.
Fig. 8
Fig. 8. CTCF-mediated TAD formation maintains K5aSE regulation of target gene expression.
a Hi-C heatmap showing chromatin interactions of the K5aSE-Tbc1d4 locus in WT ESCs and in ESCs treated with auxin for 2 days to induce CTCF depletion (Hi-C data: GSE98671). Hi-C data are analyzed and presented using online tools: 3D Genome Browser (https://3dgenome.fsm.northwestern.edu/). b Insulation scores for the K5aSE-Tbc1d4 locus in CTCF-WT and CTCF-depletion ESCs were analyzed using Hi-C data (GSE98671) with a resolution of 25 kb. c ChIP-Seq data showing H3K27ac (GSM6911328, generated in this study) and CTCF (GSM699165) signals at the K5aSE-Tbc1d4 locus in ESCs. d ChIP-seq data showing CTCF binding at the K5aSE-Tbc1d4 locus in CTCF-WT (GSM2609185) and CTCF-depletion (GSM2609186) ESCs. e RNA-seq (GSE98671) showing significantly decreased Klf5 and Tbc1d4 expression in ESCs after CTCF depletion. f A proposed model of how the TAD structure maintained by CTCF allows remote regulation of Klf5 and Tbc1d4 by K5aSE. g Illustration of six selected CTCF binding sites (CBS1-6) within the TAD boundary region and the application of CRISPR/Cas9 technology to knockout these sites. h The mRNA expression levels of Klf5 and Tbc1d4 were detected using RT-qPCR in WT and CBS-KO ESCs. In WT, n = 16 independent replicates; in CBS1-KO, n = 12 independent replicates; in CBS2-KO, n = 12 independent replicates; in CBS3-KO, n = 8 independent replicates; in CBS4-KO, n = 4 independent replicates; in CBS5-KO, n = 8 independent replicates; in CBS6-KO, n = 12 independent replicates. Gene expression levels in WT ESCs were normalized to 1. Two-sided unpaired t test. Source data are provided as a Source Data file.
Fig. 9
Fig. 9. A schematic representation illustrating the function and regulatory mechanisms of K5aSE in embryonic stem cells.
a K5aSE regulates the expression of multiple target genes located on the same chromosome in WT ESCs (left panel) through three-dimensional chromatin interactions, thereby safeguarding regular proliferation and differentiation of ESCs. In contrast, in K5aSE knockout ESCs, the expression of target genes was significantly reduced (right panel), leading to decreased proliferation and impaired differentiation of ESCs. b A proposed model of how the TAD structure maintained by CTCF allows remote regulation of Klf5 and Tbc1d4 by K5aSE.

Similar articles

References

    1. Harmston, N. & Lenhard, B. Chromatin and epigenetic features of long-range gene regulation. Nucleic Acids Res.41, 7185–7199 (2013). - PMC - PubMed
    1. Razin, S. V. et al. Transcription factories in the context of the nuclear and genome organization. Nucleic Acids Res.39, 9085–9092 (2011). - PMC - PubMed
    1. Stadhouders, R., Filion, G. J. & Graf, T. Transcription factors and 3D genome conformation in cell-fate decisions. Nature569, 345–354 (2019). - PubMed
    1. Young, R. A. Control of the embryonic stem cell state. Cell144, 940–954 (2011). - PMC - PubMed
    1. Kellis, M. et al. Defining functional DNA elements in the human genome. Proc. Natl. Acad. Sci. USA111, 6131–6138 (2014). - PMC - PubMed

MeSH terms

LinkOut - more resources