. 2025 Jul 1;16(1):5967.
doi: 10.1038/s41467-025-60991-z.

Colistin enhances caspofungin antifungal efficacy against Aspergillus fumigatus by modulating calcium homeostasis and stress responses

Affiliations

Colistin enhances caspofungin antifungal efficacy against Aspergillus fumigatus by modulating calcium homeostasis and stress responses

Laura Cristina García Carnero et al. Nat Commun. .

Erratum in

Abstract

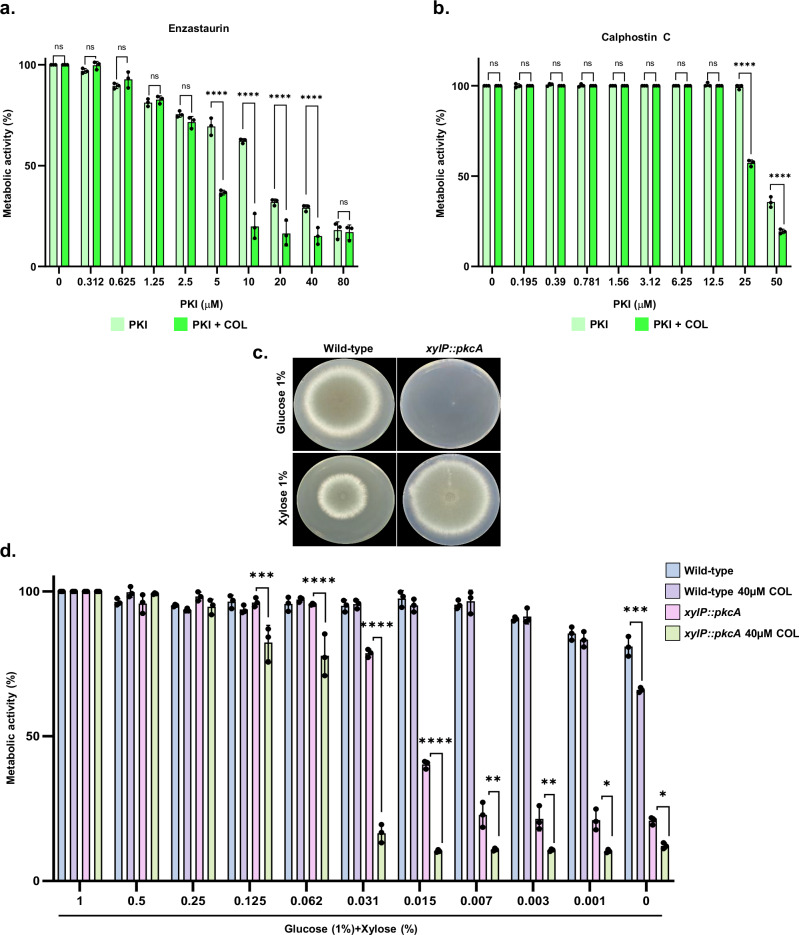
Fungal infections cause more than 2.5 million deaths a year. Due to emerging antifungal drug resistance, novel strategies are urgently needed to combat life-threatening fungal diseases. Here, by screening a collection of 5297 compounds derived from three chemical libraries, we demonstrate that the antibacterial agent colistin (COL) can potentiate the fungistatic echinocandins caspofungin (CAS) and anidulafungin, as well as the structurally distinct cell wall targeting antifungal ibrexafungerp against Aspergillus fumigatus. Chemical and genetic screenings revealed that protein kinase C and the transcription factor SltA are involved in the mechanism of action of COL. SltA is essential for coping with calcium-limiting conditions, and the addition of calcium rescues COL-susceptibility. COL + CAS decreases A. fumigatus infection in human pulmonary cells, Galleria mellonella, and Caenorhabditis elegans. In summary, we demonstrate that the mechanism of COL as a synergizer of CAS against A. fumigatus is the disruption of the cell membrane permeability and calcium homeostasis.


Conflict of interest statement

Competing interests: L.E.C. is a co-founder and shareholder in Bright Angel Therapeutics, a platform company for development of novel antifungal therapeutics. L.E.C. is a Science Advisor for Kapoose Creek, a company that harnesses the therapeutic potential of fungi. The remaining authors declare no competing interests.

Figures

Fig. 1
Fig. 1. LER and COL potentiate CAS against A. fumigatus.
a Metabolic activity (%) of A. fumigatus with the four compounds identified as potentiators of CAS activity. A. fumigatus was grown in liquid minimal medium (MM) with 10% of Alamar blue using 96-well plates at 37 °C in the presence of different concentrations of each drug combined with 0.2 μg/mL of CAS. After 48 h, the metabolic activity (%) was assessed by reading fluorescence at a wavelength of 570 nm excitation/590 nm emission. The results represent the average of two independent experiments performed in technical duplicate. b, c Structures of Lercanidipine (LER) and Colistin (COL). d, e Fungicidal activities of COL + CAS and LER + CAS against A. fumigatus. Conidia (1 × 104/mL) were incubated with 0.2 μg/mL of CAS and different concentrations of LER and COL in 96-well plates. After 48 h at 37 °C, the plates were centrifuged, the supernatants with the drugs were removed, and the cells were plated on solid MM and incubated for 48 h at 37 °C. The results represent the average of three independent experiments ± standard deviation (SD). The data was statistically analyzed by the ordinary one-way ANOVA and Dunnett´s post-test (n = 3; *p < 0.0001). Source data are provided as a Source Data file.
Fig. 2
Fig. 2. Metabolic activity assays after exposure of A. fumigatus to COL or LER in combination with CAS, ANID, IBX, and VOR.
The synergy scores for LER x CAS (a), LER x ANID (b), LER x IBX (c), LER x VOR (d), COL x CAS (e), COL x ANID (f), COL x IBX (g), and COL x VOR (h) were determined by the analysis of the checkerboard data using the SynergyFinder software. A. fumigatus was grown in liquid MM using 96-well plates at 37 °C in the presence of different concentrations of the selected drugs, and after 48 h the % of metabolic activity was assessed with Alamar blue by reading fluorescence at a wavelength of 570 nm excitation/590 nm emission. A synergy score less than −10 suggests an antagonistic interaction, from −10 to 10 suggests no interaction, and larger than 10 suggests a synergistic interaction. The results represent the average of two independent experiments (Supplementary Data 9). Source data are provided as a Source Data file.
Fig. 3
Fig. 3. COL + CAS induces cell death.
a A. fumigatus was grown for 16 h at 37 °C and exposed or not to either COL 10 µM, CAS 0.03 µg/mL, or the combination for 5, 15, and 30 min. Then, propidium iodide (PI) was added. The results show the percentage of germlings with co-localization of PI and Hoechst labeling (named as PI+) and are expressed as mean values (%) of two independent experiments with at least 50 germlings per condition (n = 100 germlings) for each experiment ± SD. The data was statistically analyzed by the Two-way ANOVA and Tukey’s multiple comparisons test (****p < 0.0001). b An A. fumigatus strain with mitochondria constitutively expressing GFP was grown for 16 h at 37 °C and exposed or not to either COL 10 µM, CAS 0.03 µg/mL, or the combination of both for 15 min. The results show the percentage of germlings with fragmented mitochondria, which are expressed as the average of two independent experiments with at least 30 germlings per condition for each experiment (n = 60). The results are expressed as mean values (%) of the two independent experiments ± SD. The data was statistically analyzed by the one-way ANOVA and Dunnett´s multiple comparisons test (*p < 0.01, **p < 0.001, and ****p < 0.0001). A representative image of non-fragmented and fragmented mitochondria is shown, scale bar = 10 μm. The white hatching in each image is amplified and shown as insets. c Fluorescence microscopy of A. fumigatus conidia containing the histone h2A::RFP exposed to H2O2 (10 mM), COL (10 or 20 μM), CAS (0.03 or 0.2 μg/mL), or different combinations of CAS + COL for one h at 30 °C. The germlings were assessed for Hoechst staining and RFP and the results are expressed as mean values (%) of the two independent experiments (50 germlings each experiment) ± SD. A representative image of the H2O2 treatment is shown, scale bar = 10 μm. d Total ATP production by A. fumigatus wild-type after growth for 24 h in MM at 37 °C and exposure to COL 40 µM, CAS 0.2 µg/mL or a combination of both compounds. The results are the average of three independent repetitions with three biological replicates each (n = 9) ± SD. The data was statistically analyzed by the Two-way ANOVA and Tukey’s multiple comparisons test (****p < 0.0001). Source data are provided as a Source Data file.
Fig. 4
Fig. 4. Protein kinase C is important for COL susceptibility.
A. fumigatus was grown in liquid MM using 96-well plates at 37 °C in the presence of different concentrations of enzastaurin (a) and calphostin C (b) with or without 20 μM of COL, and after 48 h, the metabolic activity (%) was assessed by the XTT assay. The results represent the average of three independent experiments ± SD and were statistically analyzed by the Two-way ANOVA test (n = 3; *****p < 0.0001, ns: not significant). c A. fumigatus wild-type and xylP::pkcA strains were grown for 96 h at 37 °C in MM+glucose 1% and MM+xylose 1 %. d A. fumigatus wild-type and xylP::pkcA strains were grown for 48 h at 37 °C in MM+glucose 1% and supplemented with increasing concentrations of xylose, in the absence or presence of 40 µM COL. Metabolic activity was evaluated by using Alamar blue. The results are expressed as the average of three independent experiments ± SD. (n = 3; Two-way ANOVA, Tukey´s post-test; *p < 0.05, **p < 0.005, **p < 0.001 and ****p < 0.0001). Source data are provided as a Source Data file.
Fig. 5
Fig. 5. The Cell Wall Integrity Pathway is involved in the mechanism of action of COL + CAS.
a A. fumigatus wild-type, pkcAG579R, ΔrlmA, and complemented strains (5 µL with 1×10⁴ conidia) were grown on solid medium with different treatments as indicated. The plates were incubated for 4 days at 37 °C, radial growth was measured, and the results are expressed as treatment/control ratio. Results were plotted using GraphPad Prism (GraphPad Software, Inc.) and are expressed as the average of three independent experiments ± SD. (n = 3; Two-way ANOVA, Dunnett´s post-test; ****p < 0.0001). bf. Lux activity assay (luminescence, indicating luciferase activity) measured during incubation of A. fumigatus wild-type and mutant strains with pagsA:mluc cassette exposed to different concentrations of COL and/or CAS. The results were normalized by the number of conidia (1.5 × 104 per assay) and were repeated at least three times. The current graphs show representative experiments. Source data are provided as a Source Data file.
Fig. 6
Fig. 6. A. fumigatus transcription factor SltA is important for the MoA of COL.
a A. fumigatus was grown in liquid MM using 96-well plates at 37 °C in the presence of different concentrations of COL. After 48 h, the metabolic activity % was assessed by the alamar blue assay. The results represent the average of two independent experiments. b Western blot showing the increased cleavage of SltA when the A. fumigatus SltA:FLAG strain is exposed to COL 40 µM. The WB are representative results from three independent experiments. c A. fumigatus wild-type, and ΔsltA strains (5 µL with 1 × 104 conidia) were grown on solid medium with different treatments as indicated. The plates were incubated for 4 days at 37 °C, radial growth was measured, and the values are expressed as treatment/control ratio. The results are the result of 3 independent experiments performed in duplicate ± SD. The data were statistically analyzed by the Two-way ANOVA test (n = 6; ****p < 0.0001 with Sidak’s multiple comparisons test comparing the ΔsltA, mutant with the wild-type strain). d–g. The linear graphs indicate the real-time [Ca2+]c changes in response to different drug stimuli (CAS 0.2 µg/mL, COL 20 µM, or the combination of CAS 0.2 µg/mL + COL 20 µM)[Ca2+]c, the free Ca2+ concentration in cytosol. Basal [Ca2+], the resting level prior to extracellular calcium stimulus. [Ca2+] amplitude, the peak value after the extracellular calcium stimulus. Response value, the difference between the basal [Ca2+] level and the poststimulatory peak value. The data are the average of eight (d) or six biological replicates (e–g.). Error bars show the SD. Statistical significance was determined by One-way ANOVA and a t-test (*p < 0.05; **p < 0.01; ***p < 0.001; ***p < 0.0001). Source data are provided as a Source Data file.
Fig. 7
Fig. 7. The calcineurin signaling pathway is important for COL bioactivity.
a, b A. fumigatus wild-type and ΔsltA strains were grown on solid MM without or with different treatments (COL 40 µM, CaCl2 [25, 50, or 100 mM], or a combination of COL and CaCl2). After 4 days at 37 °C, the radial growth was measured, and the values are expressed as treatment/control ratios. Results are expressed as the average of 3 independent experiments performed in technical duplicate ± SD. The data was statistically analyzed by the Two-way ANOVA test (n = 6; ****p < 0.0001 with Sidak’s multiple comparisons test comparing the ΔsltA, mutant with the wild-type strain). c, d Conidia of A. fumigatus wild-type, ΔcalA, and ΔcrzA strains (5 μL with 1 × 104 conidia) were grown on solid MM or MM supplemented with COL (20 and 40 μM), CAS (0.06 μg/mL), or combinations of both compounds, as indicated. The plates were incubated for 4 days at 37 °C. The values are expressed as treatment/control ratios and show the average of 3 independent experiments performed in technical duplicate ± SD. The data was statistically analyzed by the Two-way ANOVA test (n = 6; ****p < 0.0001 with Sidak’s multiple comparisons post-test). e A. fumigatus wild-type, ΔsltA, ΔcrzA, ΔsltA ΔcrzA, and ΔsltA:sltA+ strains (5 μL with 1 ×  104 conidia) were grown on solid MM either without any treatment or supplemented with 20 and 40 μM of COL, 0.06 μg/mL of CAS, or the combination of both, as indicated. The plates were incubated for 4 days at 37 °C. Results are expressed as treatment/control and show the average of 3 independent experiments performed in technical duplicate ± SD. The data was statistically analyzed by the Two-way ANOVA test (n = 6; ****p < 0.0001 with Tukey´s multiple comparisons post-test). f The CrzA:GFP and ΔsltA CrzA:GFP were grown for 16 h in liquid MM and transferred to CaCl2 (50 mM), COL (40 µM), and CaCl2 + COL (50 mM +  40 µM) for 15 min. CrzA:GFP nuclear translocation to the nucleus was analyzed. Hundred germlings were counted for each treatment, and the results are expressed as % of CrzA:GFP nuclear localization for germlings. Results represent the average of two independent experiments with at least 230 nuclei assessed in each assay ± SD. The data was statistically analyzed by the Two-way ANOVA test and Tukey´s post-test (****p < 0.0001, *** p < 0.0005, and * p < 0.05). Source data are provided as a Source Data file.
Fig. 8
Fig. 8. COL and COL + CAS are not toxic to A549 pulmonary epithelial cells and COL + CAS decreases the A. fumigatus fungal burden.
a A549 pulmonary epithelial cells were treated with CAS (100 μg/mL), COL (20, 40, 80 μM) or a combination of CAS + COL. After 48 h, cell viability was evaluated by the XTT assay. Positive and negative controls were 10% DMSO and untreated cells, respectively. The results show the average of five biological replicates ±SD. The data was statistically analyzed by the ordinary two-way ANOVA and Tukey´s post-test (n = 5; ****p < 0.0001 ns: not significant). b HepG2 liver cells were treated with 50 μg/mL of CAS, and 0 to 80 μM of COL alone, and in combination with 50 μg/mL of CAS, and after 48 h, cell viability was evaluated by Alamar blue assay. Positive and negative controls were topotecan, DMSO, and double-distilled (dd) water, respectively. The results represent the average of two independent experiments performed in technical triplicate ± SD (n = 6). c A. fumigatus conidial viability after infecting A549 pulmonary epithelial cells (MOI 1:10). After 24 h of incubation in 5% CO2, the culture media were removed, the wells were washed, the A549 cells were lysed, and the cell suspension was collected. This suspension was then diluted and plated on Sabouraud Dextrose Agar Media (SAB). After 48 h incubation at 37 °C, the number of colony-forming units (CFUs) was determined. VOR was used as a positive control. The results represent the average of three independent experiments performed in technical duplicate (n = 6). Data was statistically analyzed by the ordinary two-way ANOVA and Dunnett´s post-test (****p < 0.0001; ***p < 0.0005, and *p < 0.05). d Survival curves of G. mellonella larvae infected and treated (PBS, COL 40 µM, CAS 0.4 µg/mL or a combination of COL 40 µM + CAS 0.4 µg/mL). Uninfected and PBS-treated larvae were used as a negative control. The results are the combination of two independent experiments with 10 animals in each treatment (n = 20). Statistical differences between groups were determined using a log-rank test. **p < 0.01; ***p < 0.001; ns, not significant. e Survival curves of C. elegans infected and treated (water, COL 40 µM, CAS 0.4 µg/mL or a combination of COL 40 µM + CAS 0.4 µg/mL Uninfected and water-treated larvae were used as a negative control. Log-Rank (Mantel-Cox) was used to determine the significance between Kaplan-Meier survival curves. The results are the combination of two independent experiments with 61 and 68 (water), 63 and 60 (COL), 51 and 79 (CAS), and 54 and 62 (COL + CAS) animals in each treatment. Statistical differences between groups were determined using a log-rank test. **p < 0.01; ***p < 0.001; ns, not significant. Source data are provided as a Source Data file.
Fig. 9
Fig. 9. Model for the proposed MoA of COL + CAS that ensures loss of cell viability.
In calcium-repleted conditions (left panel), calcium channels and transporters allow calcium transport into the cytoplasm, activating calcium sensors, like calmodulin (CaM), that bind to the regulatory subunit of calcineurin (CnaB), releasing the phosphatase activity of the catalytic subunit of calcineurin (CnaA). CnaA dephosphorylates the transcription factor CrzA that is translocated to the nucleus, turning on (+) the expression of the vacuolar calcium transporter-encoding gene pmcA-C and the vacuolar Ca2+/H+ exchanger-encoding gene vcxA to avoid the excessive vacuolar storage of calcium and genes for stress responses and cell wall modifications. The cell wall integrity pathway comprises PkcA (protein kinase C), the mitogen-activated kinases (MAPK), MAPKKK (Bck1), MAPKK (Mkk2), and MAPK (MpkA), which are functionally and sequentially phosphorylated, allowing the phosphorylation and activation of RlmA transcription factor in the nucleus (+ sign). Active RlmA enables the transcription of enzymes responsible for the biosynthesis and/or remodeling of the cell wall (not shown in the Figure). One of them is α-glucan synthase 1 (not shown), which was used as a proxy for the RlmA-regulated network in the luciferase reporter assays. Another possible candidate is fks1, which encodes the β-1,3-glucan synthase, the enzyme responsible for the biosynthesis of β−1,3-glucan, the main polysaccharide in the A. fumigatus cell wall. and the molecular target of CAS. Mitochondria are intact and functional during these processes. Calcium-limited conditions (right panel) are induced promptly upon exposure of the cells to COL + CAS. Non-competitive inhibition of Fks1 imposed by CAS inhibition results in a decrease in the β−1,3-glucan content in the cell wall. The lack of this polysaccharide weakens the cell wall and increases the impact of osmotic pressure, disrupting the plasma membrane integrity pathway. Combination of COL + CAS inhibits PkcA signaling and impairment of RlmA output. The transcription factor SltA plays a dual role in maintaining calcium homeostasis under calcium-limited conditions. A. fumigatus SltA transcription factor is activated upon a proteolysis modification that depends on SltB, a chymotrypsin-like serine protease. It is currently unknown how SltB is regulated (question mark). SltA represses the expression and nuclear localization of CrzA, probably by affecting the activity of calcineurin, decreasing the expression and activity of calcium channels and transporters in the cell membrane (- sign). SltA regulates the expression of pmcA, pmcB, vcxA, and the Golgi calcium transporter-encoding gene pmrA by directly binding to the conserved AGGCA motif in their promoter regions. SltA can regulate the expression of pmcC and the mitochondrial calcium transporter-encoding gene mcuA in an indirect manner (not shown). The combination of COL + CAS impairs the function of CWI, plasma membrane integrity, and SltA, resulting in a cell death process through a combination of calcium starvation, increased leakage of cytoplasmic contents, and non-functional mitochondria due to enhanced fragmentation. The figure was created using the software Affinity Designer 2 (version 2.6.2).

References

    1. Bongomin, F., Gago, S., Oladele, R. O. & Denning, D. W. Global and multi-national prevalence of fungal diseases-estimate precision. J. Fungi3, 57 (2017). - PMC - PubMed
    1. Brown, G. D. et al. Hidden killers: human fungal infections. Sci. Transl. Med.4, 165rv13 (2012). - PubMed
    1. Denning, D. W. Global incidence and mortality of severe fungal disease. Lancet Infect. Dis.24, e428–e438 (2024). - PubMed
    1. Gnat, S., Łagowski, D., Nowakiewicz, A. & Dyląg, M. A global view on fungal infections in humans and animals: opportunistic infections and microsporidioses. J. Appl. Microbiol.131, 2095–2113(2021). - PubMed
    1. Guinea, J. et al. Pulmonary aspergillosis in patients with chronic obstructive pulmonary disease: incidence, risk factors, and outcome. Clin. Microbiol. Infect.: Off. Publ. Eur. Soc. Clin. Microbiol. Infect. Dis.16, 870–877 (2010). - PubMed

MeSH terms

LinkOut - more resources