. 2025 Jul 1;16(1):5839.
doi: 10.1038/s41467-025-61055-y.

Phage-mediated peripheral kill-the-winner facilitates the maintenance of costly antibiotic resistance

Affiliations

Phage-mediated peripheral kill-the-winner facilitates the maintenance of costly antibiotic resistance

Chujin Ruan et al. Nat Commun. .

Abstract

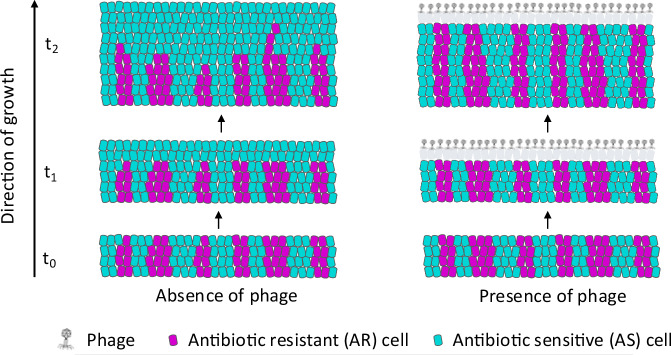
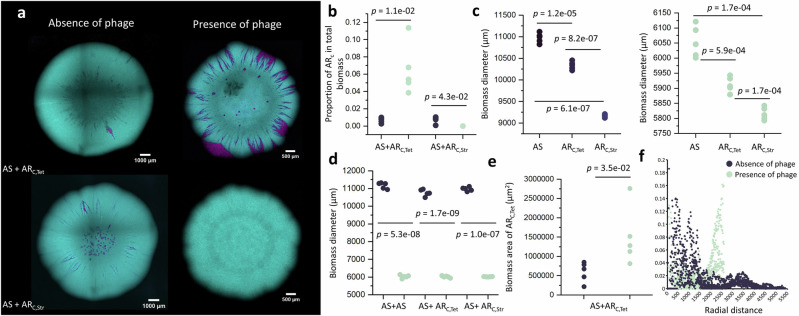
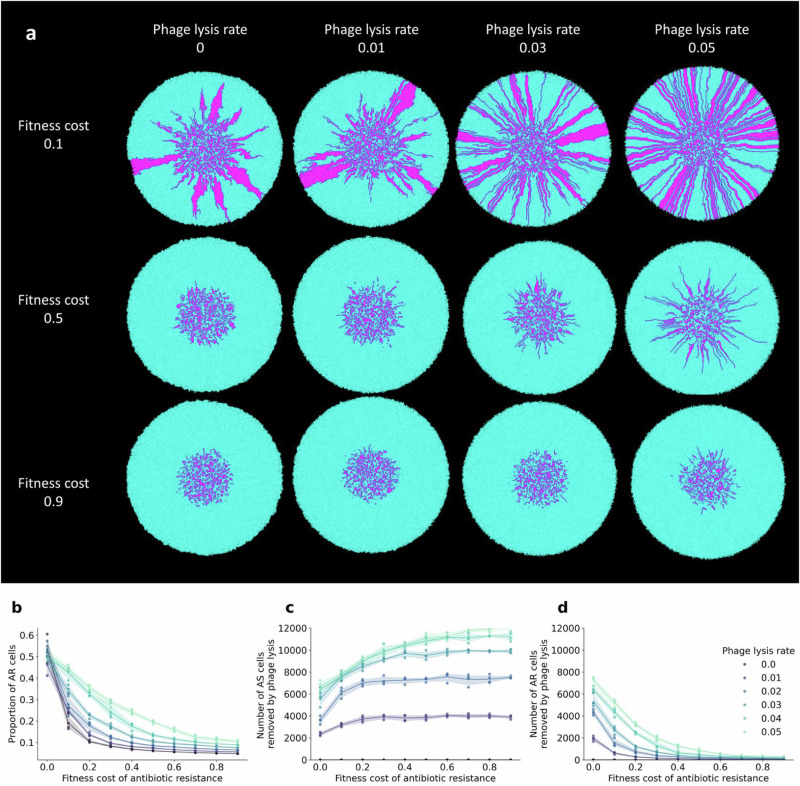
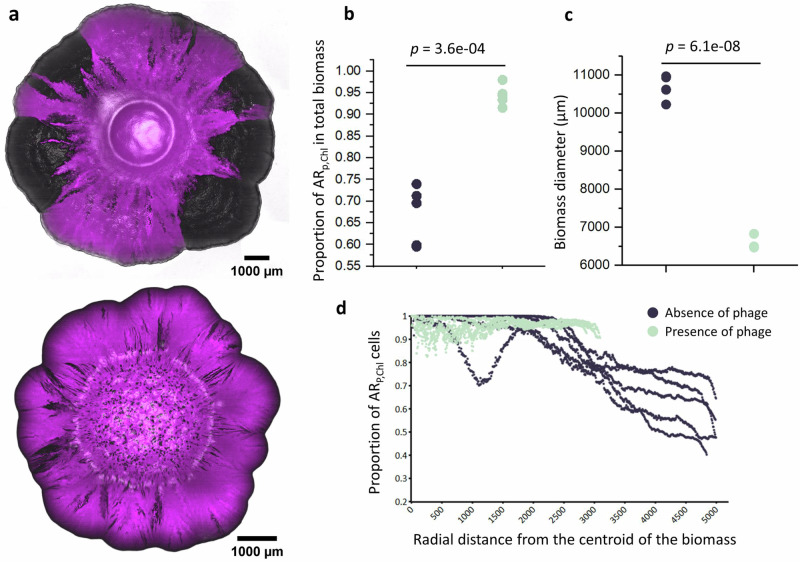
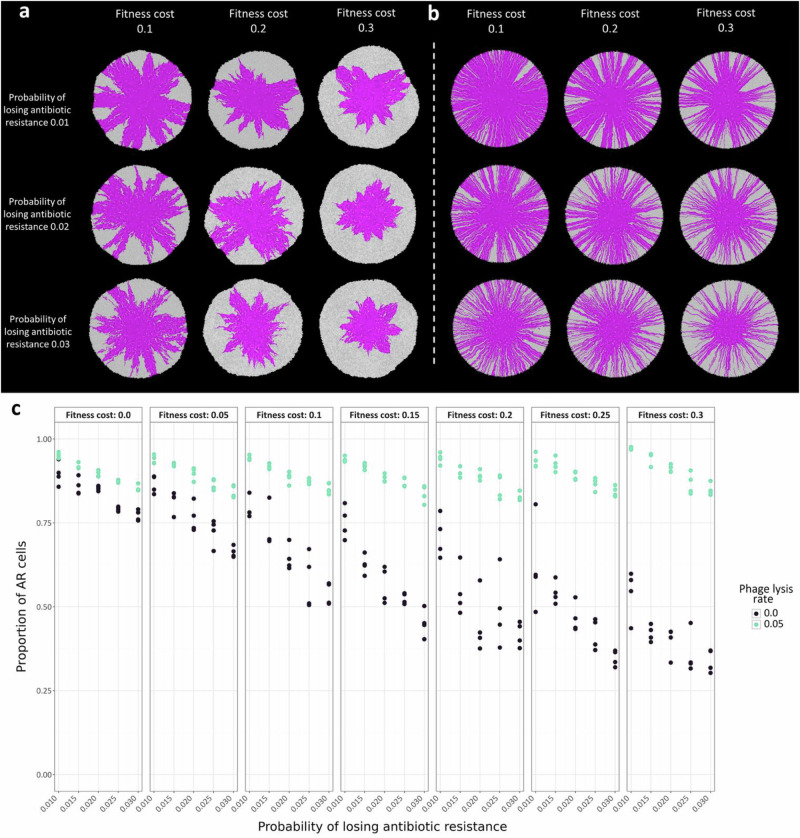
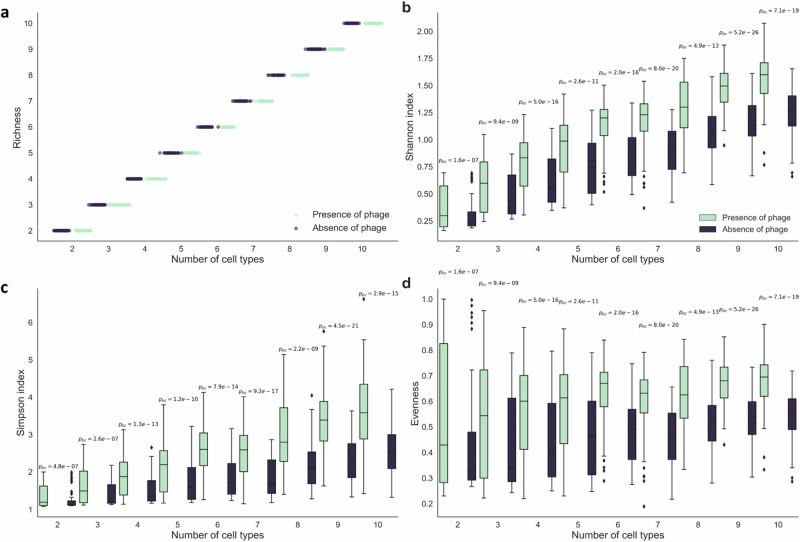
The persistence of antibiotic resistant (AR) bacteria in the absence of antibiotic pressure raises a paradox regarding the fitness costs associated with antibiotic resistance. These fitness costs should slow the growth of AR bacteria and cause them to be displaced by faster-growing antibiotic sensitive (AS) counterparts. Yet, even in the absence of antibiotic pressure, slower-growing AR bacteria can persist for prolonged periods of time. Here, we demonstrate a mechanism that can explain this apparent paradox. We hypothesize that lytic phage can modulate bacterial spatial organization to facilitate the persistence of slower-growing AR bacteria. Using surface-associated growth experiments with the bacterium Escherichia coli in conjunction with individual-based computational simulations, we show that phage disproportionately lyse the faster-growing AS counterpart cells located at the biomass periphery via a peripheral kill-the-winner dynamic. This enables the slower-growing AR cells to persist even when they are susceptible to the same phage. This phage-mediated selection is accompanied by enhanced bacterial diversity, further emphasizing the role of phage in shaping the assembly and evolution of bacterial systems. The mechanism is potentially relevant for any antibiotic resistance genetic determinant and has tangible implications for the management of bacterial populations via phage therapy.


Conflict of interest statement

Competing interests: The authors declare no competing interests.

Figures

Fig. 1
Fig. 1. Schematic of the peripheral kill-the-winner hypothesis.
In the absence of phage, we expect that faster-growing antibiotic-sensitive (AS) cells (cyan) will displace slower-growing antibiotic-resistant (AR) cells (magenta) along the biomass periphery. In the presence of phage, however, we expect that the slower-growing AR cells will persist with the faster-growing AS cells. This is because the faster-growing AS cells will disproportionately occupy the biomass periphery, and they will therefore be more susceptible to phage lysis. This will increase the removal of AS cells from the biomass and counteract the benefits of their faster growth relative to the slower-growing AR cells, thus increasing the persistence of the slower-growing AR cells.
Fig. 2
Fig. 2. Phage lysis increases the persistence of slower-growing AR cells.
a Representative CLSM images of co-cultures of strains AS (cyan) and ARC,Tet (magenta) (upper images) or of strains AS (cyan) and ARC,Str (magenta) (lower images) in the absence or presence of phage T6. We imaged the biomass after ten days of incubation in the absence of antibiotic pressure. b The proportions of the total biomass areas occupied by strains ARC,Tet or ARC,Str when grown in co-culture with strain AS in the absence or presence of phage T6. c The biomass diameters of strains AS, ARC,Tet and ARC,Str when grown in monoculture in the absence (left) or presence (right) of phage T6. d The biomass diameters of co-cultures of strains AS and ARC,Tet or strains AS and ARC,Str in the absence or presence of phage T6. e The biomass areas (population size) of strain ARC,Tet, when grown in co-culture with strain AS in the absence or presence of phage T6. f The proportions of ARC,Tet cells within co-cultures as a function of the radial distance from the centroid of the biomass. For bf, each data point is an independent experimental replicate (n = 5), the black data points are for experiments in the absence of phage T6, and the green data points are for experiments in the presence of phage T6. For be, the p values are for two-sample two-sided Welch tests. Source data are provided as a Source Data file.
Fig. 3
Fig. 3. Fitness cost and rate of phage lysis determine the persistence of slower-growing AR cells.
a Representative individual-based computational simulations of co-cultures of strains AS (cyan) and AR (magenta) in the absence or presence of phage lysis with different fitness costs of antibiotic resistance and rates of phage lysis. The images are the outputs at the last simulation time step. b The proportions of AR cells as a function of the fitness cost of antibiotic resistance for different rates of phage lysis. c The number of AS cells removed by phage lysis as a function of the fitness cost of antibiotic resistance for different rates of phage lysis. d The number of AR cells removed by phage lysis as a function of the fitness cost of antibiotic resistance for different rates of phage lysis. For bd, each data point is an independent simulation (n = 4), the lines connect the mean values, and the shaded regions are ± one standard deviation from the mean. Source data are provided as a Source Data file.
Fig. 4
Fig. 4. Phage lysis increases the persistence of slower-growing AR cells in the face of spontaneously generated AS cells.
a Representative CLSM images of strain ARP,Chl (magenta) in the absence (upper image) or presence (lower image) of phage T6. Non-fluorescent regions are composed of ARP,Chl cells that spontaneously lost plasmid pEF001 and became AS cells. We took the images after 10 days of incubation at 21 °C in the absence of antibiotic pressure. b The proportions of the total biomass area occupied by strain ARP,Chl in the absence or presence of phage T6. c The biomass diameters in the absence or presence of phage T6. d The proportions of ARP,Chl cells as a function of the radial distance from the centroid of the biomass. For bd, each data point is an independent experimental replicate (n = 5), the black data points are for experiments in the absence of phage T6, and the green data points are for experiments in the presence of phage T6. For b, c, the p values are for two-sample two-sided Welch tests. Source data are provided as a Source Data file.
Fig. 5
Fig. 5. Properties of spontaneously emerging AS cells determine the persistence of slower-growing AR cells.
a, b Representative individual-based computational simulations of strain AR (magenta) in the a absence or b presence of phage lysis with different fitness costs of antibiotic resistance and probabilities of losing antibiotic resistance. If AR cells undergo genetic changes that cause them to lose antibiotic resistance, such as the segregational loss of a plasmid, they are relieved of the fitness cost and become AS cells (gray). The images are the outputs at the last simulation time step. c The proportions of AR cells as a function of the fitness cost of antibiotic resistance and the probability of losing antibiotic resistance for different rates of phage lysis. Each data point is an independent simulation (n = 4), the black data points are in the absence of phage, and the green data points are in the presence of phage. Source data are provided as a Source Data file.
Fig. 6
Fig. 6. Phage lysis maintains strain diversity.
Data were for individual-based computational simulations of the surface-associated growth of co-cultures consisting of between two and ten strains, where each strain has a different growth rate ranging between zero and one. The growth rate of one strain is one and the growth rates of the other strains are sampled from a uniform distribution. ad The strain diversity metrics are for a fixed total biomass size and include a strain richness, b Shannon diversity, c Simpson diversity, and d evenness. For bd, the boxplots identify the mean values, interquartile ranges, and outliers for independent pairs of simulations (n = 35 for each number of cell types). The black boxplots and data points are in the absence of phage and the green boxplots and data points are in the presence of phage. The p values are for two-sided paired t-tests with a Bonferroni correction. Source data are provided as a Source Data file.

Similar articles

References

    1. Cassini, A. et al. Attributable deaths and disability-adjusted life-years caused by infections with antibiotic-resistant bacteria in the EU and the European Economic Area in 2015: a population-level modelling analysis. Lancet Infect. Dis.19, 56–66 (2019). - PMC - PubMed
    1. Murray, C. J. L. et al. Global burden of bacterial antimicrobial resistance in 2019: a systematic analysis. Lancet399, 629–655 (2022). - PMC - PubMed
    1. Vogwill, T. & MacLean, R. C. The genetic basis of the fitness costs of antimicrobial resistance: a meta-analysis approach. Evol. Appl.8, 284–295 (2015). - PMC - PubMed
    1. A. San Millan. & R. C. MacLean (2017) Fitness costs of plasmids: a limit to plasmid transmission. Microbiol. Spectr. 10.1128/microbiolspec.mtbp-0016-2017 (2017). - PMC - PubMed
    1. Seppälä, H. et al. The effect of changes in the consumption of macrolide antibiotics on erythromycin resistance in Group A Streptococci in Finland. Finnish Study Group for Antimicrobial Resistance. N. Engl. J. Med.337, 441–446 (1997). - PubMed

MeSH terms

Substances