. 2025 Jul 1;16(1):5885.
doi: 10.1038/s41467-025-61018-3.

Stimulation of corticospinal neurons by optogenetic cAMP inductions promotes motor recovery after spinal cord injury in female rats via raphespinal tract modulation

Affiliations

Stimulation of corticospinal neurons by optogenetic cAMP inductions promotes motor recovery after spinal cord injury in female rats via raphespinal tract modulation

Beatriz Martínez-Rojas et al. Nat Commun. .

Abstract

After spinal cord injury (SCI), cyclic adenosine monophosphate (cAMP) levels drop in the spinal cord, cortex and brainstem, unlike in regenerating peripheral neurons. To address SCI recovery, we expressed photoactivatable adenylate cyclase (bPAC) in corticospinal neurons of female rats with dorsal hemisection for on-demand cAMP inductions. bPAC stimulation restored passive and firing properties of corticospinal neurons, promoted early and sustained locomotor recovery and increased corticospinal tract plasticity. Additionally, bPAC enhanced sparing of lumbar-projecting brainstem neurons after SCI, accompanied by activation of cAMP signaling in the raphe-reticular formation and increased excitatory/inhibitory neurotransmitter balance. Accordingly, augmented density of serotonergic tracts was found caudal to the injury in bPAC rats, correlating with enhanced functional performance. Serotonergic implication in motor recovery was further evidenced by selective depletion, resulting in the abrogation of bPAC-mediated recovery. Overall, our findings underscore that cAMP induction in corticospinal neurons enhances locomotion after SCI, through a cortical rerouting pathway via the serotonergic descending tract.


Conflict of interest statement

Competing interests: The authors declare no competing interests.

Figures
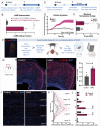
Fig. 1
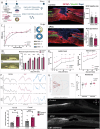
Fig. 1. bPAC stimulation induces cAMP levels and calcium mobilization in primary cortical cultures and increases P-CREB and c-Fos levels in the motor cortex of SCI rats.
A Experimental design for the in vitro determination of cAMP after saturating blue light exposure (90 s, 20 mW/cm2) in primary cortical neurons. B cAMP levels measured by high-performance liquid-chromatography in Control (gray) or bPAC (magenta) cultured cortical neurons normalized to total protein content. Three independent experiments, 2 technical replicates per experiment; p = 0.0054. C Experimental design for live calcium in vitro assays during blue light stimulation in bPAC-expressing (bPAC + ) or non-bPAC expressing (bPAC-) neurons in the same well. D Graphs for the change in fluorescent given by Fluo-4AM (green) defined as Fx-F0/F0 as well as (E) the maximum fluorescent change calculated as Fmax-F0/F0 for each neuron in bPAC+ (magenta) and bPAC- neurons (gray). Sample size reflects individual neurons across two independent experimental replicates; p < 0.0001. F Experimental schema describing the in vivo implementation of bPAC strategy. G Schema illustrating the brain region analyzed in P-CREB and c-Fos quantifications. H Representative images for P-CREB immunolabelling in Control (right) and bPAC (left) injured animals, 10 days after dorsal hemisection and optogenetic stimulation. Scale bar: 500 µm. I bar-graph for the quantification of the effect of bPAC stimulation on CREB phosphorylation in the motor cortex. Three animals/group, mean of two hemispheres/animal; p = 0.0207. J Representative images for c-Fos immunostaining, Scale bar: 200 µm, and K, L quantification of the effect of bPAC on c-Fos activation across cortical layers. Three animals/group, mean of 3–5 hemispheres/animal; p = 0.038 for the layer V. Data is presented as a mean ± SEM with statistical significance set as *p < 0.05, **p < 0.01, and *** p < 0.001 for comparisons using two-tailed unpaired t test (B), two-tailed Mann-Withney test (E), Two-way Anova (L) and one-tailed t-test (I). Source data are provided as a Source Data file.
Fig. 2
Fig. 2. Passive and firing properties of layer 5 pyramidal neurons from motor cortex of uninjured, Control (injured) and bPAC (injured) rats.
A Representative examples at resting membrane potential in basal conditions. BE passive electrophysiological membrane properties. B Resting membrane potential (Vm) of Layer V neurons at basal conditions. C Membrane capacitance (Cm) of neurons and (D) their membrane resistance (Rm). E Membrane time constant. F Representative examples trace of neurons in response to the protocol shown on the right, no hyperpolarizing sag is observed in response to 500 ms, −100 pA and illustrating the firing rate differences. G Representative example traces of the firing threshold and firing rate (top) in response to 19 depolarizing pulses protocol, 10 pA increments, 700 ms duration (bottom). The threshold current at rheobase for each group is represented at the bottom accordingly and the AP delay is marked up with a double arrowhead line for each group on top of the AP firing. H Quantification of the firing rate in response to 500 ms, 250 pA depolarizing current step, applied in (F). I Quantification of the AP firing threshold, (J) lower intensity of the threshold current needed for eliciting one first AP firing (at rheobase) in the bPAC-treated group. K Quantification of the AP delay. L and M Input-output curves (e.g., see at 20 and 50 pA in L). Statistics performed in (BD and HL) Ordinary one-way ANOVA followed by Holm-Sidak multiple comparisons post hoc test. Statistics performed in (E and M) Kruskal-Wallis test followed by Dunn’s multiple comparisons post hoc test. Data is presented as a mean ± SEM with statistical significance set as *p < 0.05, **p < 0.01, *** p < 0.001 and **** p < 0.0001, n.s: not significant. Sample size corresponds to individual neurons recorded across three biological replicates per group. Source data and exact P values for each comparison are provided as a Source Data file and Supplementary table 1.
Fig. 3
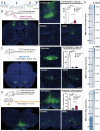
Fig. 3. bPAC stimulation promotes early and sustained locomotor recovery after SCI.
A Experimental design for functional evaluation in bPAC and Control SCI rats for 35-day after dorsal hemisection (n = 9 rats/group). B Immunostaining images for GFAP (red) and Neun (green) and the quantification of both GFAP negative area and NeuN gap distances as indicators of injury extension. C Pie-charts of the percentage of Control and bPAC rats with or without weight support and plantar stepping capacity at ten days post-injury. D Measurement of iliac crest height as an indicator of weight-bearing capacity (p = 0.002 at 6dpi and 0.0007 at 10 dpi). E Performance of bPAC and Control rats in ladder (left) and narrow (right) beam tests (p = 0.02, 0.06, 0.02 and 0.045 at 17, 23, 29 and 35 dpi respectively). F Hind-limb kinematics at the endpoint of the experiment (35 days) in Control and bPAC rats compared to uninjured Control rats as shown by the hip (top), knee (middle), and ankle (bottom) angle range. G Principal component analysis of combined locomotor parameters in Control and bPAC rats; bbb: Basso, Beattie, Bresnahan test; pln: inclined plane test; nb: narrow beam test; lb: ladder beam test; ci: crest iliac height. Numbers indicate the days post injury; (H) Thermal test of the front paws (as an internal control) and hind paws in Control and bPAC rats. I Quantification of CST state rostral and caudal to the injury as given by the area positive for the anterograde tracer (mCherry) (p = 0.0077). J Sagittal images of the CST state in control and bPAC rats (Scale bar:1000 μm). Data is presented as a mean ± SEM with statistical significance set as *p < 0.05, **p < 0.01, and *** p < 0.001 for comparisons two-tailed Fisher’s LSD (CE and H) or two-tailed un-paired t-test (I). Scale bars=1000 mm. Source data are provided as a Source Data file.
Fig. 4
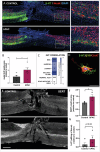
Fig. 4. bPAC stimulation increases retrogradely-labeled neurons in the motor cortex and raphe-reticular formation, but not in the red nucleus. The counts of retrogradely-labeled neurons in the raphe-reticular formation directly correlated to improved locomotion.
A Experimental design for analyzing the supraspinal descending tracts by retrograde tracing using AVV2-Syp-eGFP injections in the lumbar spinal cords in uninjured Control, injured Control, and bPAC rats. BD Representative images (left) of retrogradely-labeled neurons (eGFP) observed in the B) motor cortex (p < 0.0001, for uninjured vs control and bPAC and 0.0366 for bPAC vs control), C red nuclei (p < 0.0001, for uninjured vs control and bPAC and 0.6 for bPAC vs control), and (D) raphe-reticular formation (p < 0.0001, for uninjured vs control and bPAC and 0.06 for bPAC vs control) and their respective quantification. Each data point represents a biological replicate. E Pearson correlations between the counts of retrogradely-labeled neurons in the motor cortex (top), red nuclei (middle), and raphe reticular formation (bottom) and the BBB scores at 1-, 2-, 3-, 4-, 7- and 10-days post-injury. The graph shows P values for each comparison (one-tailed Pearson test); Color intensity indicates statistical significance as described in the legend. Scale bars= 1000 µm (for low magnification images) and 500 µm (for high magnification images). Data is presented as a mean ± SEM for one-way ANOVA comparisons and Tukey’s post-test with statistical significance set as *p < 0.05, ***p < 0.001, and **** p < 0.0001. Source data are provided as a Source Data file.
Fig. 5
Fig. 5. bPAC stimulation induces serotonergic tract regeneration/preservation across the injury correlating with improved functional recovery.
A Representative images of 5-HT immunostaining (green) in sagittal sections of the spinal cords in Control and bPAC rats 35 days post-injury at low and high magnifications (Scale bars = 1000 and 200 µm, respectively) and (B) its quantification, n = 7 rats/group, p = 0.029. C Pearson correlations between several locomotor tests and the amount of caudal 5HT staining. Color code indicates the Pearson R coefficient, as shown in the legend; P values for each correlation are indicated inside each cell. D Representative image showing a ChAT+ motor neuron (red) innervated by serotonergic axons (green) and synaptic contacts (yellow) between them. Scale bar = 50 µm. This observation was consistent across all biological replicates. E Representative images of serotonin transporter (SERT) immunostaining in sagittal sections (Scale bars=1000 mm) and F) its quantification, n = 3 animals/group, p = 0.03. G Quantification of 5-HT levels (μM/mg of in spinal cord tissue, ratio caudal/rostral) by HPLC, n = 4 animals/group, p = 0.08. Data is presented as a mean ± SEM for either two-tailed t-test (B), two-tailed Pearson correlation (C), one-tailed t-test (F) or one-tailed Man-Whitney test (G), with statistical significance set as *p < 0.05. Source data are provided as a Source Data file.
Fig. 6
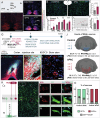
Fig. 6. bPAC stimulation may be transduced from the motor cortex to brainstem neurons.
A Representative example of an original (lower left) image and computed heat maps showing the density of corticobulbar projections into the brainstem for injured Control (right, upper) and bPAC rats (right, lower). Heat maps integrate data from 4 bPAC and 5 control biological replicates.; Scale bar= 200 µm. B Representative images of P-CREB staining in brainstem slices at higher (left upper and lower) and lower (right upper and lower) magnifications in injured Control and bPAC rats. Scale bars = 500 (left) and 100 (right) µm. C Quantification of the proportion of P-CREB relative to DAPI in each region in injured Control and bPAC rats,n = 3 animals/group, p = 0.04 for RMg. D Correlation between P-CREB in the motor cortex and brainstem. E Quantification of cAMP levels, n = 4 rats/group, p = 0.06 and F Glutamate/GABA concentrations in brainstem (μM/mg of tissue) by HPLC, n = 4 rats/group, p = 0.02. G Experimental design for studying synaptic connections between motor cortex and brainstem in injured Control and bPAC rats. H Representative images of the WGA and AVV injection sites at low (left) and high (right) magnifications. Scale bars = 500 (left) and 50 (right) µm. I Representative images of brainstem region displaying WGA-positive cells. Scale bar = 50 µm, n = 3 rats/group. J 3D reconstruction of WGA-positive cell counts and distribution in the brainstem region in injured Control and bPAC rats. Each brain representation includes data from three animals. Counts of WGA-positive neurons are expressed as mean ± SD. K Experimental schema for the double-tracing experiment and representative images showing different labeled populations within the brainstem, n = 3 rats/group, Scale bar = 200 µm. JL High-magnification images of (L) WGA + GFP-, M WGA + GFP+ and N) WGA-GFP+ neurons in the brainstem. Scale bar=50 µm. O graphs showing the percentage of double-positive neurons from the GFP+ (left) and WGA + (right) populations, n = 3 rats/group. Data is presented as Mean ± SEM for comparisons using two-tailed multiple t-test (C, O), two-tailed Pearson correlation (D), one-tailed t-test (E) or one-tailed Man-Whitney test (F), with statistical significance set as *p < 0.05. Source data are provided as a Source Data file.
Fig. 7
Fig. 7. Serotonergic depletion by DHT treatment abrogates bPAC-induced functional recovery after SCI.
A Experimental design to study serotonergic involvement in bPAC-mediated functional recovery. DHT treatment was applied to bPAC and Control rats 22 days after SCI, and their locomotor skills were evaluated before and 6 days after treatment. B 5-HT immunostaining in lumbar spinal cord slices of non-DHT-treated controls (denoted as DHT-) and DHT-treated rats (denoted as DHT + , both bPAC and Control rats) and its quantification. Scale bar = 50 μm. Each data dot represents a biological replicate, n = 0.009. C Functional evaluation pre- and 6 days post-DHT injections expressed as the absolute achieved score in the ladder beam test (left, bPAC preDHT vs Control preDHT: p = 0.02 and bPAC postDHT vs control postDHT: p = 0.55) or the increment score post- to pre-DHT treatment (right, p = 0.0004). Data is presented as Mean ± SEM, two-tailed Kolmogorov-Smirnov test (B), two-tailed t-test (C); * p ≤ 0.05, ** p ≤ 0.01, *** p ≤ 0.001, ns=not significant. Source data are provided as a Source Data file.

References

    1. Arber, S. & Costa, R. M. J. S. Connecting neuronal circuits for movement. Science.360, 1403–1404 (2018). - PubMed
    1. Dietz, V. J. N. R. N. Behavior of spinal neurons deprived of supraspinal input. Nat. Rev. Neurol.6, 167–174 (2010). - PubMed
    1. de la Torre-Valdovinos, B., L. P. Osuna-Carrasco, and C. A. C. Ramos, The Role of Supraspinal Structures for Recovery after SCI: From Motor Dysfunction to Mental Health, in Paraplegia. (2021).
    1. Welniarz, Q., Dusart, I. & Roze, E. J. D. N. The corticospinal tract: evolution, development, and human disorders. Dev. Neurobiol.77, 810–829 (2017). - PubMed
    1. Van Wittenberghe, IC. & Peterson, D. C. Corticospinal Tract Lesion. (Treasure Island (FL): StatPearls Publishing (NBK542201, 2023). Available from: https://www.ncbi.nlm.nih.gov/books/NBK542201/. - PubMed

MeSH terms

LinkOut - more resources