

Cerebellar reaching ataxia is exacerbated by timing demands and assistive interaction torques
- PMID: 40592911
- PMCID: PMC12216649
- DOI: 10.1038/s41598-025-03731-z
Cerebellar reaching ataxia is exacerbated by timing demands and assistive interaction torques
Abstract
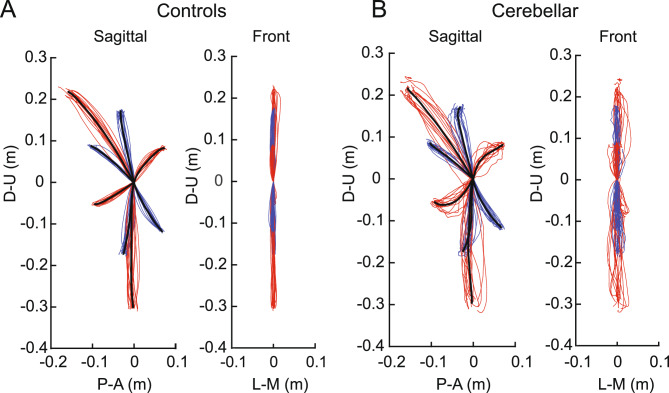
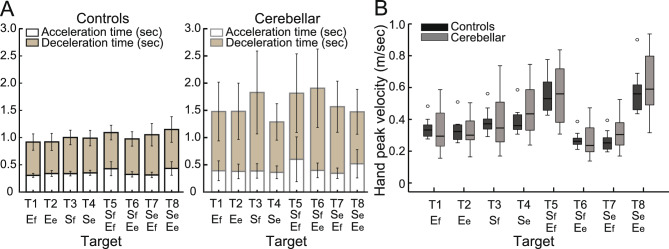
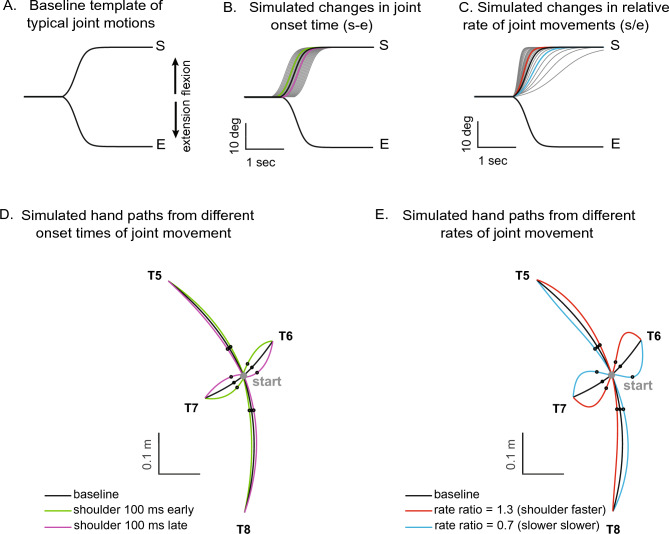
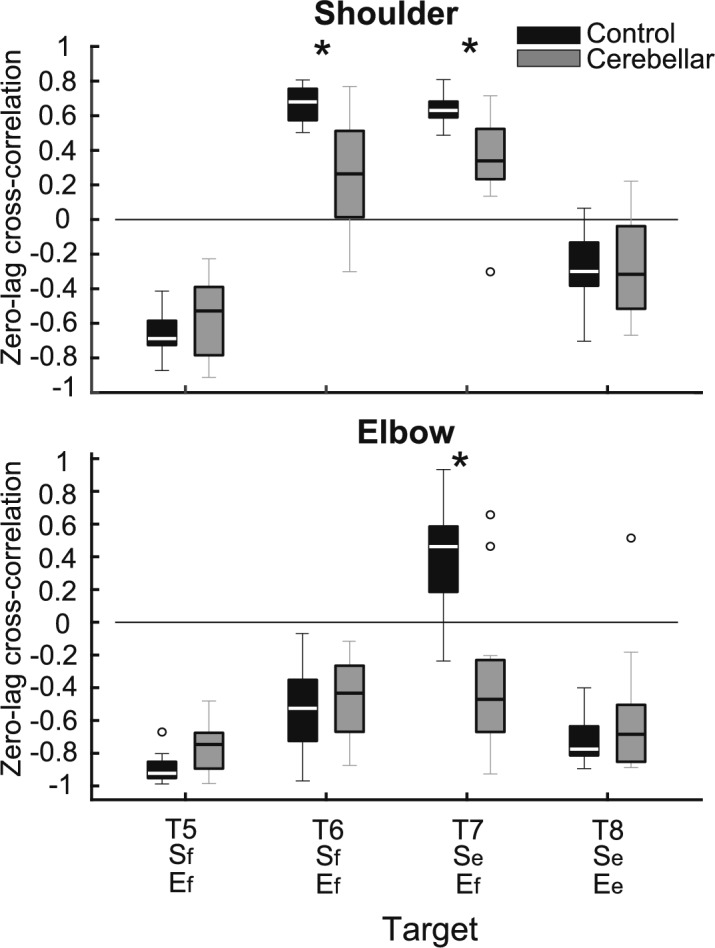
Individuals with cerebellar ataxia face significant challenges in controlling reaching, especially when multi-joint movements are involved. This study investigated the effects of kinematic and dynamic demands on reaching using a home-based virtual reality task. Participants with and without cerebellar ataxia reached to target locations designed to elicit a range of coordination strategies between shoulder and elbow joint movements. Compared with control subjects, cerebellar subjects presented greater initial reaching direction errors, larger hand trajectory curvatures, and more variability. Kinematic simulations indicated that early hand movement errors were sensitive to the required onset times and rates of joint movements and were most impaired when opposite direction joint movements were required (e.g., elbow extension with shoulder flexion). Dynamic analysis revealed that cerebellar participants' movements were more impaired in reaching directions where interaction torques would normally assist the desired elbow and shoulder movements. These reach directions were also those that required joint movements in opposite directions. Overall, our data suggest that reaching deficits in cerebellar ataxia result from (1) the early-phase motion planning deficits that are exacerbated by stringent timing coordination requirements and (2) the inability to compensate for interaction torques, particularly when they assist the intended movement.
Keywords: Ataxia; Cerebellum; Coordination; Dynamics; Kinematics; Reaching.
© 2025. The Author(s).
Conflict of interest statement
Competing interests: The authors declare no competing interests.
Figures


Update of
-
Cerebellar Reaching Ataxia is Exacerbated by Timing Demands and Assistive Interaction Torques.bioRxiv [Preprint]. 2025 May 14:2024.10.28.620711. doi: 10.1101/2024.10.28.620711. bioRxiv. 2025. Update in: Sci Rep. 2025 Jul 1;15(1):22129. doi: 10.1038/s41598-025-03731-z. PMID: 39554081 Free PMC article. Updated. Preprint.
Similar articles
-
Cerebellar Reaching Ataxia is Exacerbated by Timing Demands and Assistive Interaction Torques.bioRxiv [Preprint]. 2025 May 14:2024.10.28.620711. doi: 10.1101/2024.10.28.620711. bioRxiv. 2025. Update in: Sci Rep. 2025 Jul 1;15(1):22129. doi: 10.1038/s41598-025-03731-z. PMID: 39554081 Free PMC article. Updated. Preprint.
-
Force reserve predicts compensation in reaching movement with induced shoulder strength deficit.J Neurophysiol. 2024 Aug 1;132(2):470-484. doi: 10.1152/jn.00143.2024. Epub 2024 Jul 10. J Neurophysiol. 2024. PMID: 38985941 Free PMC article.
-
Cerebellar ataxia: abnormal control of interaction torques across multiple joints.J Neurophysiol. 1996 Jul;76(1):492-509. doi: 10.1152/jn.1996.76.1.492. J Neurophysiol. 1996. PMID: 8836239
-
Intravenous magnesium sulphate and sotalol for prevention of atrial fibrillation after coronary artery bypass surgery: a systematic review and economic evaluation.Health Technol Assess. 2008 Jun;12(28):iii-iv, ix-95. doi: 10.3310/hta12280. Health Technol Assess. 2008. PMID: 18547499
-
Systemic pharmacological treatments for chronic plaque psoriasis: a network meta-analysis.Cochrane Database Syst Rev. 2021 Apr 19;4(4):CD011535. doi: 10.1002/14651858.CD011535.pub4. Cochrane Database Syst Rev. 2021. Update in: Cochrane Database Syst Rev. 2022 May 23;5:CD011535. doi: 10.1002/14651858.CD011535.pub5. PMID: 33871055 Free PMC article. Updated.
References
-
- Hallett, M. & Massaquoi, S. G. Physiologic studies of dysmetria in patients with cerebellar deficits. Can. J. Neurol. Sci.20(Suppl 3), S83-92 (1993). - PubMed
-
- Goodkin, H. P., Keating, J. G., Martin, T. A. & Thach, W. T. Preserved simple and impaired compound movement after infarction in the territory of the superior cerebellar artery. Can. J. Neurol. Sci.20(Suppl 3), S93-104. 10.1017/s0317167100048599 (1993). - PubMed
-
- Thach, W. T., Goodkin, H. P. & Keating, J. G. The cerebellum and the adaptive coordination of movement. Annu. Rev. Neurosci.15, 403–442. 10.1146/annurev.ne.15.030192.002155 (1992). - PubMed
MeSH terms
Grants and funding
LinkOut - more resources
Full Text Sources
