. 2025 Jul 1;15(1):21961.
doi: 10.1038/s41598-025-05058-1.

Prognostic model of lung adenocarcinoma from the perspective of cancer-associated fibroblasts using single-cell and bulk RNA-sequencing

Affiliations

Prognostic model of lung adenocarcinoma from the perspective of cancer-associated fibroblasts using single-cell and bulk RNA-sequencing

Jiarui Zhao et al. Sci Rep. .

Abstract

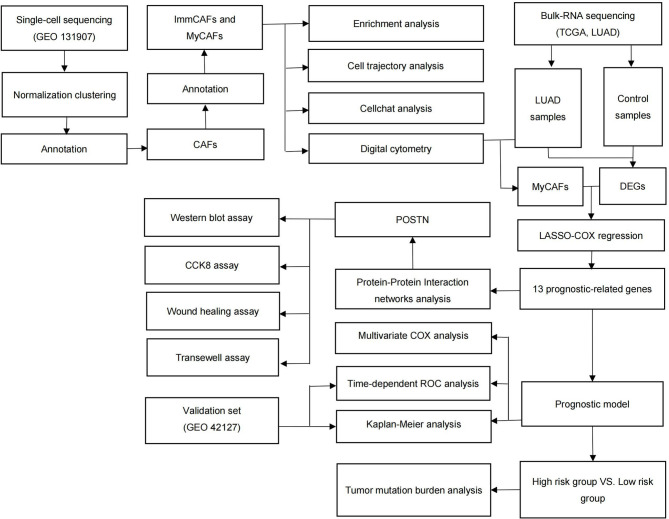
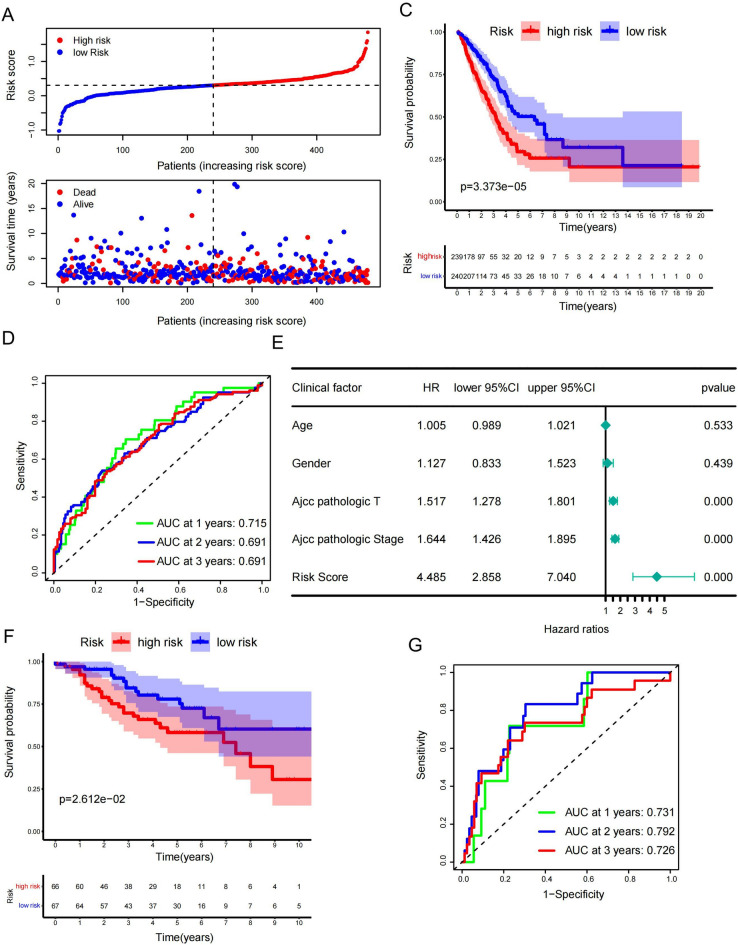
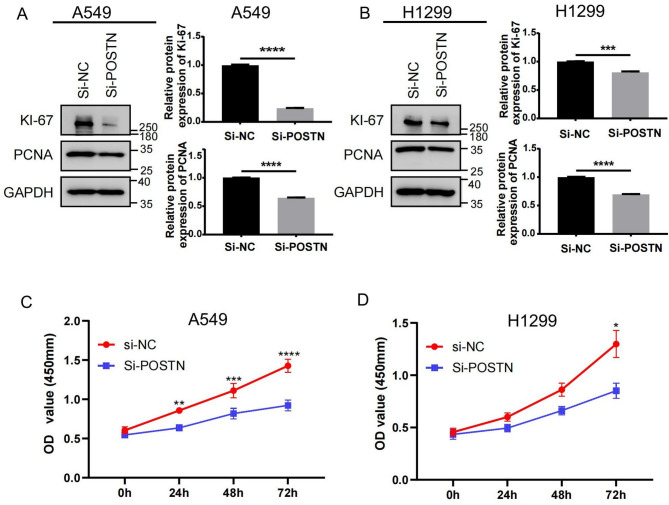
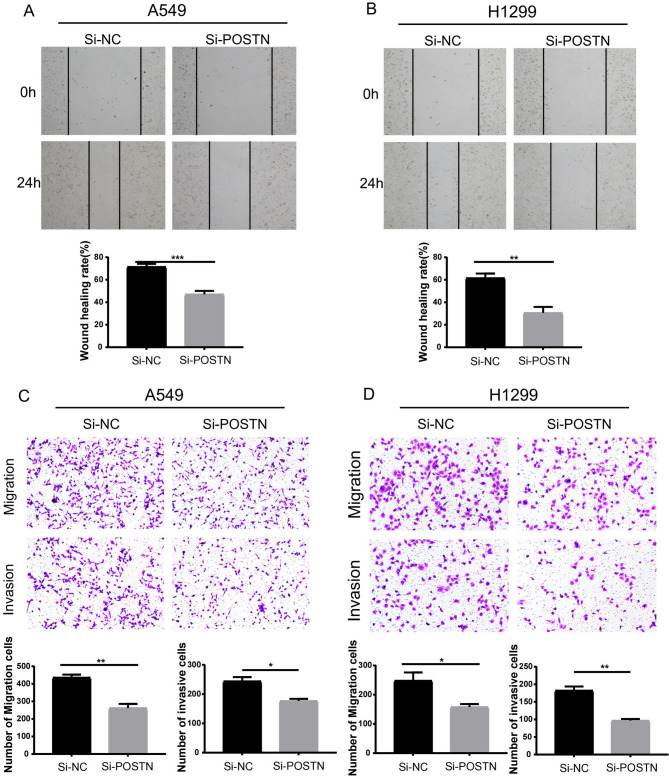
Cancer-associated fibroblasts (CAFs) play important roles in the progression of lung adenocarcinoma (LUAD). We examined CAF subgroups via gene ontology, pseudo-time, and cell communication analyses and explored their prognostic value in LUAD using a digital cytometric machine learning algorithm. Next, we got a prognostic model based on CAF subgroups. We also screened potential therapeutic target genes in LUAD and experimentally validated the proliferation, migration, and invasion phenotypes related to these target genes. We identified myofibroblastic CAFs (MyCAFs) and Immune-related CAFs (ImmCAFs) as the major CAF subgroups in LUAD. Further, our inverse convolution algorithm showed that MyCAFs have prognostic potential in LUAD, and via LASSO-COX model regression, we obtained a MyCAFs-related prognostic model. We found POSTN as a potential therapeutic target in LUAD. These findings serve as a foundation for further studies on CAFs.

Keywords: Cancer-associated fibroblasts; Lung adenocarcinoma; Machine learning; Single-cell and bulk RNA-sequencing.


Conflict of interest statement

Declarations. Competing interests: The authors declare no competing interests.

Figures

Fig. 1
Fig. 1
Technical flow diagram showing the procedures undertaken in this study.
Fig. 2
Fig. 2
CAFs subgroups in LUAD. (A) UMAP plot showing the distribution of 33 CAFs subgroups based on all cell types obtained via dimensionality reduction and clustering. (B) UMAP plot showing the distribution for 8 cell subgroups after cell annotation. (C) Marker genes for cell annotation. (D) UMAP plot showing the distribution of nine fibroblast subgroups obtained via dimensionality reduction and clustering. (E) UMAP plot showing the distribution of seven fibroblast subgroups after cell annotation. (F) Marker genes for different fibroblast subgroups. CAFs cancer-associated fibroblasts, UMAP uniform manifold approximation and projection.
Fig. 3
Fig. 3
Characterization of MyCAFs and ImmCAFs. (A) Results of GO enrichment analysis for ImmCAFs. The larger dot represented a higher number of enriched genes, and the redder color of the dot represented a more significant relationship. (B) Results of GO enrichment for MyCAFs. The larger dot represented a higher number of enriched genes, and the redder color of the dot represented a more significant relationship. (C) Histogram showing differences in the proportion of ImmCAFs and MyCAFs between tumor and normal tissue samples. (D) UMAP plot showing the selection of ImmCAFs as the starting point for the cell trajectory analysis. ImmCAFs were indicated by purple color and MyCAFs were indicated by orange color. (E) Progression from ImmCAFs to MyCAFs with changing proposed time for cell trajectory analysis. (F) Top altered genes during the transformation of ImmCAFs to MyCAFs. (G) WNT pathway in ImmCAFs. (H) WNT pathway in MyCAFs. (I) Specific ligand activities of the WNT pathway in ImmCAFs. The WNT3A pathway was found to be involved in cellular communication in ImmCAFs. The ImmCAFs communicated with themselves and with epithelial cells. (J) Specific ligand activities of the WNT pathway in MyCAFs. The WNT3A and WNT2 pathways were found to be involved in cellular communication in MyCAFs. The MyCAFs communicated with themselves as well as with B, T/NK, endothelial, epithelial, MAST, and myeloid cells. GO gene ontology, CAFs cancer-associated fibroblasts, MyCAFs myofibroblastic cancer-associated fibroblasts, ImmCAFs immune-related cancer-associated fibroblasts, UMAP uniform manifold approximation and projection. P < 0.05 denotes statistically significant differences.
Fig. 4
Fig. 4
Prognostic ability of MyCAFs and ImmCAFs explored via digital cytometry. (A) Grouping of LUAD samples based on the median relative abundance of ImmCAFs. (B) Exploration of the prognostic value of ImmCAFs via survival analysis. (C) Grouping of LUAD samples based on the median relative abundance of MyCAFs. (D) Exploration of the prognostic value of MyCAFs in LUAD via survival analysis. TCGA The Cancer Genome Atlas, LUAD lung adenocarcinoma, MyCAFs myofibroblastic cancer-associated fibroblasts, ImmCAFs immune-related cancer-associated fibroblasts. P < 0.05, statistically significant differences.
Fig. 5
Fig. 5
Construction of a prognostic model associated with MyCAFs. (A) The 13,899 DEGs between normal and LUAD samples in TCGA database based on P < 0.05 and Fold change (log2FC) > 1. There were 3193 up-regulated DEGs, indicated by red dots. There were 10,706 down-regulated DEGs genes, indicated by blue dots. (B) There were 13,899 DEGs and 64 MyCAFs-related genes. Venn diagram showing 28 MyCAFs-related DEGs obtained by intersecting DEGs with MyCAFs-related genes. (C) LASSO coefficient curves for the 28 MyCAFs-related DEGs. (D) Model constructed using the largest λ value (λ = 13) of the mean square error within the standard error. LASSO least absolute shrinkage, and selection operator, TCGA The Cancer Genome Atlas, LUAD lung adenocarcinoma, MyCAFs myofibroblastic cancer-associated fibroblasts, DEGs differentially expressed genes. P < 0.05 denotes statistically significant differences.
Fig. 6
Fig. 6
Assessment and validation of the prognostic Model. (A) Training set divided into high- and low-risk groups based on the median risk score. (B) Distribution of survival and death for patients in the training set with different risk scores. (C) Kaplan–Meier survival curve in the training set showing a poorer prognosis for patients in the high-risk group (P = 3.373e−05). (D) TimeROC analysis results for the training set at 1 (AUC = 0.715), 2 (AUC = 0.691), and 3 (AUC = 0.691) years. (E) Risk scores in terms of age, sex, and pathologic status obtained via multivariate COX regression analysis. Our model had an independent prognostic power (HR = 4.485; 95% CI [2.858, 7.040], P < 0.001). (F) Kaplan–Meier survival curve for the validation set showing a worse prognosis for the high-risk group (P = 2.612e−02) than for the low-risk group. (G) TimeROC analysis results for the validation set at 1 (AUC = 0.731), 2 (AUC = 0.792), and 3 (AUC = 0.726) years. ROC receiver operating characteristic, AUC area under the curve, HR hazard ratio, CI confidence interval. P < 0.05 is statistically significant.
Fig. 7
Fig. 7
TMB and PPI analyses. (A) Waterfall plot of the somatic mutation landscape for the patients in the high-risk group. (B) TMB status for patients in the high-risk group (median TMB = 3.65 mut/MB). (C) TMB status for patients in the low-risk group (median TMB = 2.92 mut/MB). (D) Waterfall plot of the somatic mutation landscape of patients in the low-risk group. (E) PPI network map. (F) PPI network map based on BC parameters. TMB tumor mutation burden, PPI the protein–protein interaction; mut/MB, number of mutations/exon Mb length detected, BC betweenness. P < 0.05 denotes statistically significant differences.
Fig. 8
Fig. 8
POSTN expression in LUAD. (A) qPCR results showing that POSTN was highly expressed in LUAD cell lines (A549, H1299, SPC-A1, H1650). ****P < 0.0001. (B) Western blot analysis showing high POSTN expression levels in LUAD cell lines. ****P < 0.0001. (C) Screening to identify the effective Si-RNA in A549 cells. ****P < 0.0001. (D) Screening to identify the effective Si-RNA in H1299 cells. *****P < 0.0001.
Fig. 9
Fig. 9
Effect of POSTN expression on LUAD cell proliferation. (A) Western blot analysis results showing that POSTN knockdown in A549 cells lowered KI-67 and PCNA expression. ****P < 0.0001. (B) Western blot analysis showing that POSTN knockdown lowered KI-67 and PCNA expression in H1299 cells. ***P < 0.001,****P < 0.0001. (C) CCK8 assay results showing that POSNT knockdown resulted in a significant decrease in A549 cell counts at 24, 48, and 72 h. **P < 0.01, ***P < 0.001, ****P < 0.0001. (D) CCK8 assay results showing that POSTN knockdown resulted in a significant decrease in H1299 cell counts at 72 h. *P < 0.05.
Fig. 10
Fig. 10
Effect of POSTN expression on cells migration and invasion in LUAD. (A) Wound healing assay results showing that POSTN knockdown reduced A549 cell migration. ***P < 0.001. (B) Wound healing assay results showing that POSTN knockdown reduced H1299 cell migration. **P < 0.01. (C) Transwell assay results showing that POSTN knockdown reduced A549 cell migration and invasion. *P < 0.05, **P < 0.01. (D) Transwell assay results showing that POSTN knockdown reduced H1299 cell migration and invasion. *P < 0.05, **P < 0.01.

Similar articles

References

    1. Imielinski, M. et al. Mapping the hallmarks of lung adenocarcinoma with massively parallel sequencing. Cell150(6), 1107–1120. 10.1016/j.cell.2012.08.029 (2012). - PMC - PubMed
    1. UyBico, S. J. et al. Lung cancer staging essentials: The new TNM staging system and potential imaging pitfalls. Radiographics30(5), 1163–1181. 10.1148/rg.305095166 (2010). - PubMed
    1. Thai, A. A., Solomon, B. J., Sequist, L. V., Gainor, J. F. & Heist, R. S. Lung cancer. Lancet398(10299), 535–554. 10.1016/S0140-6736(21)00312-3 (2021). - PubMed
    1. Chen, Z., Fillmore, C. M., Hammerman, P. S., Kim, C. F. & Wong, K. K. Non-small-cell lung cancers: A heterogeneous set of diseases. Nat. Rev. Cancer14(8), 535–546. 10.1038/nrc3775 (2014). - PMC - PubMed
    1. Barta, J. A., Powell, C. A. & Wisnivesky, J. P. Global epidemiology of lung cancer. Ann. Glob. Health85(1), 8. 10.5334/aogh.2419 (2019). - PMC - PubMed

Substances