. 2025 Jul 2;15(1):22603.
doi: 10.1038/s41598-025-06500-0.

Associations between weight gain, integrase inhibitors antiretroviral agents, and gut microbiome in people living with HIV: a cross-sectional study

Affiliations

Associations between weight gain, integrase inhibitors antiretroviral agents, and gut microbiome in people living with HIV: a cross-sectional study

Julien De Greef et al. Sci Rep. .

Abstract

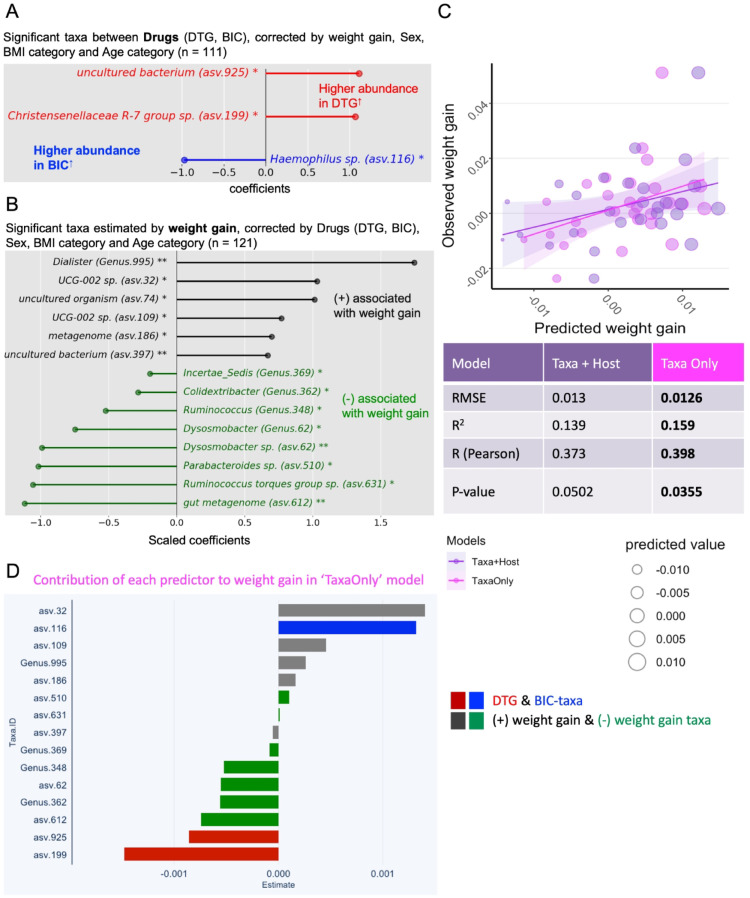
Dolutegravir and bictegravir are second-generation HIV integrase strand transfer inhibitors (INSTIs) that were previously associated with abnormal weight gain. This monocentric cross-sectional study investigates associations between weight gain during the first year after initiation of dolutegravir, bictegravir or other anchor drugs and gut microbiome diversity as well as taxa composition. The study enrolled 79 participants receiving dolutegravir, 32 receiving bictegravir and 10 receiving non-INSTI based regimens. Most of them were treatment experienced at initiation of those anchor drugs agents. Although weight gain was not linked to overall bacterial diversity, strong associations with specific taxa were demonstrated (FDR q < 0.01). Using multiple linear regression, we identified 4 distinct groups of bacteria associated with either dolutegravir, bictegravir, weight loss or weight gain under treatment, allowing a machine learning model to predict 15.9% of the weight gain variability regardless of sex, age and body mass index (RMSE: 0.0126). Dysosmobacter sp. and Haemophilus sp., two bacteria previously associated with host metabolism, were among the strongest predictors. Our findings link INSTIs, weight gain, and the gut microbiome. Future research should investigate the causal role of the identified taxa to improve our understanding of microbiome-drug interactions and further support personalized antiretroviral strategies.Trial registration: Eudra-CT 2020-001103-17 (registration date: 2020-12-01).

Trial registration: ClinicalTrials.gov NCT04805944.

Keywords: Dysosmobacter welbionis; Bictegravir; Dolutegravir; Microbiota; Tenofovir alafenamide; Weight gain.


Conflict of interest statement

Declarations. Ethics approval and consent to participate: The study received approval by the local Ethical committee (Comité d’éthique Hospitalo-facultaire from Cliniques universitaires Saint-Luc-UCLouvain; 2020/30NOV/593) and regulatory authorities (Eudra-CT Number 2020-001103-17). All participants gave written informed consent before taking part in the study. All methods were performed in accordance with the relevant guidelines and regulations. Clinical trial: The trial is registered with ClinicalTrials.gov, NCT04805944 (registration date 2021–03-16). Competing interests: PDC is inventor on patent applications dealing with the use of specific bacteria and components in the treatment of different diseases. PDC was co-founder of The Akkermansia Company SA and Enterosys. The other authors declare no competing interests.

Figures

Fig. 1
Fig. 1
Description of the study design and participants enrollment flowchart.
Fig. 2
Fig. 2
Exploring the relationship between weight gain, microbiome, treatments and host characteristics: Sex, Age, and BMI. (A) Multiple linear regressions were performed to determine the association between weight gain, microbiome (beta-diversity: Pco1 & Pco2), drugs (DTG, BIC, Other) Sex, BMI category (normal, overweight, obese), Age category (old > median, young ≤ median; median = 51 years old). A volcano plot visualizes all predictors based on their adjusted p-value (-log10) and coefficients. Significant threshold is adjusted p-value < 0.05. (B) Significant results from volcano plot are further illustrated in the violin plot (weight gain in different treatments) and density plots. Pco1 & Pco2 in Bray–Curtis distance were used to represent the variability of microbiome. Difference between male & female in only Pco1 are presented in density plots. (C) Principal coordinate analyses of all samples (n = 121) based on Bray–Curtis distance metrics (Pco1 & Pco2) showing different clusters of bacteria regardless of treatment groups. Male and female samples are different in shape while color gradients represent the continuous data of log2 ratios of Akkermansia/Prevotella, Firmicutes/Bacteroidota, Bacteroides/Prevotella respectively. Spearman’s correlation (Rs) heatmap between host’s characteristics (BMI, CD4 + T-cell count, age, weight gain), bacterial diversities (Pco1, Pco2, alpha diversity indices: Phylo.diver, InvSimpson, Observed ASV, Shannon) and diversity associated-bacterial ratios.
Fig. 3
Fig. 3
Interactions between Integrase Strand Transfer Inhibitors-associated weight gain and specific taxa of gut microbiome. Lollipop plots of significant taxa and their coefficient (A) or scaled coefficient (B) obtained from multiple-linear regression models in which confounders (sex, BMI and age categories) were controlled. Ten subjects taking “other” drugs than DTG or BIC were excluded in the analysis resulting the sample size of 111 in (A). (C) a scatter plot of linear regression between predicted weight gain and its actual observed value. Purple and pink colors represent 2 different prediction linear models: (1) Taxa only model includes all taxa found in lollipop plots (A & B) excluded asv.74 and genus.62 because of muti-colinearity; (2) Taxa + Host model includes all taxa in the first model and host’s characteristics (sex, BMI and age categories). RMSE and the R2 estimated for each model are provided. Pearson’s correlation between the observed and predicted value for each model are calculated (N = 28). (D) Illustrating the contributing effect of each taxa in predicting weight gain (supporting information for Fig. 2D). Estimates (effect size) obtained from trained model with 93 samples (~ 75%). Different colors present the groups of different taxa.
Fig. 4
Fig. 4
A chord diagram illustrating the proposed relationship between weight-gain associated taxa and each predictor by their coefficient obtained from LASSO. The arrows distinguish a dependent variable (end-point) from their predictors. Larger width of the arrow represents a larger effect of the predictor on the dependent variable. With or without a slate blue border distinguishes positive and negative coefficient of the predictor, respectively. One dependent variable is explained by a set of best predictors selected by LASSO. There are 3 main groups/sectors of predictors: (1) Host (weight gain, sex: Male, BMI: overweight/obese, Age: young), (2) Taxa with higher abundance in dolutegravir treatment group compared to bictegravir treatment group (Red group: asv.199; asv.925), (3) Taxa with higher abundance in bictegravir treatment group compared to dolutegravir treatment group (Blue group: asv.116). There are 2 main groups/sectors of dependent variables: (1) positively weight gain-associated taxa (palegreen group: asv.62: Dysosmobacter sp.; asv.612: gut metagenome; genus.362: Colidextribacter; genus.348: Ruminococcus), (2) negatively weight gain-associated taxa (black group: genus.995: Dialister; asv.32: UGC-002 sp.; asv.109: UGC-002 sp.; asv.186: metagenome sp.). Only taxa with coefficient larger than 10% of the largest absolute value of coefficient in the linear prediction model will be visualised (S2-C). Abbreviations: ASV, amplicon sequence variant; BIC, bictegravir; DTG, dolutegravir; LASSO, least absolute shrinkage and selection operator; BMI, body mass index.

References

    1. Ambrosioni, J. et al. Major revision version 12.0 of the European AIDS Clinical Society guidelines 2023. HIV Med.24(11), 1126–1136 (2023). - PubMed
    1. WHO. Consolidated guidelines on HIV prevention, testing, treatment, service delivery and monitoring: recommendations for a public health approach 2021. Available from: https://www.who.int/publications/i/item/9789240031593 - PubMed
    1. Hill, A., Waters, L. & Pozniak, A. Are new antiretroviral treatments increasing the risks of clinical obesity?. J. Virus Erad.5(1), 41–43 (2019). - PMC - PubMed
    1. Kanters, S. et al. Evidence synthesis evaluating body weight gain among people treating HIV with antiretroviral therapy—A systematic literature review and network meta-analysis. EClinicalMedicine48, 101412 (2022). - PMC - PubMed
    1. Sax, P. E. et al. Weight gain following initiation of antiretroviral therapy: Risk factors in randomized comparative clinical trials. Clin. Infect. Dis.71(6), 1379–1389 (2020). - PMC - PubMed

MeSH terms

Associated data