. 2025 Jul 1;15(1):21951.
doi: 10.1038/s41598-025-05346-w.

Unveiling the mechanisms and promising molecular targets of curcumin in pancreatic cancer through multi-dimensional data

Affiliations

Unveiling the mechanisms and promising molecular targets of curcumin in pancreatic cancer through multi-dimensional data

HongMing Xie et al. Sci Rep. .

Abstract

Pancreatic cancer (PC) is a highly aggressive and fatal malignancy, primarily affecting older males. Curcumin, a potential anti-cancer agent, has been shown to regulate key molecules in cancer progression, but its specific mechanisms in PC remain unclear. We conducted a comprehensive database search to identify curcumin-related targets in PC. Gene expression and immune correlations were analyzed using the GEO database, identifying differentially expressed hub genes (DEHGs). A method involving machine learning was employed to identify feature genes and create a nomogram, using external datasets and molecular docking for preliminary validation. Consensus clustering and subgroup comparisons were also performed based on DEHGs expression. We identified 35 DEHGs strongly associated with immune cell infiltration. Five feature genes (VIM, CTNNB1, CASP9, AREG, HIF1A) were used to build a nomogram, with the classification model showing AUC values above 0.9 in both training and validation groups. Molecular docking highlighted potential binding sites of five feature genes for curcumin. Clustering analysis categorized PC samples into four distinct subgroups: C1 and CII, which showed high expression and elevated immune cell infiltration, and C2 and CI, which exhibited the opposite pattern. Significant variations in scores of DEHG were seen between C1 and C2, in addition to between CI and CII. Curcumin may target DEHGs to influence PC, regulating immune and tumor proliferation mechanisms. These outcomes provide potential insights for medical applications and upcoming research.

Keywords: Curcumin; Machine learning; Network pharmacology; Nomogram; Pancreatic cancer.


Conflict of interest statement

Declarations. Competing interests: The authors declare no competing interests.

Figures

Fig. 1
Fig. 1
The flowchart of this study.
Fig. 2
Fig. 2
Target Analysis of Curcumin and PC. (A) Venn diagram of Curcumin targets obtained from five databases. (B) Venn diagram targets connected with PC retrieved from the GeneCards, PharmGKB, and OMIM databases. (C) Overlap of identified target genes between Curcumin and PC. (D) PPI network from STRING database visualized in Cytoscape 3.8.0. The color intensity of each node reflects its degree value: the deeper blue the color, the higher the degree; the lighter the color, the lower the degree (E) The C1 network cluster with more than 10 nodes identified through MCODE clustering. (F) The C2 network cluster with more than 10 nodes determined through MCODE clustering.
Fig. 3
Fig. 3
Expression and Correlation Heatmap of Key Hub Genes. (A) Boxplot displaying the differential key genes expression between control and PC tissues. Red represents control samples, and blue represents PC tissues. ***p < 0.001, **p < 0.01, *p < 0.05. (B) Heatmap depicting the expression profiles of significantly differentially expressed genes in control vs. PC specimens. The color gradient from red to blue represents high to low expression levels. (C) Chromosomal distribution of the differentially expressed genes (DEGs). Each bar indicates the number and position of DEGs mapped to specific chromosomal regions, providing a genomic overview of their spatial organization. (D) Chord diagram displaying pairwise correlations among selected DEGs. The color of the connecting ribbons represents the direction and strength of correlation: red indicates strong positive correlation (approaching + 1), and green indicates strong negative correlation (approaching − 1). (E) Gene-gene correlation heatmap, with red representing strong positive correlations and blue showing negative associations.
Fig. 4
Fig. 4
Correlation of Immune Cell Infiltration and DEHBs. (A) Bar plot showing the relative abundance of immune cell kinds in control and PC tissues. The x-axis represents the sample groups (control vs. PC), and the y-axis shows the relative percentage of each immune cell type, with different colors indicating various immune cell populations. (B) Box plot showing the proportions of immunity cell types in control and PC tissues. Red represents control samples, and blue represents PC samples. **p < 0.001, **p < 0.01, *p < 0.05. (C) Heatmap illustrating the correlations between immune cell types and DEHBs. The color gradient indicates correlation values (red for positive correlation, blue for negative correlation). ***p < 0.001, **p < 0.01, *p < 0.05.
Fig. 5
Fig. 5
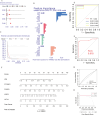
Performance and Feature Importance of PC Prediction Models. (A) Boxplots of residuals for RF, SVM, XGB, and GLM models in the training cohorts, with lower residuals indicating better performance. (B) Feature importance analysis of the models in the training cohort (GSE62165), highlighting the key genes contributing to predictive accuracy. (C) Cumulative distribution of residuals for each model, with steeper curves indicating better performance. (D) ROC curves for the four models in the training cohort. (E) ROC curves in the validation cohort for SVM models. (F) Nomogram predicting disease risk based on molecular markers VIM, CTNNB1, CASP9, AREG, and HIF1 A. Each marker contributes a corresponding score, and the total score correlates with overall disease risk. (G) Calibration curve comparing predicted probabilities to actual outcomes. (H) Decision curve analysis assessing the medical utility of the nomogram model, showing higher net benefit across threshold probabilities compared to no model.
Fig. 6
Fig. 6
The molecular docking models of curcumin with the five molecular markers. (A) CTNNB1. (B) HIF1 A. (C) AREG. (D) VIM. (E) CASP9. (I) Cartoon representations showing the superimposed structures of curcumin and the corresponding protein targets. (II) Three-dimensional visualization of the binding pockets generated using Discovery Studio. Non-bonded interactions between receptor and ligand atoms are depicted as dashed lines in various colors. Bold lines highlight the ligand and receptor residues directly involved in binding, while lighter lines indicate surrounding residues forming the pocket. (III) Hydrogen bond interaction models: receptor residues acting as hydrogen bond donors are shown beneath pink surfaces, while acceptors are shown beneath cyan surfaces. (IV) Hydrophobic interaction models: the color gradient ranges from brown (indicating highly hydrophobic regions) to blue (indicating less hydrophobic regions). Green labels indicate amino acid three-letter codes and corresponding residue IDs.
Fig. 7
Fig. 7
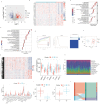
Analysis of Two Molecular Subtypes of PC Samples. (A) Consensus cumulative distribution function (CDF) curves and delta area plot, with a consensus heatmap identifying two distinct subtypes (C1 and C2). (B) PCA plot demonstrating sample distribution across the two subtypes. (C) Heatmap of differential gene expression, where red shows high expression and blue shows low expression. (D) Boxplots showing the expression of DEHGs in the two subtypes, with red for C1 and blue for C2. (E, F) GSVA results display the GO biological processes (E) and KEGG pathways (F) enriched in each subtype. Red bars represent processes enriched in C2, while blue bars represent those enriched in C1. (G) Immune cell infiltration landscape for the two subtypes. (H) Boxplots illustrating the proportion of different immunity cell types between C1 and C2.
Fig. 8
Fig. 8
Analysis of Molecular Characteristics and Immune Microenvironment of DEHGs Subtypes. (A) Volcano plot displaying differentially expressed genes between the two subtypes, with red representing upregulated genes and blue representing downregulated genes. (B) Heatmap of gene expression, demonstrating clustering of samples into two distinct subtypes. (C) GO enrichment analysis of biological processes involved in each subtype. (D) Top 20 enriched pathways between the subtypes, showing significant involvement of immune and metabolic pathways. (E) Consensus clustering CDF curve and delta area plot, identifying the optimal number of clusters (K = 2). (F) PCA plot displaying the separation between the two subtypes. (G) Expression patterns of DEGs and DEHGs in clusters CI and CII. (H) Box plot showing differential expression analysis of DEHG scores between DEG clusters. (I) Box plot displaying differential expression analysis of DEHG scores between DEHG clusters. (J) Alluvial diagram illustrating the correspondence between different sample clusters.

Similar articles

References

    1. Collisson, E. A., Bailey, P., Chang, D. K. & Biankin, A. V. Molecular subtypes of pancreatic cancer. Nat. Rev. Gastroenterol. Hepatol.16(4), 207–220. 10.1038/s41575-019-0109-y (2019). - PubMed
    1. Sung, H. et al. Global Cancer statistics 2020: GLOBOCAN estimates of incidence and mortality worldwide for 36 cancers in 185 countries. CA Cancer J. Clin.71(3), 209–249. 10.3322/caac.21660 (2021). - PubMed
    1. Park, W., Chawla, A. & O’Reilly, E. M. Pancreatic cancer: A review. JAMA326(9), 851–862. 10.1001/jama.2021.13027 (2021). - PMC - PubMed
    1. Aggarwal, B. B., Sundaram, C., Malani, N. & Ichikawa, H. Curcumin: the Indian solid gold. Adv. Exp. Med. Biol.595, 1–75. 10.1007/978-0-387-46401-5_1 (2007). - PubMed
    1. Strimpakos, A. S. & Sharma, R. A. Curcumin: preventive and therapeutic properties in laboratory studies and clinical trials. Antioxid. Redox Signal.10(3), 511–545. 10.1089/ars.2007.1769 (2008). - PubMed

MeSH terms