. 2025 Jul 1;15(1):21758.
doi: 10.1038/s41598-025-06730-2.

Evaluating the distribution and clustering of SARS-CoV-2 antibodies in dogs across the United States of America

Affiliations

Evaluating the distribution and clustering of SARS-CoV-2 antibodies in dogs across the United States of America

Chi Chen et al. Sci Rep. .

Abstract

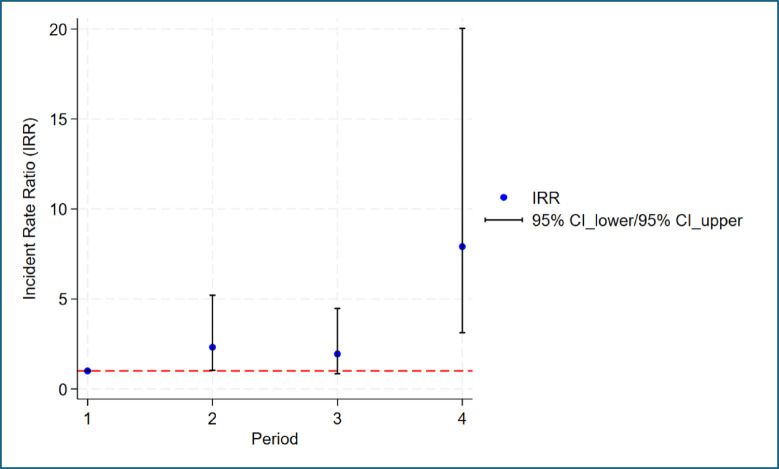
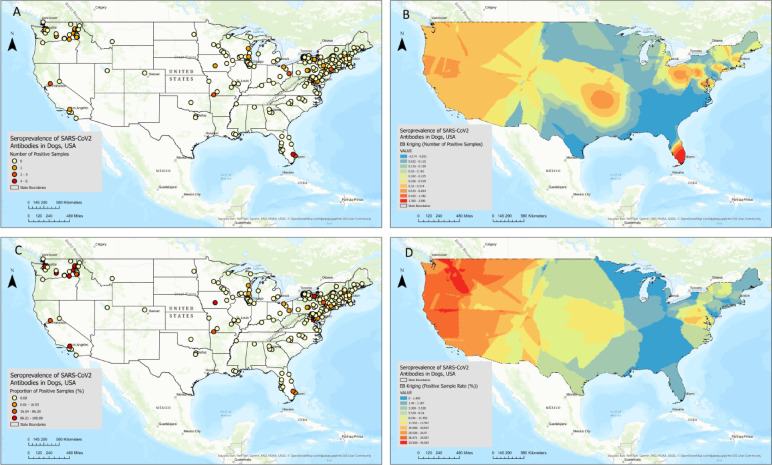
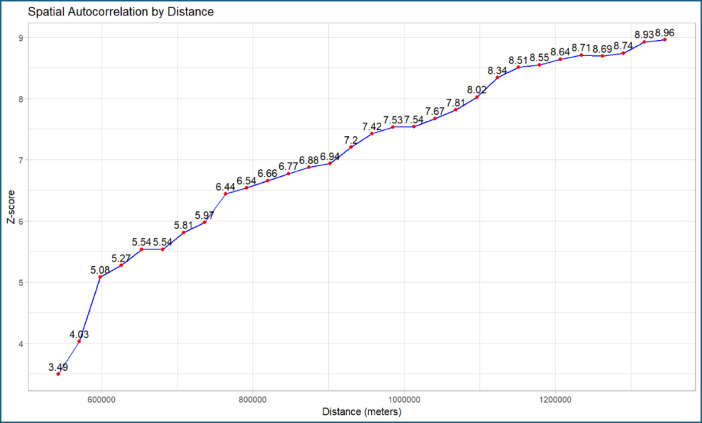
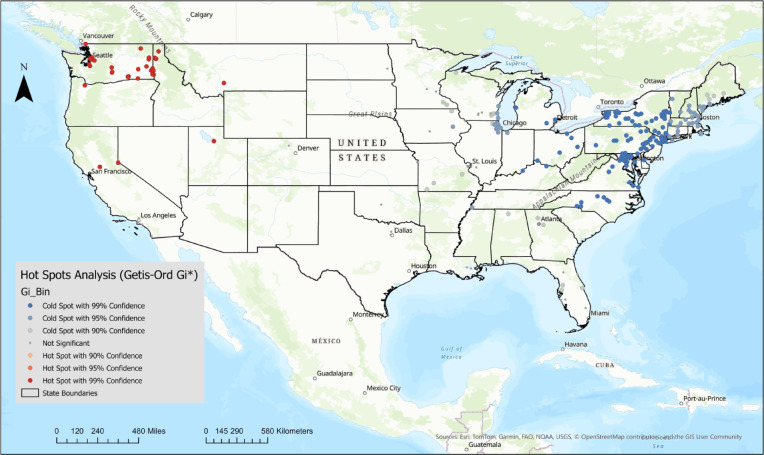
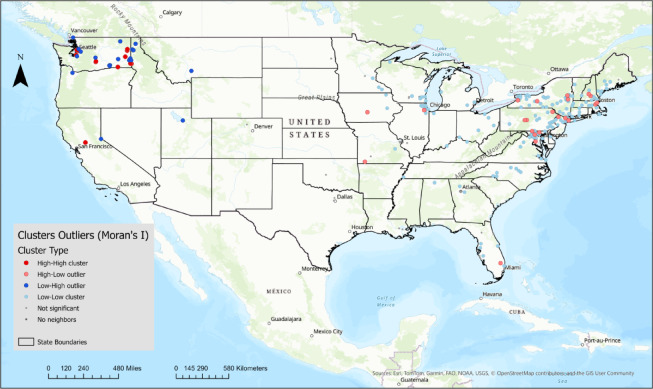
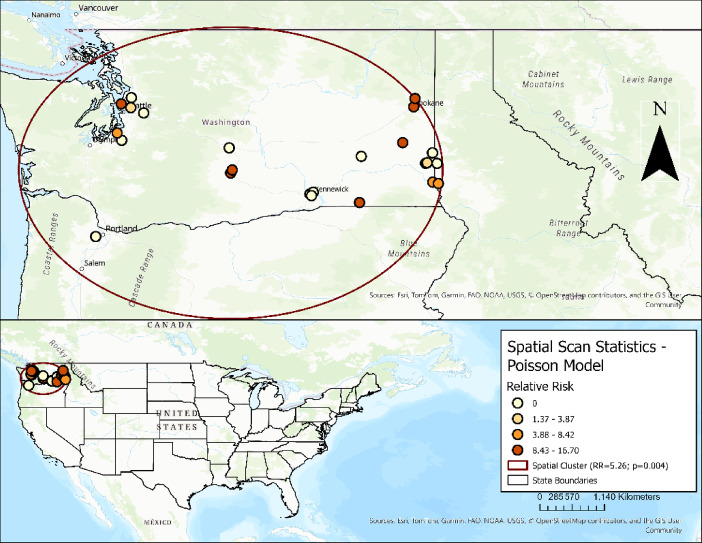
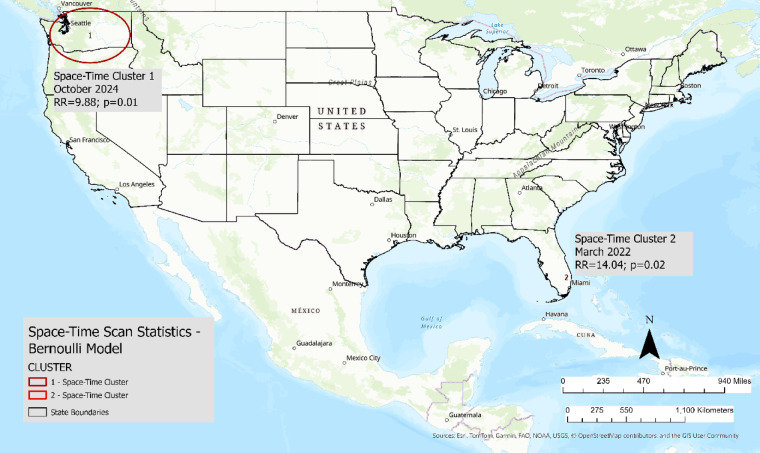
SARS-CoV-2 has been detected in various animal species, including dogs. While human-to-animal transmission has been documented, the extent and distribution of SARS-CoV-2 exposure in dogs across the United States of America (USA) remain unclear. To address this need, we investigated the seroprevalence of SARS-CoV-2 antibodies in dogs in the USA and scanned for spatial and temporal clusters of high seroprevalence. Serum samples from 953 dogs from 37 states were screened by serological assays, and 58 (6.09%) samples tested positive for SARS-CoV-2 antibodies. The lowest seropositivity was detected in the third quarter of 2021 (1.16%), while the highest was in the third and fourth quarters of 2024 (23.26%). Maps visualized the distribution of seroprevalence, and the Pacific Northwest and Florida had high seroprevalence, while the Northeast and Midwest USA had low seroprevalence. Two significant space-time clusters were identified. The primary cluster in areas in the state of Washington in October 2024, and the secondary cluster in Florida in March 2022. These findings highlight the importance of surveillance to understand SARS-CoV-2 epidemiology in companion animals and its implications for public health.

Keywords: Clustering; Dogs; SARS-CoV-2; Seroepidemiologic studies.


Conflict of interest statement

Competing interest: The authors declare no competing interests.

Figures

Fig. 1
Fig. 1
Variation in SARS-CoV-2 seropositivity among household dogs in the USA across sampling periods. The incidence rate ratio (IRR) of SARS-CoV-2 seropositive cases was estimated using the Poisson regression model, with Period 1 as the reference category. Error bars in each period represent 95% confidence intervals (CIs). An IRR > 1 represents an increase, and an IRR < 1 represents a decrease in the IRR compared to the first period.
Fig. 2
Fig. 2
Distribution of SARS-CoV-2 seropositive household dogs across the USA. Point maps illustrate the distribution of the number of seropositive cases (A) and seropositivity rates (C) by city. The darker color represents a higher seropositive case number or rate. Isopleth maps illustrate the spatially interpolated distribution of the number of seropositive cases (B) and seropositivity rates (D) across the USA by using the Empirical Bayesian kriging method. ArcGIS Pro version 3.4 (Environmental Systems Research Institute, Inc. (ESRI), Redlands, CA, USA) software was used to construct the map and perform the spatial interpolation.
Fig. 3
Fig. 3
Incremental Spatial Autocorrelation Analysis of SARS-CoV-2 antibody seropositivity in household dogs. Thirty incremental distances were included in the analysis. The distance bands were established according to the average nearest-neighbor distance among locations. Z-scores represent the intensity of spatial clustering of cases. The higher values of Z-scores represent stronger autocorrelation. The maximum peak Z-score was observed at 123.4 km, showing the optimal distance at which clustering effects are most significant. The fixed distance band conceptualization parameter was used. Statistically significant clustering at p ≤ 0.05.
Fig. 4
Fig. 4
Hot spot analysis of the seroprevalence of SARS-CoV-2 antibodies in household dogs. The Getis-Ord Gi* statistic was applied to identify statistically significant local clusters of SARS-CoV-2 antibody seroprevalence in household dogs. Hot spots (red-colored locations) are locations where dogs exhibit high SARS-CoV-2 antibody seroprevalence, surrounded by neighboring areas with similarly high seroprevalence. Conversely, cold spots (blue-colored locations) are locations of low seroprevalence and are surrounded by areas with comparably low seroprevalence. The distance band of 123.4 km and the zone of indifference conceptualization of spatial relationship parameters were used to identify spatial clustering at p ≤ 0.05. ArcGIS Pro version 3.4 (Environmental Systems Research Institute, Inc. (ESRI), Redlands, CA, USA) software was used to conduct the hot-spot analysis and illustrate the results on the map.
Fig. 5
Fig. 5
Cluster and outlier analysis (Local Moran’s I) of SARS-CoV-2 antibody seroprevalence in household dogs across the USA. High-high clusters (dark red colored locations) were areas with high seroprevalence surrounded by similarly high-seroprevalence areas. Low-low clusters (light blue colored locations) represent locations with low seroprevalence surrounded by other low-prevalence areas. High-low outliers (light red colored locations) were high-seroprevalence areas surrounded by low-seroprevalence areas. Low–high outliers (dark blue colored locations) represented low-seroprevalence areas adjacent to high-seroprevalence locations. The Euclidean distance band of 123.4 km was used to define the distance around the target areas, and the zone of indifference was used as the conceptualization of spatial relationships. Statistical significance was determined at p ≤ 0.05. ArcGIS Pro version 3.4 (Environmental Systems Research Institute, Inc. (ESRI), Redlands, CA, USA) software was used to conduct the cluster and outlier analysis and illustrate the results on the map.
Fig. 6
Fig. 6
Spatial clustering of high SARS-CoV-2 antibody seroprevalence in household dogs across the USA. The Poisson model was used with a circular scanning window that included 5% of the population at risk. 999 Monte Carlo permutations and likelihood ratios assessed statistical significance (p < 0.05). The red circle represents the spatial extent of the cluster. Location within the cluster and their relative risks (RR) are illustrated as choropleth points using the ArcGIS Pro version 3.4 (Environmental Systems Research Institute, Inc. (ESRI), Redlands, CA, USA) software.
Fig. 7
Fig. 7
Space–time clustering of SARS-CoV-2 antibody seroprevalence in household dogs across the USA The Bernoulli model was used with a circular scanning window that included 5% of the population at risk and 5% of the study period. 999 Monte Carlo permutations and likelihood ratios assessed statistical significance (p < 0.05). The circles represent the locations of the identified space–time clusters. ArcGIS Pro version 3.4 (Environmental Systems Research Institute, Inc. (ESRI), Redlands, CA, USA) software was used to illustrate the results of the space–time scan statistics.

Similar articles

References

    1. Lu, R. et al. Genomic characterisation and epidemiology of 2019 novel coronavirus: Implications for virus origins and receptor binding. The Lancet395, 565–574 (2020). - PMC - PubMed
    1. Hu, B., Guo, H., Zhou, P. & Shi, Z.-L. Characteristics of SARS-CoV-2 and COVID-19. Nat. Rev. Microbiol.19, 141–154 (2021). - PMC - PubMed
    1. Hasöksüz, M., Kilic, S. & Saraç, F. Coronaviruses and sars-cov-2. Turkish J. Med. Sci.50, 549–556 (2020). - PMC - PubMed
    1. Wu, F. et al. A new coronavirus associated with human respiratory disease in China. Nature579, 265–269. 10.1038/s41586-020-2008-3 (2020). - PMC - PubMed
    1. Mahdy, M. A., Younis, W. & Ewaida, Z. An overview of SARS-CoV-2 and animal infection. Front. Vet. Sci.7, 596391 (2020). - PMC - PubMed

Substances