

Different prefrontal cortex activity patterns in bipolar and unipolar depression during verbal fluency tasks based on functional near infrared spectroscopy study
- PMID: 40593067
- PMCID: PMC12218532
- DOI: 10.1038/s41598-025-05896-z
Different prefrontal cortex activity patterns in bipolar and unipolar depression during verbal fluency tasks based on functional near infrared spectroscopy study
Abstract
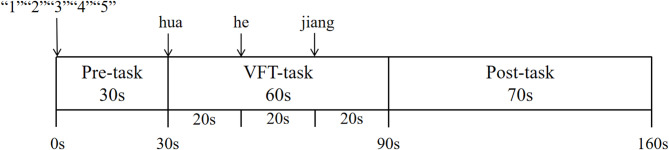
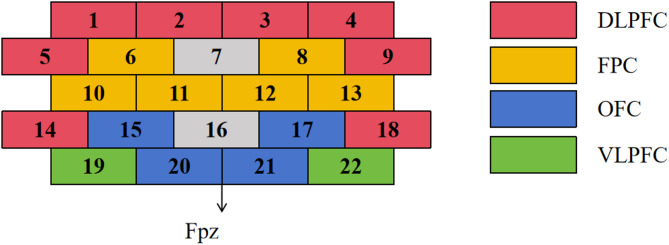
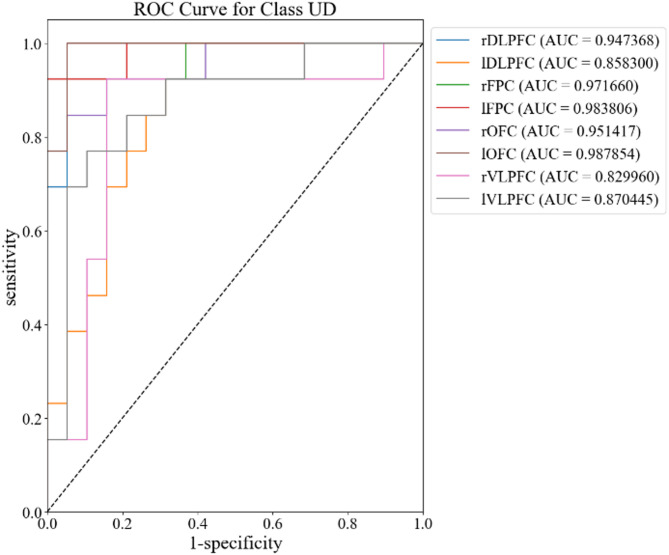
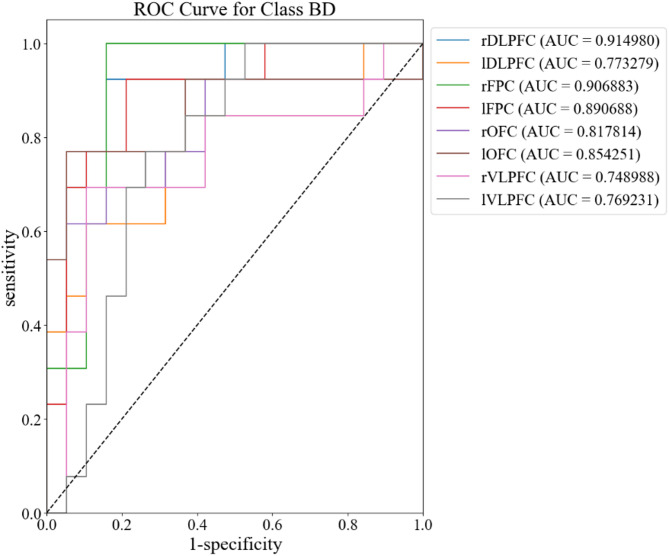
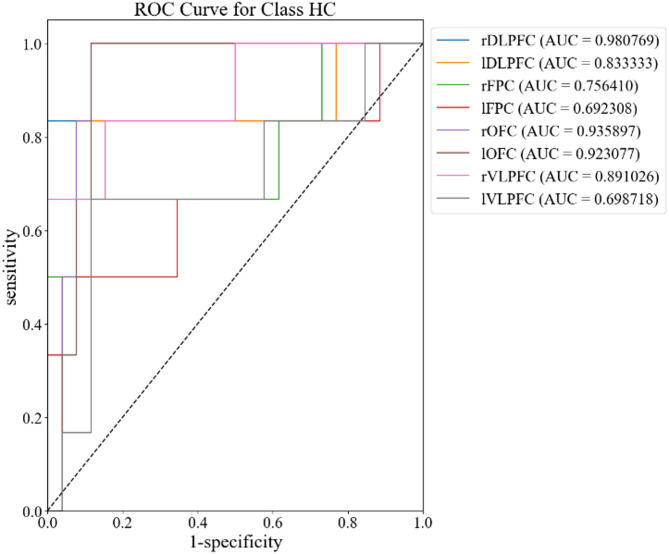
This study aimed to investigate the functionality of the prefrontal cortex in patients with unipolar depression (UD) and bipolar depression (BD) using functional near-infrared spectroscopy (fNIRS) during a verbal fluency task (VFT). Additionally, it evaluated the reliability of fNIRS as a diagnostic tool for cognitive assessments through a deep learning approach using one-dimensional convolutional networks. The study included 73 patients with UD, 59 patients with BD, and 40 healthy controls (HC). Hemodynamic responses in the prefrontal cortex were recorded using fNIRS during the VFT. Differences in oxygenated hemoglobin concentrations across the three groups were compared, and receiver operating characteristic (ROC) curves were generated for each region of interest. Both UD and BD patients demonstrated significantly reduced activation in the prefrontal cortex compared to healthy controls. UD patients showed notably lower activation values than BD patients in the dorsolateral prefrontal cortex, frontopolar prefrontal cortex, left orbitofrontal cortex, and left ventrolateral prefrontal cortex. The highest classification accuracy (79.57%) was observed in the left orbitofrontal cortex. The UD group had the largest area under the ROC curve (AUC = 0.99) in the left orbitofrontal cortex, while the BD group had the largest AUC (0.91) in the right dorsolateral prefrontal cortex. The HC group exhibited the largest AUC (0.73) in the same region. The DLPFC, FPC, lOFC, and lVLPFC may serve as biomarker regions for differentiating UD from BD. The combination of fNIRS and the VFT shows promise as a supplementary diagnostic tool for mental health disorders.
Keywords: Bipolar disorder; FNIRS; Unipolar depression; Verbal fluency task.
© 2025. The Author(s).
Conflict of interest statement
Declarations. Competing interests: The authors declare no competing interests. Ethics statement: This study is conducted in accordance with the latest version of the Declaration of Helsinki and is approved by the Huzhou Third Municipal Hospital Institutional Review Board(the approval number: [2023 − 480]). The patients/participants provided their written informed consent to participate in this study. Written informed consent was obtained from the individual(s) for the publication of any potentially identifiable images or data included in this article.
Figures

References
MeSH terms
Grants and funding
LinkOut - more resources
Full Text Sources
Medical
