. 2025 Jul 1;15(1):22207.
doi: 10.1038/s41598-025-06772-6.

Homocysteine promotes cardiomyocyte hypertrophy through inhibiting β-catenin/ FUNDC1 mediated mitophagy

Affiliations

Homocysteine promotes cardiomyocyte hypertrophy through inhibiting β-catenin/ FUNDC1 mediated mitophagy

Yanping Lei et al. Sci Rep. .

Abstract

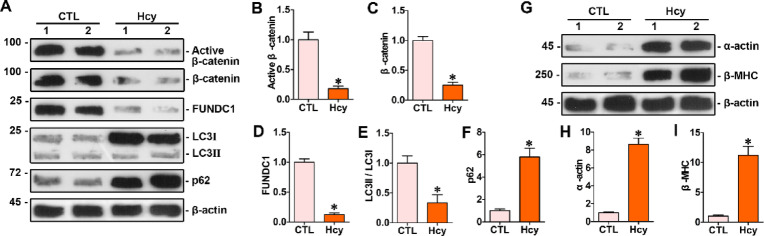
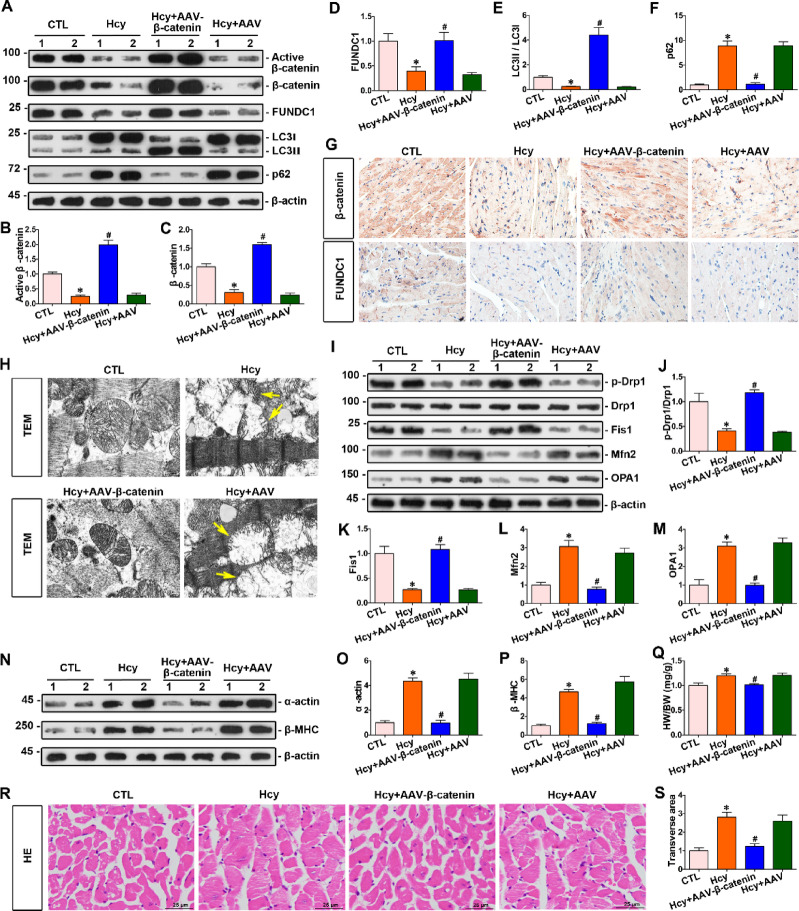
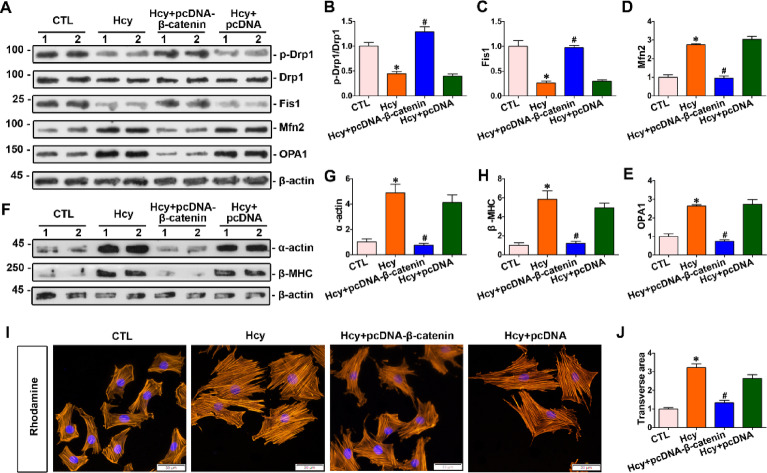
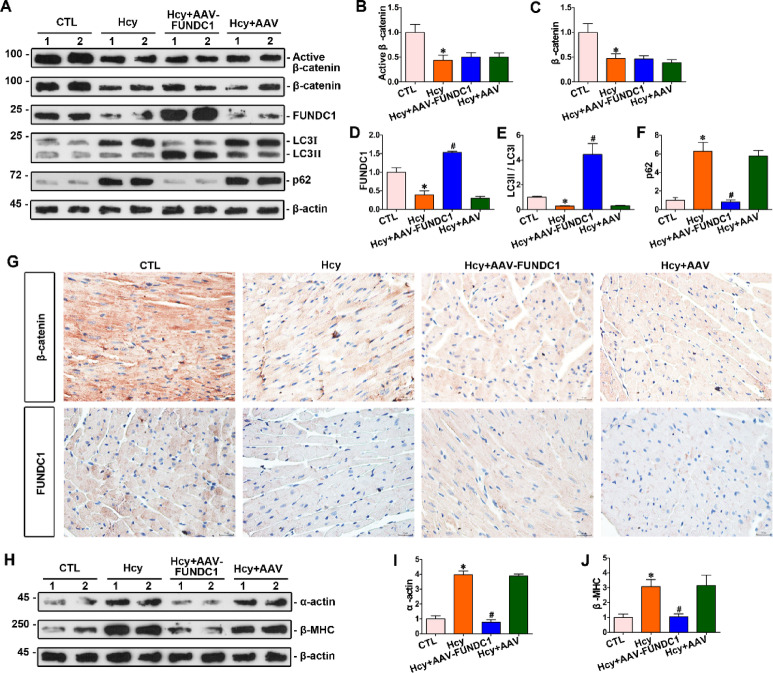
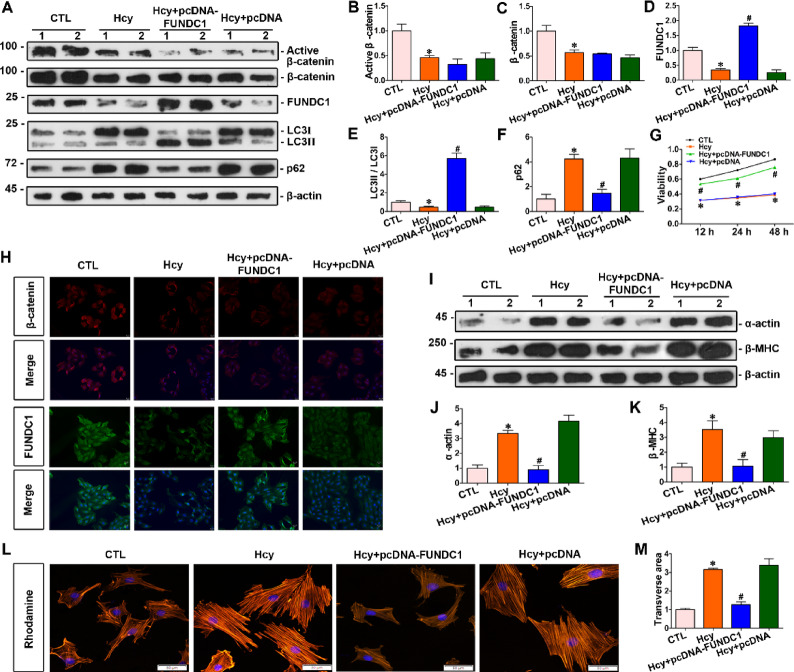
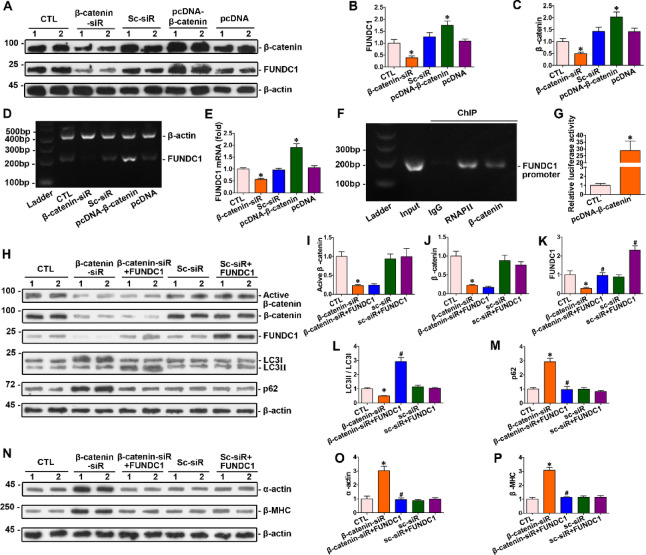
Homocysteine can cause damage to cardiomyocytes. However, Mitophagy is essential for preserving homeostasis in cardiomyocytes. So, we focused on investigating the impact of homocysteine on cardiomyocyte mitophagy and cardiac hypertrophy through the β-catenin/FUNDC1 pathway. Mice were administered water containing homocysteine (1.8 g/L) to induce hyperhomocysteinemia for 4 weeks. The overexpression of specific genes, including β-catenin and FUNDC1, were performed by gene delivery mediated with adeno-associated virus. In vitro, cardiomyocytes were exposed to homocysteine (1 mmol/L) and then transfected with plasmids to overexpress β-catenin and FUNDC1, respectively. The duration of cell experiments was 48 h. Western blotting was employed to assess the expression levels of β-catenin, active β-catenin, FUNDC1, LC3, p62, α-actin, and β-MHC. Immunohistochemistry and immunofluorescence techniques were applied to measure β-catenin and FUNDC1 in cardiomyocytes. Cell viability was assessed using a CCK-8 assay kit, and mitophagy was observed under transmission electron microscopy. The interaction between β-catenin protein and the promoter of the FUNDC1 gene was examined using ChIP assay and dual-luciferase reporter gene assay. Homocysteine inhibited β-catenin signaling and the FUNDC1-mediated mitophagy in the cardiomyocytes, simultaneously promoting cardiac hypertrophy in vitro and in vivo. Elevated β-catenin signaling promoted FUNDC1 expression, then restored the normal level of mitophagy, and consequently inhibited homocysteine-induced cardiac hypertrophy. Similarly, overexpression of FUNDC1 restored mitophagy and protected cardiomyocytes from hypertrophy. In addition, FUNDC1 served as a target gene of β-catenin. In summary, homocysteine induces cardiomyocyte hypertrophy by inhibiting β-catenin signaling and suppressing FUNDC1-mediated mitophagy.

Keywords: Cardiomyocyte hypertrophy; FUNDC1; Homocysteine; Mitophagy; β-catenin.


Conflict of interest statement

Declarations. Competing interests: The authors declare no competing interests. Ethics approval: This study protocol was reviewed and approved by the Animal Care and Use Committee of University of South China (Ethics approval number: USC2023XS087).

Figures

Fig. 1
Fig. 1
Homocysteine suppressed the expression of β-catenin and mitophagy-related proteins in the myocardium, and induced cardiac hypertrophy. (A) Western blot analyses showed the expressions of protein, including β-catenin, active β-catenin, FUNDC1, LC3II/LC3I, p62 in the hearts of mice subjected to hyperhomocysteinemia for 4 weeks. (BF) Quantitative data on β-catenin, active β-catenin, FUNDC1, LC3II/LC3I, p62 proteins in indicated groups. Relative levels of protein were presented as fold induction over the controls. (G) Western blot analyses showed the expressions of protein including α-actin, β-MHC in the hearts of mice subjected to hyperhomocysteinemia for 4 weeks. (H,I) Quantitative determination of α-actin, β-MHC in (G). *P < 0.05 versus the controls (n = 6).
Fig. 2
Fig. 2
Increased β-catenin level restored the normal level of mitophagy and mitigated cardiac hypertrophy in mice with hyperhomocysteinemia. (A) Western blot analyses showed the expressions of protein, including active β-catenin, β-catenin, FUNDC1, LC3II/LC3I, p62 in the hearts of mice subjected to hyperhomocysteinemia in the presence and absence of AAV-β-catenin infection for 4 weeks. (BF) Quantitative data on active β-catenin, β-catenin, FUNDC1, LC3, p62 proteins in indicated groups. Relative levels of protein were presented as fold induction over the controls. (G) Representative micrographs showed staining for β-catenin and FUNDC1 in the hearts of mice at the end of the 4th week of hyperhomocysteinemia model. Upper panel, immunostaining for β-catenin inthe hearts of mice as indicated; Bottom panel, immunostaining for FUNDC1 in given groups as indicated. Scale bar, 20 μm. (H) Representative transmission electron microscope images showed mitochondrial damage in the hearts of mice in given groups. The yellow arrows indicated injured mitochondria. Scale bar, 300 nm. (I) Western blot analyses showed the expressions of protein, including p-Drp1, Drp-1, Fis1, Mfn2, and OPA1 in indicated groups. (JM) Quantitative determination of p-Drp1, Drp-1, Fis1, Mfn2, and OPA1 in (I). (N) Western blot analyses showed the expressions of protein, including α-actin, β-MHC in indicated groups. (O,P) Quantitative determination of α-actin, β-MHC in (N). (Q) The heart weight of mice in each group was standardized by body weight. (R) Hematoxylin and eosin (H&E) staining of heart sections from the indicated mice revealed the cross-sectional area of the myocytes. (S) Quantitative determination of the cross-sectional area of cardiomyocytes in (R). *P < 0.05 versus the controls; #P < 0.05 versus homocysteine stimulation alone (n = 6).
Fig. 3
Fig. 3
The elevation of β-catenin expression restored the level of mitophagy suppressed by homocysteine in cardiomyocytes. (A) Western blot analyses showed the expressions of protein, including active β-catenin, β-catenin, FUNDC1, LC3II/LC3I, p62 in cardiomyocytes stimulated with homocysteine in the presence and absence of β-catenin overexpression. (BF) Quantitative data on active β-catenin, β-catenin, FUNDC1, LC3II/LC3I, p62 proteins in indicated groups. Relative levels of protein were presented as fold induction over the controls. (G) Representative micrographs showed staining for β-catenin and FUNDC1 in cardiomyocytes. Upper panel, immunostaining for β-catenin in cardiomyocytes as indicated; bottom panel, immunostaining for FUNDC1 in given groups as indicated. Scale bar, 25 μm. (H) Representative transmission electron microscope images showed the mitochondrial damage in cardiomyocytes of indicated groups. The yellow arrows indicated injured mitochondria. Scale bar, 300 nm. (I) The flux of autophagy in neonatal cardiomyocytes was tested by detection of GFP-mRFP-LC3 in cardiomyocytes of given groups. Lower panel presented the magnified image of the area indicated by the box in the merge image. Scale bar, 25 μm. (J) Green and red fluorescent points were counted separately in indicated groups. (K) Cell viability was detected by CCK8 kit in each group as indicated. *P < 0.05 versus the controls; #P < 0.05 versus homocysteine stimulation alone (n = 6).
Fig. 4
Fig. 4
The elevation of β-catenin expression normalized mitochondrial fission and fusion and hindered cardiomyocyte hypertrophy induced by homocysteine. (A) Western blot analyses showed the expressions of protein, including p-Drp1, Drp-1, Fis1, Mfn2, and OPA1 in indicated groups. (B–E) Quantitative determination of p-Drp1, Drp-1, Fis1, Mfn2, and OPA1 in (A). (F) Western blot analyses showed the expressions of protein, including α-actin, β-MHC in indicated groups. (G,H) Quantitative determination of α-actin, β-MHC in (F). (I) Rhodamine staining for cardiomyocytes revealed the cross-sectional area of the cells. (J) Quantitative determination of the cross-sectional area of cardiomyocytes. *P < 0.05 versus the controls; #P < 0.05 versus homocysteine stimulation alone (n = 6).
Fig. 5
Fig. 5
The upregulation of FUNDC1 reestablished the normal level of mitophagy and mitigated myocardium hypertrophy against homocysteine. (A) Western blot analyses showed the expressions of protein, including active β-catenin, β-catenin, FUNDC1, LC3II/LC3I, p62 in the hearts of mice subjected to hyperhomocysteinemia in the presence and absence of AAV-FUNDC1 infection for 4 weeks. (BF) Quantitative data on active β-catenin, β-catenin, FUNDC1, LC3II/LC3I, p62 proteins in indicated groups. Relative levels of protein were presented as fold induction over the controls. (G) Representative micrographs showed staining for β-catenin and FUNDC1 in the hearts of mice at the end of the 4th week of hyperhomocysteinemia model. Upper panel, immunostaining for β-catenin in the hearts of mice as indicated; bottom panel, immunostaining for FUNDC1 in given groups as indicated. Scale bar, 20 μm. (H) Western blot analyses showed the expressions of protein, including α-actin, β-MHC in indicated groups. (I,J) Quantitative determination of α-actin, β-MHC in (H). *P < 0.05 versus the controls; #P < 0.05versus homocysteine stimulation alone (n = 6).
Fig. 6
Fig. 6
The upregulation of FUNDC1 suppressed cardiomyocyte hypertrophy induced by homocysteine. (A) Western blot analyses showed the expressions of protein, including active β-catenin, β-catenin, FUNDC1, LC3II/LC3I, p62 in cardiomyocytes stimulated with homocysteine in the presence and absence of FUNDC1 overexpression. (BF) Quantitative data on active β-catenin, β-catenin, FUNDC1, LC3II/LC3I, p62 proteins in indicated groups. Relative levels of protein were presented as fold induction over the controls. (G) Cell viability was detected by CCK8 kit in each group as indicated. (H) Representative micrographs showed staining for β-catenin and FUNDC1 in cardiomyocytes. Upper panel, immunostaining for β-catenin in cardiomyocytes as indicated; bottom panel, immunostaining for FUNDC1 in given groups as indicated. Scale bar, 25 μm. (I) Western blot analyses showed the expressions of protein, including α-actin, β-MHC in indicated groups. (J,K) Quantitative determination of α-actin, β-MHC in (G). (L) Rhodamine staining for cardiomyocytes revealed the cross-sectional area of the cells. (M) Quantitative determination of the cross-sectional area of cardiomyocytes. *P < 0.05 versus the controls; #P < 0.05 versus homocysteine stimulation alone (n = 6).
Fig. 7
Fig. 7
As a target gene of β-catenin, enhanced FUNDC1 expression counteracted cardiomyocyte hypertrophy induced by downregulated β-catenin signaling. (A) Western blots analysis showed protein levels of β-catenin and FUNDC1 in cardiomyocytes with overexpression and knockdown of β-catenin. (B,C) Quantitative determination of the abundance of specific protein were presented in indicated groups. (D) PCR analysis of FUNDC1 mRNA levels following β-catenin gene overexpression and silencing. (E) Quantitative determination of the abundance of FUNDC1 mRNA levels in (D) were presented. (F) ChIP assay verified that β-catenin bound to the promoter of FUNDC1 gene. (G) Dual luciferase reporter gene assay: both pGL6-TA and pRL-SV40-C were co-transfected into HEK293T cells with pcDNA3.1-β-catenin; both pGL6-TA and pRL-SV40-C were co-transfected into HEK293T cells in the control group. *P < 0.05 versus the controls (n = 6). (H) β-catenin siRNA and FUNDC1 plasmid were co-transfected into H9c2 cells to assess their interaction. Western blotting was used to assess the expression of active β-catenin, β-catenin, FUNDC1, LC3II/LC3I, and p62 in cardiomyocytes from indicated groups. (IM) Quantitative analysis of the levels of active β-catenin, β-catenin, FUNDC1, LC3II/LC3I, and p62 in (H) was performed. (N) Western blot analyses showed the expressions of protein, including α-actin, β-MHC in indicated groups. (O,P) Quantitative determination of α-actin, β-MHC in (N). *P < 0.05 versus the controls; #P < 0.05 versus β-catenin siRNA transfection (n = 6). Sc-siR, scramble siRNA; β-catenin siR, β-catenin siRNA; pcDNA, pcDNA3.1.
Fig. 8
Fig. 8
A graphical abstract of the mechanism underlying homocysteine-induced cardiac hypertrophy.

Similar articles

References

    1. Daenen, K. et al. Oxidative stress in chronic kidney disease. Pediatr. Nephrol.34, 975–991 (2019). - PubMed
    1. Kimball, J. S. & Johnson, J. P. Oxidative stress and osteoporosis. J. Bone Joint Surg. Am.103, 1451–1461 (2021). - PubMed
    1. van der Pol, A., van Gilst, W. H., Voors, A. A. & van der Meer, P. Treating oxidative stress in heart failure: Past, present and future. Eur. J. Heart Fail.21, 425–435 (2019). - PMC - PubMed
    1. Malaviya, P. & Kowluru, R. A. Homocysteine and mitochondrial quality control in diabetic retinopathy. Eye Vis. (Lond.)11, 5 (2024). - PMC - PubMed
    1. Kowluru, R. A., Mohammad, G. & Sahajpal, N. Faulty homocysteine recycling in diabetic retinopathy. Eye Vis. (Lond.)7, 4 (2020). - PMC - PubMed

MeSH terms

LinkOut - more resources