. 2025 Jul 2;15(1):22947.
doi: 10.1038/s41598-025-06657-8.

Evaluation of normalisation strategies for qPCR data obtained from canine gastrointestinal tissues with different pathologies

Affiliations

Evaluation of normalisation strategies for qPCR data obtained from canine gastrointestinal tissues with different pathologies

Maria G Luigi-Sierra et al. Sci Rep. .

Abstract

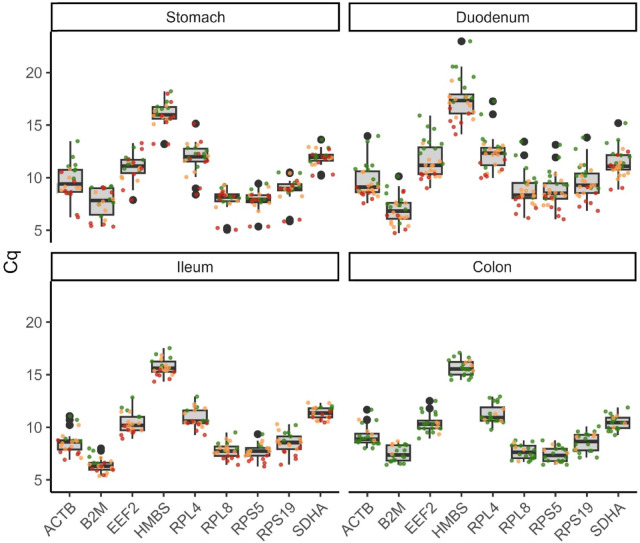
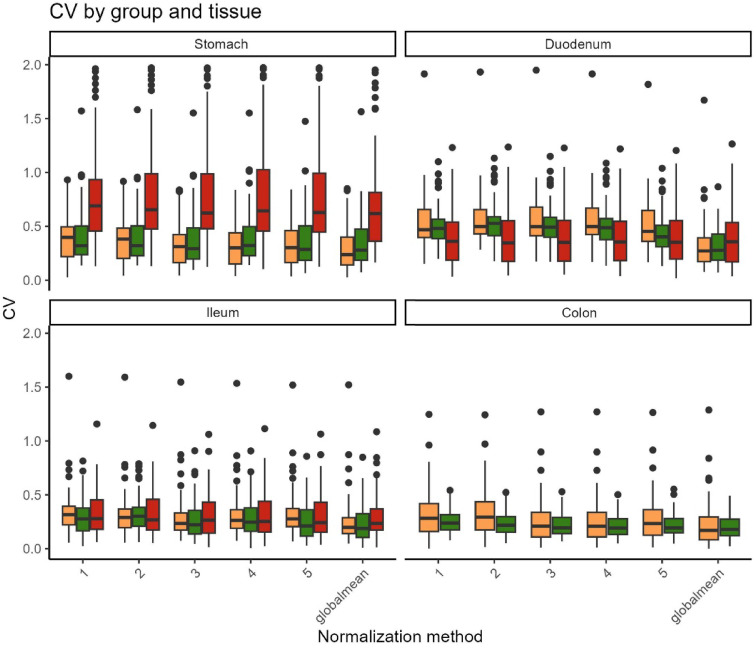
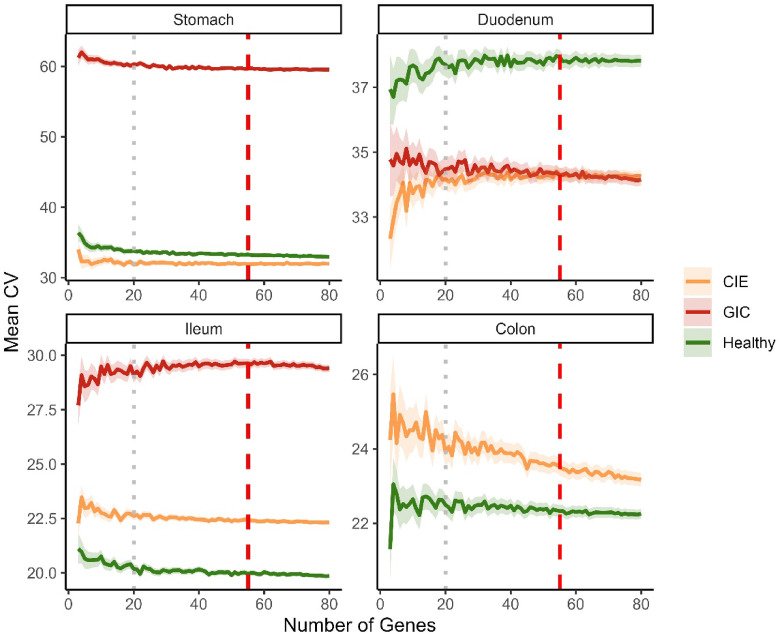
Quantitative real-time PCR (qPCR) is widely used to quantify gene expression at the mRNA level and confirm RNAseq results. Normalisation is a critical process used to minimise technical variability introduced during sample processing. To achieve this, reference genes (RGs), known for their stable expression across conditions, are commonly used as a baseline for accurate comparison. In canine intestinal tissue, there are no published studies validating RGs or other normalisation strategies. This study aimed to identify the best normalisation method in qPCR data from intestinal tissue biopsies of healthy dogs and in dogs suffering from gastrointestinal disease. RNA later-preserved tissue from healthy dogs and dogs with different gastrointestinal pathologies was used for RNA isolation and subsequent qPCR. Ninety-six genes were profiled using a qPCR high-throughput platform. Eleven RGs were included in the investigation. The RGs were ranked based on their stability using two standard methods (GeNorm and NormFinder). Normalisation including one to five of the most stable RGs and the global mean (GM) of the expression of all tested genes as an alternative normalisation method were investigated. The global mean expression was the best-performing normalisation method. Three RGs (RPS5, RPL8 and HMBS) were suitably stable RGs for normalising qPCR data when profiling small sets of genes in canine gastrointestinal tissue with different pathology. Furthermore, in our experimental set-up, with multiple tissues under different conditions, the implementation of the GM method is advisable when a set greater than 55 genes is profiled.

Keywords: CV; Chronic inflammatory enteropathy; Dog; Gastrointestinal cancer; Gastrointestinal tract; Global mean; Normalisation; Reference genes; qPCR.


Conflict of interest statement

Declarations. Competing interests: The authors declare no competing interests.

Figures

Fig. 1
Fig. 1
Expression levels of the nine RGs validated in the study. The expression levels measured in Cq (y-axis) of each RG (x-axis) are plotted for the four investigated gastrointestinal tissues (stomach, duodenum, ileum and colon). Each boxplot corresponds to a gene, individual sample values are shown as black dots overlaid to represent data distribution, and the group of the samples is indicated by the dot colour, i.e. green: Healthy (n= 20), orange: CIE (n= 18) and red: GIC (n= 10). Colon GIC information was excluded as there is only one sample in the group. Boxes show the 25th to 75th percentile, and whiskers indicate maximum and minimum values.
Fig. 2
Fig. 2
Coefficient of variation of the gene expression data by tissue and disease group. The variation in gene expression depicted as CV (y-axis) for the six different normalisation strategies used (x-axis) is plotted in the four gastrointestinal areas studied (stomach, duodenum, ileum and colon). Healthy: green (n= 20); CIE: orange (n= 18); GIC: red (n= 10). Colon GIC information was excluded as there is only one sample in the group. Individual sample values are shown as black dots overlaid to represent data distribution. CV - Coefficient of variation. Boxes show the 25th to 75th percentile, and whiskers indicate maximum and minimum values.
Fig. 3
Fig. 3
Changes of coefficient of variation of gene expression across iterations for different number of genes after normalization with global mean. The variation in gene expression depicted as mean CV (y-axis) for different number of genes, from 2 to 81, (x-axis) is plotted in the four gastrointestinal areas studied (stomach, duodenum, ileum and colon). Healthy: green (n= 20); CIE: orange (n= 18); GIC: red (n= 10). Colon GIC information was excluded as there is only one sample in the group. CV - Coefficient of variation. The Dotted gray line indicates the number of genes with a significant decrease of CV, dashed red line indicates the number of genes with a consistent reduction of CV across iterations.

Similar articles

References

    1. Farrell, R. E. in In RNA Methodologies (Sixth Edition). 135–162 (eds Farrell, R. E.) (Academic, 2023).
    1. Raso, A. & Biassoni, R. Quantitative Real-Time PCR (Springer, New York, 2020).
    1. Chapman, J. R. & Waldenstrom, J. With reference to reference genes: a systematic review of endogenous controls in gene expression studies. Plos One. 10, e0141853. 10.1371/journal.pone.0141853 (2015). - PMC - PubMed
    1. Thellin, O. et al. Housekeeping genes as internal standards: use and limits. J. Biotechnol.75, 291–295. 10.1016/S0168-1656(99)00163-7 (1999). - PubMed
    1. Ho, K. H. & Patrizi, A. Assessment of common housekeeping genes as reference for gene expression studies using RT-qPCR in mouse choroid plexus. Sci. Rep-Uk. 1110.1038/s41598-021-82800-5 (2021). - PMC - PubMed

MeSH terms

LinkOut - more resources