

How sample handling distorts telomere studies
- PMID: 40593162
- PMCID: PMC12216365
- DOI: 10.1038/s41598-025-08303-9
How sample handling distorts telomere studies
Abstract
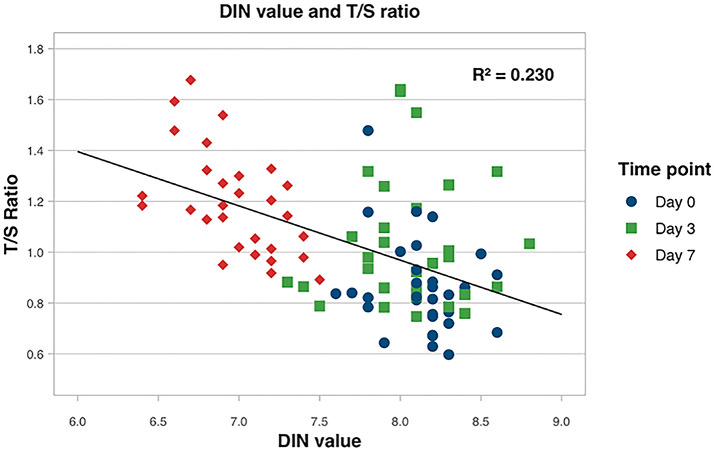
Telomere length (TL) is investigated as a biomarker for aging and disease-susceptibility, but measurement using quantitative polymerase chain reaction (qPCR) faces challenges in accuracy and reproducibility. The potential impact of pre-analytical factors on TL measurements remains underexplored. We evaluated the impact of delayed blood processing, a typical feature in population studies. Blood samples from 35 adults were processed for buffy coat extraction either immediately or kept at 4 °C and processed after three and seven days (total n = 105). After processing, samples were stored at -80 °C. Relative TL was measured via qPCR and expressed as T/S ratio. Strikingly, delayed blood processing led to a significant increase in TL: the mean T/S ratio was 0.886 ± 0.205 at day 0, rising to 1.022 ± 0.240 at day 3 (p = 0.03) and to 1.190 ± 0.205 at day 7 (p < 0.001), corresponding to increases of 15% and 34%, respectively. Notably, TL correlated inversely with DNA integrity. These findings underscore the critical impact of delayed sample processing on TL measurements, emphasizing the need for consistent pre-analytical protocols to ensure accurate and reliable research outcomes. The impact of our findings is considerable as it may overshadow not only previously reported results but also real biological differences in TL between studied groups of patients.
© 2025. The Author(s).
Conflict of interest statement
Declarations. Competing interests: The authors declare no competing interests.
Figures

References
MeSH terms
Grants and funding
LinkOut - more resources
Full Text Sources
