. 2025 Jul 1;8(1):960.
doi: 10.1038/s42003-025-08404-1.

Maternal thyroid hormone is required to develop the hindbrain vasculature in zebrafish

Affiliations

Maternal thyroid hormone is required to develop the hindbrain vasculature in zebrafish

Marlene Trindade et al. Commun Biol. .

Abstract

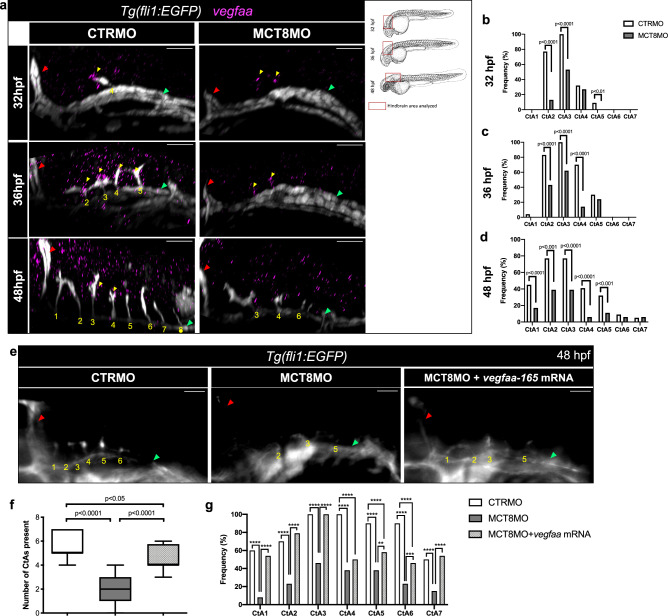
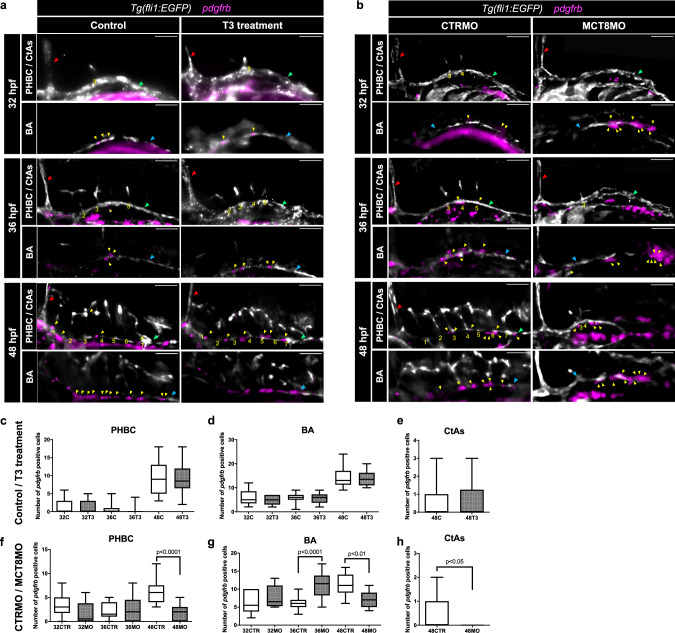
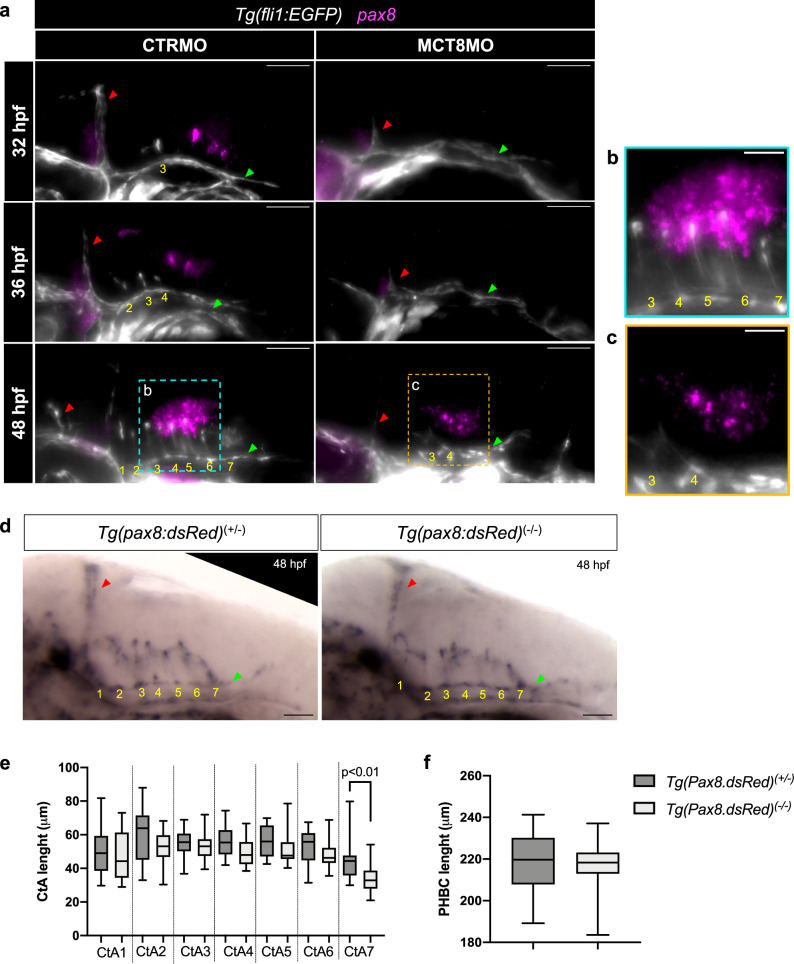
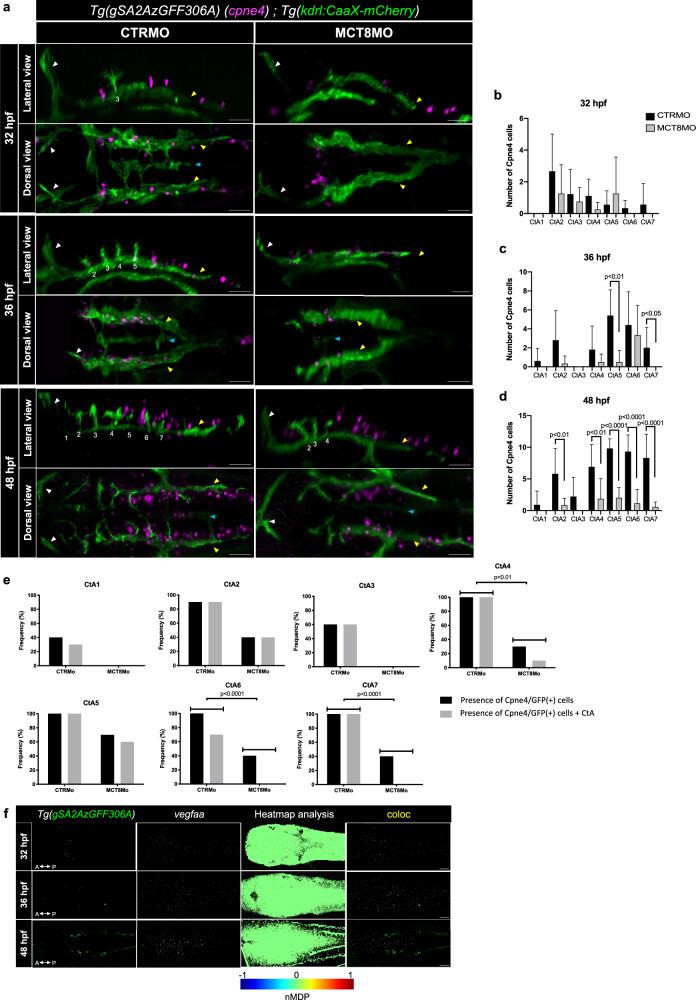
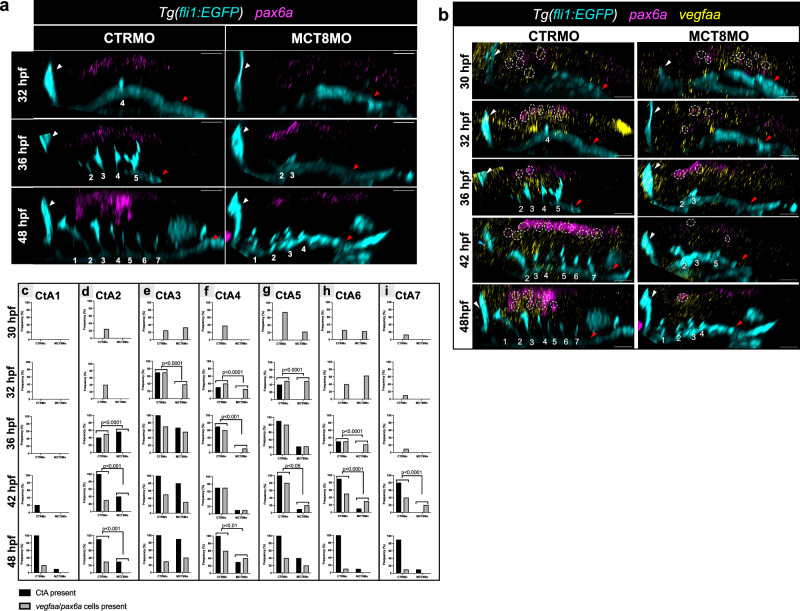
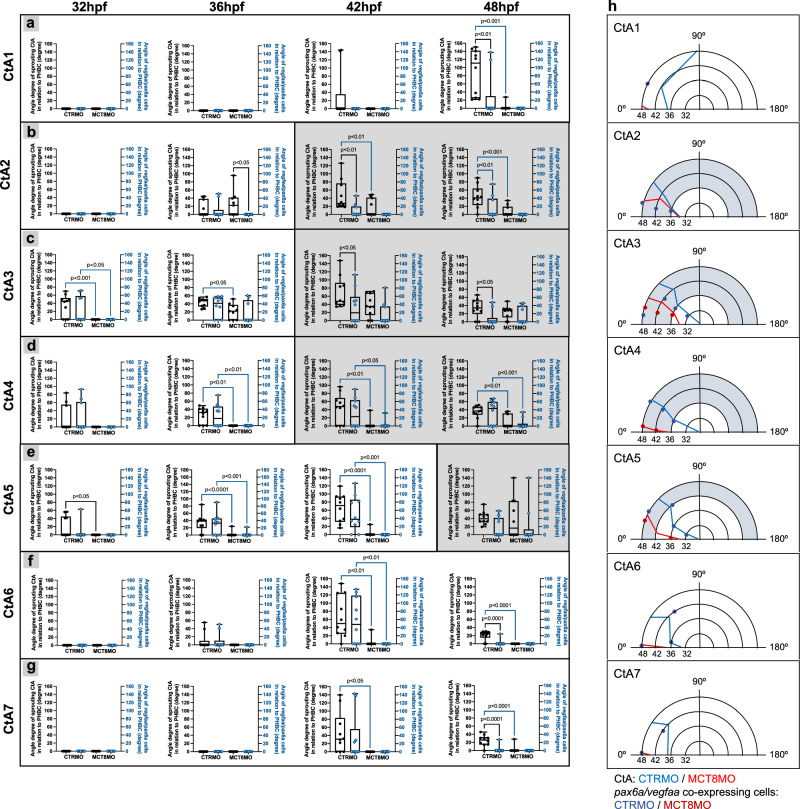
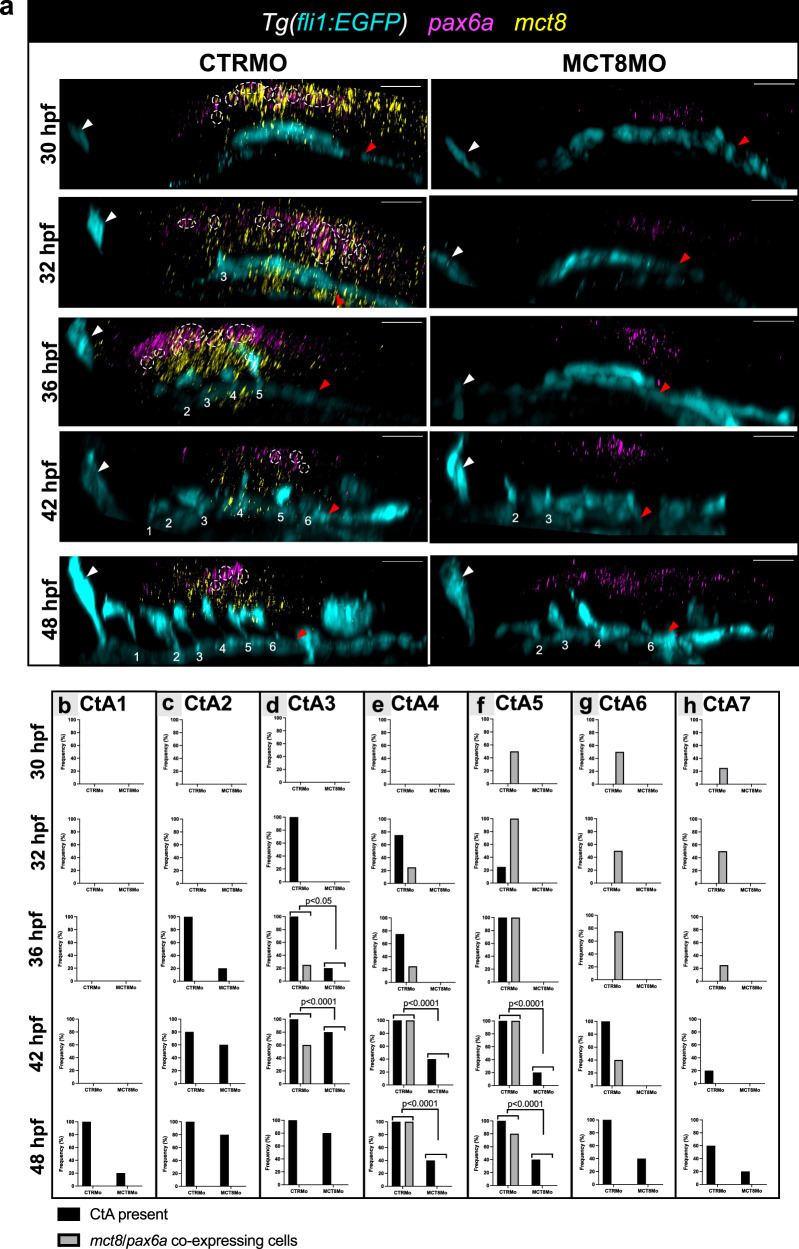
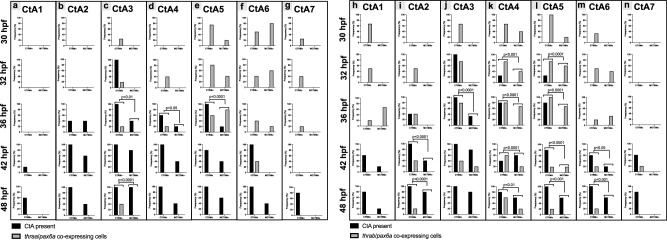
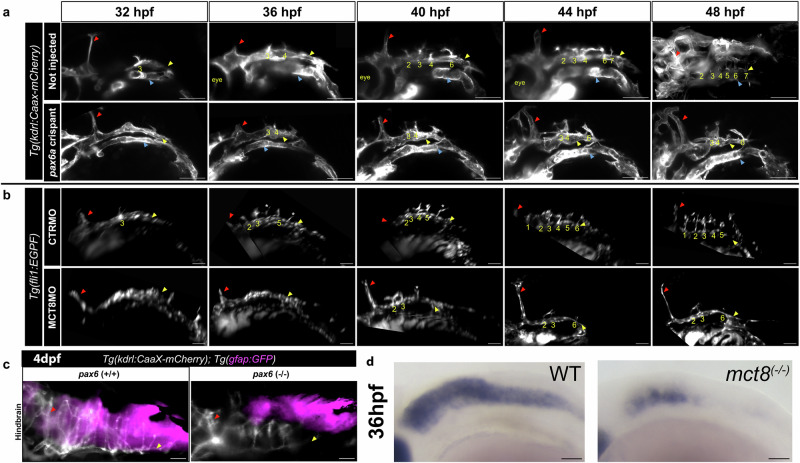
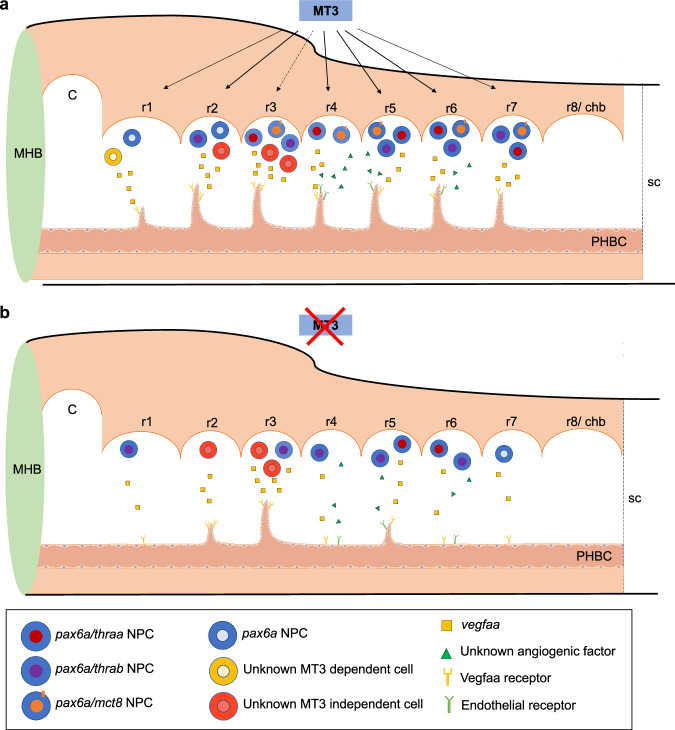
Thyroid hormone (TH) signaling is important and necessary for proper neurodevelopment. Inadequate levels of maternally derived THs (MTH) supply affect target gene expression profiles, which are fundamental for the brain's normal growth, maturation, and function. The monocarboxylate transporter 8 (SLC16A2, MCT8) is the main TH transporter present in the brain during embryonic development, and mutations in this transporter lead to a rare and debilitating human condition known as the Allan-Herndon-Dudley Syndrome (AHDS). This mutation affects the capacity for intracellular transport of the hormone, leading to impaired brain development that constitutes the main pathophysiological basis of AHDS. Like humans, zebrafish embryos express slc16a2 that transports exclusively T3 at zebrafish physiological temperature. Studies in zebrafish Mct8 knockdown (KD) models found impaired hindbrain vasculature development. Here, using zebrafish Mct8 KD and knockout (KO) models, we shed light on the maternal T3 (MT3)-dependent developmental mechanism behind hindbrain vasculature development. We first demonstrate that MT3-regulates hindbrain vegfaa expression. We provide evidence that hindbrain neurons are not the source of vegfaa, instead, restricted pax6a+ neuroprogenitor cells (NPCs) instruct central arteries (CtAs) ingression into the hindbrain. Therefore, MT3 acts as an integrator, providing the regulatory cues necessary for the timely ingression of the CtAs into the hindbrain.


Conflict of interest statement

Competing interests: The authors declare no competing interests.

Figures

Fig. 1
Fig. 1. MT3 regulates vegfaa expression during hindbrain vascular development.
a Lateral maximum projections of the hindbrain of Tg(fli1:EGFP) after WISH against vegfaa (magenta) and immunostained against GFP (endothelial marker, white) in CTRMO and MCT8MO zebrafish embryos at 32, 36 and 48 hpf. Yellow arrowhead indicates agglomeration of vegfaa expression around a CtA or the putative location where a CtA is supposed to ingress into the hindbrain. The red box indicates the hindbrain area for every embryonic stage analyzed adapted from (Kimmel et al., 1995). Graphical representation of the number of times, defined as frequency (%), that vegfaa expression can be observed around a specific CtA or where a CtA is supposed to develop at b) 32 hpf, c) 36 hpf, d) 48 hpf between CTRMO and MCT8MO embryos; Fisher’s exact test.n = 22 (32hpf and 48hpf CTRMO), 15 (32hpf MCT8MO), 23 (36hpf CTRMO), 21 (36hpf MCT8MO), 18 (48hpf MCT8MO). e At 48 hpf, Tg(fli1:EGFP) zebrafish embryos co-injected with vegfaa-165 mRNA and MCT8MO (n = 24) are able to partially rescue, in a rhombomere specific manner, some but not all CtAs. CTRMO (n = 10), MCT8MO (n = 14). f Statistical analysis of the number of CtAs present in each experimental group; One-way ANOVA followed by Bonferroni’s multiple comparison analysis. Data are presented as box-and-whisker plot, where the black thick horizontal line represents the median. The first and third quartiles are marked by the lower and upper edges of the boxes, respectively. Error bars represent standard deviations (smallest and higher value). g Frequency (%) of each CtA to develop in each experimental group; Fisher’s exact test. **p < 0.01; ***p < 0.001; ****p < 0.0001. For detailed statistics, see Supplementary Data 2. The red arrowhead indicates the mid-cerebral vein (MCeV), and the green arrowhead indicates the primordial hindbrain channels (PHBC). Numbers in yellow 1 – 8 indicate the CtA in its respective rhombomere. Scale bar: 50 μm. Zebrafish drawings used from Kimmel et al (1995)(Ref. ) under CC licence number 6041951178663.
Fig. 2
Fig. 2. MT3 seems to affect indirectly pericyte number due to impaired development of the hindbrain vascular structures.
Lateral view of Tg(fli1:EGFP) zebrafish embryos after WISH for pdgfrb (pericyte marker, magenta) and immunostained against GFP (endothelial marker, white) at 32, 36 and 48 hpf. Zebrafish embryos were submitted to two experimental conditions: a Increase of T3 (20 mM) availability in the medium (Control vs. T3 treatment) and b Knockdown of the Mct8 transporter by a morpholino-based system (CTRMO vs. MCT8MO). The red arrowhead indicates the mid-cerebral vein (MCeV), the green arrowhead indicates the primordial hindbrain channels (PHBC), the blue arrowhead indicates the basilar artery (BA), and the yellow arrowhead indicates pericytes. Yellow numbers 1-7 indicate the central arteries (CtAs) in their respective rhombomere. Scale bars: 100 µm. Quantification of the pericyte numbers in Control and T3 treatment condition in the c PHBC, d BA, and e CtAs at 32 hpf (n = 13, 11 (C, T3)), 36 hpf (n = 17, 14 (C, T3)) and 48 hpf (n = 20, 18 (C, T3)). Quantification of the pericyte numbers in CTRMO and MCT8MO condition in the f) PHBC, g) BA, and h) CtAs at 32 hpf (n = 14, 12 (CTRMO, MCT8MO)), 36 hpf (n = 15, 12 (CTRMO, MCT8MO)) and 48 hpf (n = 16, 11 (CTRMO, MCT8MO)). Data are presented as box-and-whisker plot, where the black thick horizontal line represents the median. The first and third quartiles are marked by the lower and upper edges of the boxes, respectively. Error bars represent standard deviations (smallest and highest value). Statistical significance determined by t-test p < 0.05. For detailed statistics, see Supplementary Data 2.
Fig. 3
Fig. 3. pax8 expression is downregulated in MCT8MO zebrafish embryos but is not involved in hindbrain vascular development.
a Lateral view of maximum projections of the hindbrain vasculature structures at 32, 36 and 48 hpf in Tg(fli1:EGFP) in CTRMO and MCT8MO zebrafish embryos after WISH for pax8 (magenta) and immunostaining for GFP (endothelial marker, white). In CTRMO zebrafish embryos, pax8 expression appears in the posterior hindbrain region, juxtaposed to CtAs 4 to 7. In MCT8MO zebrafish embryos, pax8 expression was clearly reduced and only appears at 48 hpf (n = 9 – 18). Magnification of the selected area at 48 hpf for b CTRMO and c MCT8MO embryos are shown. d Lateral view of the hindbrain of Tg(pax8:dsRed)+/- (control group (pax8+/-)) and Tg(pax8:dsRed)-/- (hypomorph group (pax8-/-)) zebrafish embryos after WISH for cadherin-5 at 48 hpf. All 7 CtAs were present in control pax8+/- and hypomorph pax8-/- zebrafish embryos. Image J software was used to measure the length of e each CtA and f the PHBC between control pax8+/- (n = 18) and hypomorph pax8-/- (n = 14) zebrafish embryos. No changes were observed; Unpaired t-test (Mann-Whitney test). Data are presented as box-and-whisker plot, where the black thick horizontal line represents the median. The first and third quartiles are marked by the lower and upper edges of the boxes, respectively. Error bars represent standard deviations (smallest and highest value). For detailed statistics, see Supplementary Data 2. The red arrowhead indicates the mid-cerebral vein (MCeV), and the green arrowhead indicates the primordial hindbrain channels (PHBC). Yellow numbers 1 – 7 indicate the developed CtA in its respective rhombomere. Scale bar 50 μm for figures (a) and (d) and 20 μm for (b) and (c).
Fig. 4
Fig. 4. MT3 regulates Cpne4+ cells during hindbrain vasculature development.
a Maximum projection of the hindbrain vasculature structures in double transgenic zebrafish embryos (Tg(kdrl:CaaX-mCherry);Tg(gSA2AzGFF306A)) immunostained against mCherry (green) and GFP (Cpne4+ cells, magenta) are shown. In CTRMO zebrafish embryos, Cpne4/GFP(+) cells were in close contact with the central arteries (CtAs), while in MCT8MO zebrafish embryos some Cpne4/GFP(+) cells were lost. The white arrowhead indicates the mid-cerebral vein (MCeV), the yellow arrowhead indicates the primordial hindbrain channels (PHBC), and the blue arrowhead indicates the basilar artery (BA). White numbers 1 – 7 indicate the developed CtA in its respective rhombomere. The number of Cpne4/GFP(+) cells between CTRMO and MCT8MO zebrafish embryos was analyzed at b) 32 hpf (n = 9, 8 (CTRMO, MCT8MO)), c) 36 hpf (n = 5, 6 (CTRMO, MCT8MO)) and d) 48 hpf (n = 7, 10 (CTRMO, MCT8MO)); Unpaired t-test; Error bars represent standard deviation. e Graphical view of the correlation between the presence of Cpne4/GFP(+) cells and the presence of each CtA in CTRMO and MCT8MO at 48 hpf shows that a correlation between these two conditions exists for CtAs 4, 6 and 7. Fisher’s exact test. n = 7 (CTRMO), 11 (MCT8MO). For detailed statistics, see Supplementary Data 2. f Dorsal view of the hindbrain of Tg(gSA2AzGFF306A) zebrafish embryos at 32, 36 and 48 hpf after WISH for vegfaa (white) and immunostained against GFP (Cpne4 cells, green) are shown. Heatmap colocalization analysis was used using normalized mean deviation product (nMDP) values and a combined image between GPF and vegfaa expression is shown. Color bar chart indicating no colocalization (-1, blue color) to colocalization (1, red color). Scale bar: 50 μm.
Fig. 5
Fig. 5. Ventral pax6a+ cells express vegfaa in the zebrafish hindbrain.
aLateral view of Tg(fli1:EGFP) CTRMO and MCT8MO zebrafish embryos after WISH for pax6a (magenta) and immunostained against GFP (endothelial marker, cyan) at 32, 36 and 48 hpf are shown. The ventral population of pax6a expressing cells were lost in MCT8MO zebrafish embryos, compared to CTRMO embryos. bLateral view of Tg(fli1:EGFP) fluorescent maximum projection images of double WISH for pax6a (magenta) and vegfaa (yellow) and immunostained against GFP (cyan) in CTRMO and MCT8MO zebrafish embryos at 30, 32, 36, 42 and 48 hpf are represented. The hindbrain of CTRMO and MCT8MO zebrafish embryos were analyzed for colocalization of pax6a and vegfaa co-expressing cells (white dotted circles) during BHB development at different time points. Colocalization was determined by using the colormap colocalization plugin of Fiji software in the region of every CtA. The white arrowhead represents the mid-cerebral vein (MCeV), and the red arrowhead represents the primordial hindbrain channels (PHBC). Numbers 1 – 7 indicate the CtA in its respective rhombomere. Scale bar: 50 μm. During the different time points of hindbrain vasculature development (c-CtA1, d-CtA2, e-CtA3, f-CtA4, g-CtA5, h-CtA6, i-CtA7), the presence and absence of CtAs and pax6a/vegfaa co-expressing cells were analyzed and the frequency determined. CtAs 2, 4, 5 and 7 correlate with CtA development and vegfaa/pax6a co-expressing cells. Fisher’s exact test. n = 8 (30 hpf CTRMO, 32 hpf MCT8MO), 9 (30 hpf MCT8MO, 36 hpf MCT8MO), 10 (all other stages and conditions). For detailed statistics, see Supplementary Data 2.
Fig. 6
Fig. 6. pax6a/vegfaa co-expressing cells guide central arteries migration.
The angle of the developing CtA 1 (a), CtA 2 (b), CtA 3 (c), CtA 4 (d), CtA 5 (e), CtA 6 (f), and CtA 7 (g) were measured using the PHBC as the basis (0 degrees). The angle was measured before the turnover of the CtA towards the BA or directional change of the CtAs towards its ipsilateral neighbors. CtAs and pax6a/vegfaa co-expressing cells that were absent are indicated as 0°. Grey boxes show the CtAs that changed the directional migration during hindbrain vasculature development. a–g Statistical significance was determined using 2-way ANOVA. n = 8 (30 hpf CTRMO, 32 hpf MCT8MO), 9 (30 hpf MCT8MO, 36 hpf MCT8MO), 10 (all other stages and conditions). Data are presented as box-and-whisker plot, where the black thick horizontal line represents the median. Each dot represents a biological replicate; error bars represent standard deviations (smallest and highest value). For detailed statistics, see Supplementary Data 2. h Graphical representation of the CtA directionality and the position of the pax6a/vegfaa co-expressing cells during BHB development. The mean values were used to construct these graphs.
Fig. 7
Fig. 7. pax6a-expressing cells colocalize with T3 transporter mct8.
a Lateral view of maximum projection images of fluorescent double WISH against pax6a (magenta) and mct8 (yellow) and immunostaining against GFP (endothelial marker, cyan) in Tg(fli1:EGFP) CTRMO and MCT8MO zebrafish embryos at 30, 32, 36, 42 and 48 hpf. The hindbrain of CTRMO and MCT8MO zebrafish embryos were analyzed for colocalization of pax6a with mct8-expressing cells (white dotted circles) during BHB development at different time points. Colocalization was determined by using the colormap colocalization plugin of Fiji software in the region of every CtA. The white arrowhead represents the mid-cerebral vein (MCeV) and the red arrowhead represents the primordial hindbrain channels (PHBC). Numbers 1 – 7 indicate the CtA in its respective rhombomere. Scale bar: 50 μm. During the different time points of BHB development, the presence and absence of CtA 1 (b), CtA 2 (c), CtA 3 (d), CtA 4 (e), CtA 5 (f), CtA 6 (g), CtA 7 (h) and pax6a/mct8 co-expressing cells were analyzed and the correlation was determined. Statistical significance was determined using Fisher’s exact test. n = 3 (36 hpf MCT8MO), 4 (30 hpf CTRMO/MCT8MO, 32 hpf CTRMO, 36 hpf CTRMO), 5 (32 hpf MCT8MO, 42 hpf CTRMO/MCT8MO, 48 hpf CTRMO/MCT8MO)). For detailed statistics, see Supplementary Data 2.
Fig. 8
Fig. 8. pax6a-expressing cells colocalize with THalpha receptors.
During the different time points of hindbrain vasculature development, the presence and absence of CtA 1 (a), CtA 2 (b), CtA 3 (c), CtA 4 (d), CtA 5 (e), CtA 6 (f), CtA 7 (g) and pax6a/thraa co-expressing cells were analyzed and co-localization determined. Fisher’s exact test. n = 5, except for 32 hpf CTRMO and 42 hpf MCT8MO were n = 4. During the different time points of BHB development, the presence and absence of CtA 1 (h), CtA 2 (i), CtA 3 (j), CtA 4 (k), CtA 5 (l), CtA 6 (m), CtA 7 (n) and pax6a/thrab co-expressing cells were analyzed and and co-localization determined. Fisher’s exact test. n = 3 (30 hpf CTRMO, 36 hpf MCT8MO), 4 (32 hpf CTRMO), 5 (all other stages and conditions).
Fig. 9
Fig. 9. pax6a mutant zebrafish embryos show similar hindbrain vascular development defects as MCT8MO zebrafish embryos.
a Live imaging of 32 hpf zebrafish embryo at the start of imaging between non-injected (control) and pax6a crispant zebrafish embryos are represented. The vascular system (kdrl) is shown in white (mCherry) in the reporter line Tg(kdrl:CaaX-mCherry). Dorsal view of maximum projection images of the mentioned time points is shown. b Live imaging of 32 hpf zebrafish embryo at the start of imaging between CTRMO and MCT8MO zebrafish embryos are represented. The vascular system is shown in white (GFP) in the reporter line Tg(fli1:EGFP). Dorsal view of maximum projection images of the mentioned time point is shown. n = 2. Scale bar: 50 μm. c Comparison between control (not injected) and mutant pax6a CRISPR zebrafish larvae at 4 dpf are presented. n = 5 (control), 9 (pax6a CRISPR). Mutant pax6a knockout zebrafish larvae present only 4 CtAs, while the control zebrafish have 7 CtAs. The red arrowhead represents the mid-cerebral vein (MCeV), the yellow arrowhead represents the primordial hindbrain channels (PHBC), and the blue arrowhead represents the lateral dorsal aorta (LDA). White * represents sprouting projections of the PHBC to the BA (due to the inclination of the hindbrain imaging, we can visualize these structures). Numbers 1 – 7 indicate the CtA in its respective rhombomere. d In mct8(-/-) embryos at 36 hpf it is observed a loss of pax6a hindbrain cells coincident with CtAs underdevelopment. Scale bar 50 μm.
Fig. 10
Fig. 10. Proposed model for MT3 Mct8-mediated hindbrain development in zebrafish embryogenesis.
a Illustration of the zebrafish hindbrain with proposed action of MT3 signaling through Mct8 on CtA development. The different pax6a neural progenitor cells (NPC) identified in the different rhombomeres with the TH machinery mct8, thraa and thrab are illustrated. In rhombomere 1 we suggest the involvement of another central nervous system (CNS) cell type that is MT3 dependent and the source of vegfaa required for CtA development. In rhombomere 3, pax6a NPCs are present, but MT3 signaling is not involved in CtA 3 development (dashed arrow line) but enhances its development. Vascularization of rhombomeres 4, 5 and 6 suggests that, besides vegfaa, another angiogenic factor is involved in the angiogenic sprouting of these CtAs. b Illustration of a lateral view of the zebrafish hindbrain showing the effect of Mct8 knockdown and MT3-impaired signaling. The most frequently developed CtAs in the hindbrain of 48 hpf zebrafish embryos are represented. Although significantly reduced in rhombomere 2, vegfaa signaling is still present in MCT8MO zebrafish embryos, showing that another CNS cell type, independent on MT3 signaling, is responsible for releasing vegfaa or able to compensate for the lack of pax6a + /MT3-responsive cells. The inability to rescue the vascularization of rhombomere 4 by vegfaa-165 mRNA suggests that another angiogenic factor is necessary for its development. C: cerebellum; chb: caudal hindbrain; MHB: Midbrain-hindbrain boundary; MT3: maternal T3; PHBC: Primordial Hindbrain Channels; r1 – r8: rhombomere 1 – 8; sc – spinal cord. The endothelial cell model was adapted from https://bioart.niaid.nih.gov/discover?q=endothelial.

Similar articles

References

    1. Bernal, J. Thyroid hormones in brain development and function. in Endotext (eds. De Groot LJ, Chrousos G & K, D) (MDText.com, Inc, South Dartmouth, 2015).
    1. Friesema, E. C. H. et al. Association between mutations in a thyroid hormone transporter and severe X-linked psychomotor retardation. Lancet364, 1435–1437 (2004). - PubMed
    1. Schwartz, C. E. & Stevenson, R. E. The MCT8 thyroid hormone transporter and Allan-Herndon-Dudley syndrome. Best. Pract. Res. Clin. Endocrinol. Metab.21, 307–321 (2007). - PMC - PubMed
    1. Azzolini, S. et al. Delayed myelination is not a constant feature of Allan-Herndon-Dudley syndrome: Report of a new case and review of the literature. Brain Dev.36, 716–720. (2014) - PubMed
    1. Armour, C. M., Kersseboom, S., Yoon, G. & Visser, T. J. Further Insights into the Allan-Herndon-Dudley Syndrome: Clinical and Functional Characterization of a Novel MCT8 Mutation. PLoS ONE10, e0139343 (2015). - PMC - PubMed

MeSH terms

LinkOut - more resources