. 2025 Jul 1;87(8):107.
doi: 10.1007/s11538-025-01449-7.

Investigating Tumour Responses to Combinations of Radiotherapy and Hyperthermia

Affiliations

Investigating Tumour Responses to Combinations of Radiotherapy and Hyperthermia

Chloé Colson et al. Bull Math Biol. .

Abstract

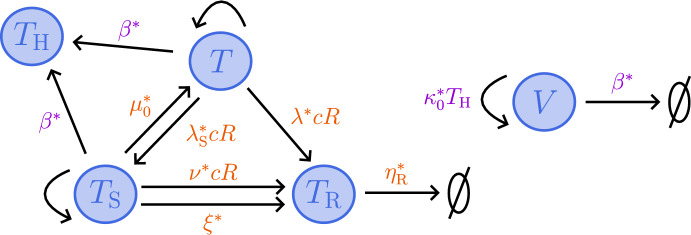
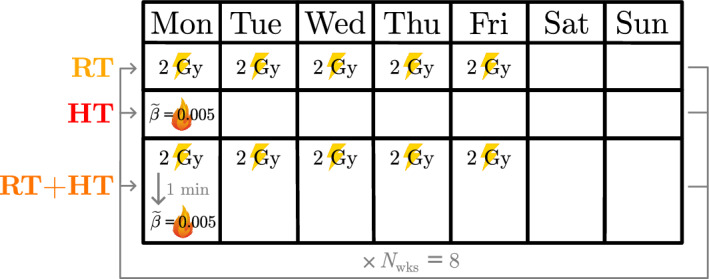
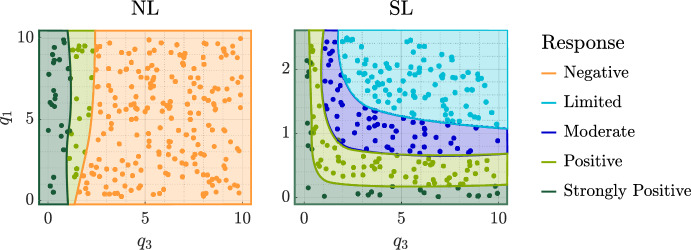
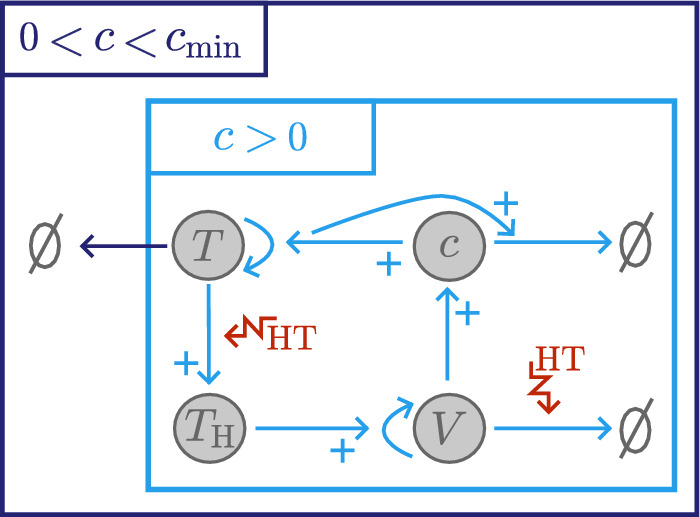
Hyperthermia (HT) is a promising candidate for enhancing the efficacy of radiotherapy (RT), but its use in the clinic has been limited by incomplete understanding of its interactions with RT. In this work, we investigate tumour responses to high temperature HT alone and combined with RT, focussing on how two different mechanisms for growth control may impact tumour sensitivity to these treatments. We extend an existing ordinary differential equation model of tumour growth and RT response to include high HT. In the absence of treatment, this model distinguishes between growth arrest due to nutrient insufficiency and competition for space, and exhibits three growth regimes: nutrient limited (NL), space limited (SL) and bistable (BS), where both mechanisms for growth arrest coexist. We construct three virtual tumour populations corresponding to the NL, SL and BS regimes and, for each population, we identify the treatment (RT, HT or RT + HT) and dosing regimen that maximise the reduction in tumour burden at the treatment end-point. We thus generate experimentally testable predictions that may explain highly variable experimental and clinical responses to RT and HT and assist patient-specific treatment design.

Keywords: Growth arrest mechanisms; Hyperthermia; ODE system; Radiotherapy.


Conflict of interest statement

Declarations. Conflict of interest: We declare we have no conflict of interest.

Figures

Fig. 1
Fig. 1
Schematic showing the interactions between T, TS, TR and TH cells, the vasculature, V, and the oxygen concentration, c, in response to high HT (purple) and RT (orange) in the model (2)–(7).
Fig. 2
Fig. 2
Given a high HT treatment of duration δH=60min starting at time tH=0, we plot μ(t), defined in Eq. (13), for t[0,7]days. The parameters μ0=μ0τ, with τ=1min, k2 and μΛ are fixed to the values stated in Table 2, k1=100β~ and β~{0.001,0.005,0.01}. There is no significant difference in the time evolution of μ as k1 varies. Thus, in this parameter regime, the inhibition of DNA repair is treatment-independent.
Fig. 3
Fig. 3
Scatter plots showing the steady state tumour volume, T, and logarithm of the oxygen concentration, ln(c), in the absence of treatment for each (q3,q1) pair and fixed value of V(0) used to generate the virtual NL, SL and BS tumours. We show the NL steady states for the BS cohort; its SL steady states are qualitatively the same as those for the SL cohort, except T:=1-V(0)=0.99725 and ln(c)[-4.6,-0.55].
Fig. 4
Fig. 4
Schematic showing the RT, HT and RT+HT fractionation schedules whose efficacy we compare when combining a conventional RT schedule comprising 5×2Gy for Nwks=8 weeks and a conventional HT schedule with β~=0.005. Yellow lightning symbols represent a RT fraction and red flame symbols represent a high HT fraction.
Fig. 5
Fig. 5
Schematic showing our two-step process for comparing RT, HT and RT+HT treatments on a toy dataset generated by taking a subset of the simulation results for a particular tumour in the SL cohort. The orange boxes highlight the best treatment, for comparable RT, HT and RT+HT schedules, and the red box highlights the best treatment and dosing regimen for this tumour.
Fig. 6
Fig. 6
Violin plots of the distributions of ΔviableR and ΔtotalR following conventional RT for tumours in the a NL and SL cohorts, and b BS cohort. SL tumours respond well to RT as they experience reductions in viable and total tumour volumes, while NL tumours have more limited responses, with smaller reductions in viable volume and increases in total volume. In the BS cohort, RT has a deleterious effect. Figures a and b were reproduced from Colson et al. (2023).
Fig. 7
Fig. 7
For the NL and SL cohorts, we show how the efficacy of RT depends on the values of q1 and q3. We stratify tumour responses into five classes: negative, limited, moderate, positive and strongly positive, as described in Sect. 3.3.
Fig. 8
Fig. 8
Violin plots of the distributions of ΔVH, ΔviableH and ΔtotalH following conventional high HT in the NL, SL and BS cohorts. All but one NL tumour respond positively to treatment, with typically greater reductions in tumour cell and vascular volumes in the NL and BS cohorts than in the SL cohort.
Fig. 9
Fig. 9
For the NL and SL cohorts, we show how the efficacy of conventional high HT depends on the values of q1 and q3. Tumour responses are stratified into five classes: negative, limited, moderate, positive and strongly positive, as described in Sect. 3.3. A1-C1 are representative NL tumours corresponding to (q3,q1) sets (2.72×10-1,5.03×10-1),(4.01×10-2,7.78) and (9.94, 7.60), respectively, while A2-C2 are representative SL tumours corresponding to (q3,q1) sets (2.10×10-1,1.51×10-1), (1.43×10-1,2.14) and (7.61, 2.14), respectively.
Fig. 10
Fig. 10
Schematic showing the relationships between the undamaged tumour volume, T, HT-damaged tumour volume, TH, vascular volume, V, and oxygen concentration, c, in model (14)–(19). When HT is applied, T cells are lethally damaged, becoming TH cells. HT also kills V, while TH cells induce vascular regrowth via angiogenesis; the balance of these two processes determines whether V decreases or increases during treatment. Increases (decreases) in V lead to an increase (decrease) in the supply of c to the tumour and, thus, an increase (decrease) in tumour cell proliferation and decrease (increase) in hypoxic cell death. The balance between changes in oxygen supply by V and oxygen consumption by T determine whether c increases or decreases during treatment, which, in turn, determines the extent of regrowth of T during treatment.
Fig. 11
Fig. 11
For high HT (β~=0.005), we solve Eqs. (14)–(19) for t(0,8.064×104] subject to initial conditions (22). We fix V(0)=0.0005 and (q3,q1) as indicated by the points A1-C1 in Fig. 9. Low values of q1 and q3 (A1) lead to worse treatment outcomes than high values of q1 and/or q3 (B1, C1) as they are associated with greater accumulation of dead material, HT-induced angiogenesis and tumour cell regrowth.
Fig. 12
Fig. 12
Schematics showing the biological processes that explain positive and negative responses to high HT in the a NL and b SL cohorts and how they depend on the values of q1 and q3.
Fig. 13
Fig. 13
For high HT (β~=0.005), we solve Eqs. (14)–(19) for t(0,8.064×104] subject to initial conditions (22). We fix V(0)=0.005 and (q3,q1) as indicated by the points A2-C2 in Fig. 9. Low values of q1 (A2) lead to worse outcomes than high values of q1 (B2, C2) as higher oxygen levels promote greater tumour regrowth and dead cell accumulation.
Fig. 14
Fig. 14
For the NL, BS and SL virtual cohorts, we show how the distributions of ΔVH, ΔviableH and ΔtotalH change as β~{0.001,0.005,0.01} varies (for fixed Nwks=8). The values of ΔVH, ΔviableH and ΔtotalH typically decrease as β~ increases.
Fig. 15
Fig. 15
Scatter plots showing the HT dosing regimen (defined in the table) which maximises |ΔviableH+ΔtotalH| for each (q3,q1) pair used to generate the NL, BS and SL virtual cohorts. The best dosing regimen depends on the efficacy of high HT: when HT response is weaker, larger HT fractions applied over a shorter time period typically maximise treatment efficacy (purple), whereas, when HT response is stronger, lower HT fractions applied over a longer time period are typically best (orange).
Fig. 16
Fig. 16
We solve Eqs. (14)–(19) subject to initial conditions (22). We fix V(0)=0.0005, and (q3,q1) as indicated by points A1 and C1 in Fig. 9. In both cases, we fix the thermal dose (left) β~=0.001 or (right) β~=0.01, and simulate high HT for (left) 80 weeks or (right) 8 weeks. A larger thermal dose is necessary for A1 to achieve a sustained reduction in tumour burden. In contrast, a lower thermal dose applied over a longer period yields a more gradual, but larger, reduction in tumour burden for C1.
Fig. 17
Fig. 17
For the (q3,q1) pairs used to generate the SL virtual cohort, scatter plot a shows the best treatment and scatter plot b shows the values of |ΔtotalR+ΔviableR|-|ΔtotalH+ΔviableH| for comparable RT and HT protocols (recall Fig. 4) corresponding to the optimal schedules in Fig. 18. Tumours that respond much better to RT than HT typically respond best to RT, and vice versa, while tumours with comparable responses to RT and HT alone respond best to combined treatment.
Fig. 18
Fig. 18
Scatter plots showing the best dosing regimen (defined in the table) for the (q3,q1) pairs used to generate the SL virtual cohort. When HT alone is best (see Fig. 17), a longer type 1 regimen with lower HT fractions is typically recommended for tumours that have a stronger response to HT alone and weaker response to RT alone. A shorter type 2 regimen with higher HT fractions is recommended for tumours with a weaker response to HT and stronger response to RT. When RT+HT is best (see Fig. 17), tumours with low values of q3 respond best to the type 2 regimen which includes lower RT fractions, while tumours with high values of q3 respond best to a longer type 3 regimen combining low HT fractions and high RT fractions. When RT alone is best (see Fig. 17), high RT fractions applied at high frequency maximise treatment efficacy.
Fig. 19
Fig. 19
For RT (R=0.5, Nfrac=1) and high HT (β~=0.005) schedules, alone and combined, we solve Eqs. (14)–(19) for t(0,1.6128×105] subject to initial conditions (22). We set (V(0),q3,q1)=(0.005,8.81,3.74×10-1). This SL tumour has a limited response to high HT and a positive response to RT (compared to the rest of the SL cohort). Combined treatment is most effective as RT and HT act synergistically, with RT significantly enhancing HT effects.
Fig. 20
Fig. 20
For conventional RT and HT schedules, alone and combined, we solve Eqs. (14)–(19) for t(0,8.064×104] subject to initial conditions (22). We set (V(0),q3,q1)=(0.005,9.53,3.21×10-2). This SL tumour responds positively to RT, but has a limited response to high HT. During combined treatment, HT-induced vascular damage reduces oxygen levels and RT cell kill rates. Combined with fast tumour regrowth between fractions, this slows the reduction in viable volume, enabling net growth of the viable volume. As a result, RT alone is the best treatment.

Similar articles

References

    1. Alfonso JC, Berk L (2019) Modeling the effect of intratumoral heterogeneity of radiosensitivity on tumor response over the course of fractionated radiation therapy. Radiat Oncol 14(1):1–12. 10.1186/s13014-019-1288-y - PMC - PubMed
    1. Attar MM, Haghpanahi M, Amanpour S et al (2014) Analysis of bioheat transfer equation for hyperthermia cancer treatment. J Mech Sci Technol 28(2):763–771. 10.1007/s12206-013-1141-4
    1. Behrouzkia Z, Joveini Z, Keshavarzi B et al (2016) Hyperthermia: how can it be used? Oman Med J 31(2):89. 10.5001/omj.2016.19 - PMC - PubMed
    1. Bosque JJ, Calvo GF, Pérez-García VM et al (2021) The interplay of blood flow and temperature in regional hyperthermia: a mathematical approach. R Soc Open Sci 8(1):201234. 10.1098/rsos.201234 - PMC - PubMed
    1. Bosque JJ, Calvo GF, Navarro MC (2022) Modelling the effect of vascular status on tumour evolution and outcome after thermal therapy. Appl Math Model 110:207–240. 10.1016/j.apm.2022.05.029

LinkOut - more resources