

Untargeted metabolomic profiling of serum and urine in kidney cancer: a non-invasive approach for biomarker discovery
- PMID: 40593405
- PMCID: PMC12213972
- DOI: 10.1007/s11306-025-02294-4
Untargeted metabolomic profiling of serum and urine in kidney cancer: a non-invasive approach for biomarker discovery
Abstract
Introduction: Kidney cancer (KC) is a significant global health burden. Early diagnosis remains challenging due to the limited sensitivity and specificity of existing biomarkers. Metabolomics enables the detection of disease-specific metabolic alterations, offering potential for improved non-invasive biomarker discovery.
Objectives: This study aims to characterize metabolic signatures distinguishing KC patients from non-cancer controls and evaluate the diagnostic potential of annotated metabolites in serum and urine.
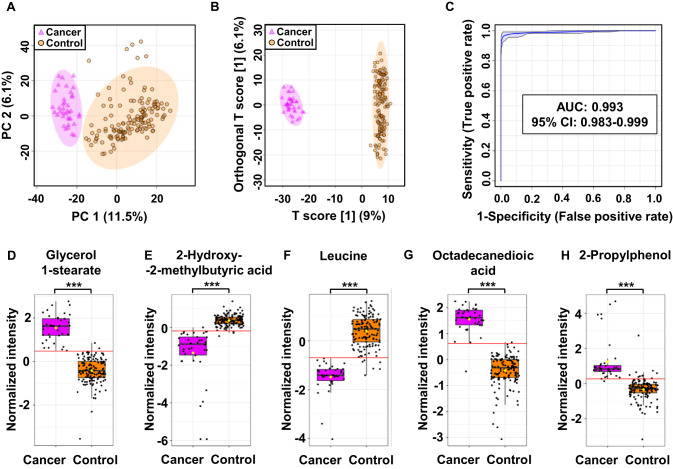
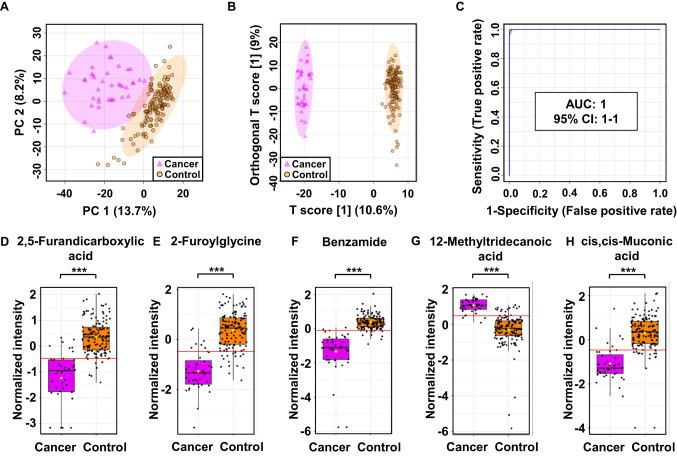
Methods: An untargeted metabolomic analysis was performed on serum and urine samples from 56 KC patients and 200 controls using ultra-high-resolution mass spectrometry coupled with ultra-high-performance liquid chromatography (UHPLC-UHRMS in both positive and negative ionization modes with vacuum insulated probe heated electrospray ionization (VIP-HESI)). Samples were collected from the same individuals, which helped minimize inter-individual variability and enabled cross-biofluid comparison of metabolic profiles. Multivariate statistical techniques were applied to detect metabolic differences, including principal component analysis (PCA) and orthogonal partial least squares discriminant analysis (OPLS-DA). An external validation strategy using training and validation subsets was employed to assess the robustness of candidate metabolite biomarkers matched in the discovery dataset.
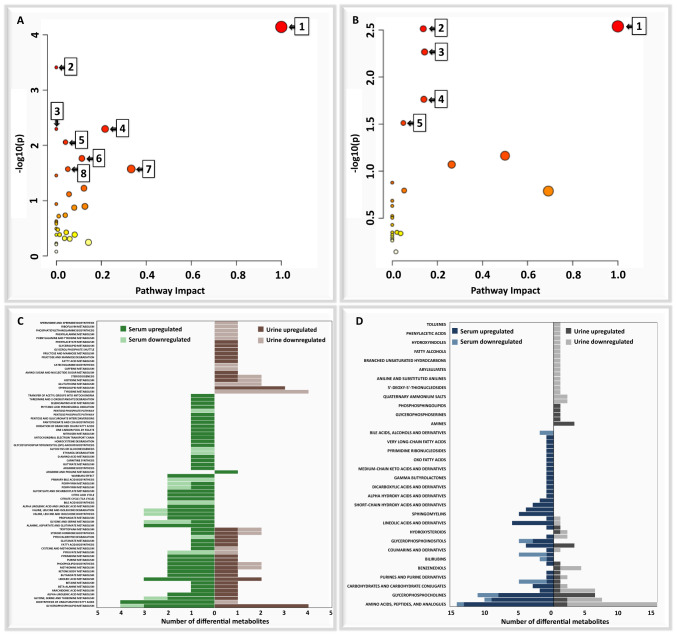
Results: Distinct metabolic signatures were observed between KC patients and controls, with key metabolic pathways involving lipid metabolism, amino acid biosynthesis, and glycerophospholipid metabolism. 19 serum and 12 urine metabolites showed high diagnostic potential (AUC > 0.90), demonstrating strong sensitivity and specificity.
Conclusion: These findings support the application of metabolomics for RCC detection and highlight the metabolic alterations associated with kidney cancer. Further validation in larger cohorts is necessary to confirm the clinical utility of these potential biomarkers.
Keywords: Biomarkers; Kidney cancer; Metabolomics; Serum; UHPLC-UHRMS; Urine.
© 2025. The Author(s).
Conflict of interest statement
Declarations. Conflict of interest: The authors declare no competing financial and/or non-financial interests. Consent to participate: The patients provided written consent to participate in research. Consent for publication: The patients provided written informed consent for the publication of any associated data. Ethical approval: The local Bioethics Committee approved the study protocol at the University of Rzeszow (Poland) (permission no. 2018/04/10). Research involving human and/or animal participants: This article does not contain any studies with human and/or animal participants performed by either of the authors.
Figures
Similar articles
-
Distinct metabolomic signatures in allergic rhinitis with concurrent chronic spontaneous urticaria: an untargeted metabolomics analysis reveals novel biomarkers and pathway alterations.Front Immunol. 2025 Jun 10;16:1555664. doi: 10.3389/fimmu.2025.1555664. eCollection 2025. Front Immunol. 2025. PMID: 40557142 Free PMC article.
-
Metabolomic profiling reveals interindividual metabolic variability and its association with cardiovascular-kidney-metabolic syndrome risk.Cardiovasc Diabetol. 2025 Aug 1;24(1):315. doi: 10.1186/s12933-025-02881-8. Cardiovasc Diabetol. 2025. PMID: 40751246 Free PMC article.
-
[Omics Study of Ovarian Malignancies: From Urine Metabolomic Profile to Minimally Invasive MicroRNA Markers].Mol Biol (Mosk). 2025 Jan-Feb;59(1):80-116. Mol Biol (Mosk). 2025. PMID: 40542633 Russian.
-
Blood biomarkers for the non-invasive diagnosis of endometriosis.Cochrane Database Syst Rev. 2016 May 1;2016(5):CD012179. doi: 10.1002/14651858.CD012179. Cochrane Database Syst Rev. 2016. PMID: 27132058 Free PMC article.
-
Utilizing metabolomics to identify potential biomarkers and perturbed metabolic pathways in osteoarthritis: A systematic review.Semin Arthritis Rheum. 2023 Apr;59:152163. doi: 10.1016/j.semarthrit.2023.152163. Epub 2023 Jan 13. Semin Arthritis Rheum. 2023. PMID: 36736024 Free PMC article.
References
-
- Arendowski, A., Nizioł, J., Ossoliński, K., Ossolińska, A., Ossoliński, T., Dobrowolski, Z., & Ruman, T. (2018a). Laser desorption/ionization MS imaging of cancer kidney tissue on silver nanoparticle-enhanced target. Bioanalysis, 10(2), 83–94. 10.4155/bio-2017-0195 - PubMed
-
- Arendowski, A., Nizioł, J., & Ruman, T. (2018b). Silver-109-based laser desorption/ionization mass spectrometry method for detection and quantification of amino acids. Journal of Mass Spectrometry, 53(4), 369–378. 10.1002/JMS.4068 - PubMed
-
- Arendowski, A., Ossoliński, K., Nizioł, J., & Ruman, T. (2020a). Screening of urinary renal cancer metabolic biomarkers with gold nanoparticles-assisted laser desorption/ionization mass spectrometry. Analytical Sciences, 36(12), 1521–1527. 10.2116/ANALSCI.20P226/METRICS - PubMed
-
- Arendowski, A., Ossoliński, K., Nizioł, J., & Ruman, T. (2020b). Gold nanostructures—assisted laser desorption/ionization mass spectrometry for kidney cancer blood serum biomarker screening. International Journal of Mass Spectrometry, 456, 116396. 10.1016/J.IJMS.2020.116396
-
- Arendowski, A., Ossoliński, K., Ossolińska, A., Ossoliński, T., Nizioł, J., & Ruman, T. (2021). Serum and urine analysis with gold nanoparticle-assisted laser desorption/ionization mass spectrometry for renal cell carcinoma metabolic biomarkers discovery. Advances in Medical Sciences, 66(2), 326–335. 10.1016/J.ADVMS.2021.07.003 - PubMed
MeSH terms
Substances
Grants and funding
LinkOut - more resources
Full Text Sources
Medical