. 2025 Jul 1;16(1):479.
doi: 10.1038/s41419-025-07778-8.

p66Shc deletion confers apoptotic resistance to loss of EGFR-ERK signalling in neural stem cells

Affiliations

p66Shc deletion confers apoptotic resistance to loss of EGFR-ERK signalling in neural stem cells

Andrew M Powell et al. Cell Death Dis. .

Abstract

Growth factor signalling, through epidermal growth factor (EGF) and its receptor (EGFR), governs neural stem cell (NSC) proliferation, differentiation, and survival. The Src Homology and Collagen (SHC1) adaptor protein mediates EGFR survival-signalling in NSCs via its two shorter isoforms. However, the role of its longest isoform, p66Shc, in NSCs remains unclear. In this study, we investigated the role of p66Shc in NSC apoptosis by generating p66Shc knockout (p66KO) NSCs and assessing their responses to EGF withdrawal, EGFR inhibition, and MEK inhibition. We found that p66KO NSCs resisted apoptosis induced by EGF deprivation and EGFR-ERK pathway inhibition. In contrast, p66KO NSCs maintained their sensitivity to staurosporine, a general apoptosis inducer. Furthermore, p66KO NSCs subjected to prolonged MEK inhibition continued to differentiate into neurons, demonstrating their ability to evade apoptosis and progress through neuronal differentiation. These findings identify p66Shc as a pivotal regulator of NSC apoptosis in response to disrupted EGFR-ERK signalling. The ability of p66KO NSCs to resist apoptosis and differentiate without EGFR-ERK signalling highlights the potential of targeting p66Shc in conditions where growth factor signalling is disrupted, such as neurodegenerative diseases or brain injuries. Additionally, the role of p66Shc in modulating survival pathways may have broader implications for NSC-like cancers, where assessing p66Shc levels could provide prognostic value for the sensitivity of cancers to EGFR- or MEK-inhibition-based chemotherapies.


Conflict of interest statement

Competing interests: The authors declare no competing interests. Ethics approval and consent to participate: All methods were performed in accordance with the relevant guidelines and regulations. This study did not involve human participants, human-derived materials, or live vertebrate animals, and therefore did not require ethics approval or informed consent.

Figures
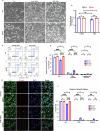
Fig. 1
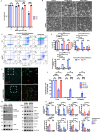
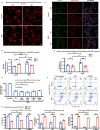
Fig. 1. Deletion of p66Shc prevents apoptosis of NSCs following EGF withdrawal.
A Representative phase contrast images of WT and p66KO NSCs after 48 h in NSC growth media (control), or after 48 h in NSC growth media without EGF. Scale = 20 μm. B Effect of 48 h of EGF withdrawal on the percentage of live cells in WT and p66KO NSCs compared to in growth media (control), assessed by trypan blue exclusion assay. Showing mean ± SEM, n = 3 independent experiments. C, D Flow cytometry analysis of annexin V and PI staining in WT and p66KO NSCs treated with (control) or without EGF (-EGF) for 24 h. Representative flow cytometry plots (C), and quantification of live (Q1), early apoptotic (Q2), and late apoptotic/necrotic cells (Q3/4) (D). Showing mean ± SEM, n = 3 independent experiments. E, F Immunofluorescence (IF) analysis of native cytochrome C (CytC) staining and cleaved caspase-3 (CCasp3) staining, representative image of WT and p66KO NSCs after 24 hr in growth media (Control) or 24 hours in growth media without EGF (-EGF) (E) Scale = 10 μm. Quantification of cells negative for CytC, positive for CCasp3, and live cells (positive for CytC, negative for CCasp3) (F); mean ± SEM, n = 3 independent experiments, each with at least three fields of view. Statistics were obtained using two-way ANOVA: ns, p0.05; *p < 0.05; **p < 0.01; ***p < 0.001.
Fig. 2
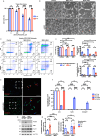
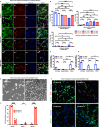
Fig. 2. Loss of p66Shc protects against EGFR inhibition-mediated apoptosis.
A Effect of AG1478 concentration on cell viability after 24 h treatment in WT and p66KO NSCs in NSC growth media, assessed by trypan blue exclusion assay; mean ± SEM, n = 3 independent experiments. B Representative phase contrast images of WT and p66KO NSCs for the following conditions: NSC growth media 24 h (Control) or treated with 2 μM AG1478 (EGFRi) for 24 h and 48 h. Scale = 20 μm. C, D Flow cytometry analysis of annexin V and PI staining in WT and p66KO NSCs after 48 h in NSC growth media (Control) or treated with 2 μM AG1478 for 24 h and 48 h. Representative flow cytometry plots (C), and quantification of live (Q1), early apoptotic (Q2), and late apoptotic/necrotic cells (Q3/4) (D); mean ± SEM, n = 3 independent experiments. E, F IF analysis of native CytC and CCasp3 staining in WT and p66KO NSCs treated with 2 μM AG1478, using ×20 (left) and ×60 (right) magnification. The hatched box indicates the magnified area. Scale = 50 μm (E). Quantification of cells negative for CytC, positive for CCasp3, and live cells (positive for CytC, negative for CCasp3) (F); mean ± SEM, n = 3 independent experiments, each with at least three fields of view. G, H Western blot analysis of EGFR-mediated signaling proteins including AKT, STAT3, ERK, and SHC in WT and p66KO NSCs treated with DMSO vehicle (CTRL) or 2 μM AG1478 for 4 h, followed by 20 nM EGF stimulation for 30 minutes. Densitometric analysis of the western blots (H); mean ± SEM, n = 3 independent experiments. Statistics were obtained using two-way ANOVA: ns, p0.05; *p < 0.05; **p < 0.01; ***p < 0.001.
Fig. 3
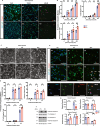
Fig. 3. Loss of p66Shc protects against MEK inhibition-mediated apoptosis.
A Effect of pd032901 concentration on cell viability after 24 h treatment in WT and p66KO NSCs, assessed by trypan blue exclusion assay; mean ± SEM, n = 3 independent experiments. B Representative phase contrast images of WT and p66KO NSCs for the following conditions: NSC growth media 24 h (Control) or treated with 1 μM pd032901 (MEKi) for 24 h and 48 h. Scale = 20 μm. C, D Flow cytometry analysis of annexin V and PI staining in WT and p66KO NSCs after 48 h in NSC growth media (control) or treated with 1 μM pd032901 for 24 h and 48 h. Representative flow cytometry plots (C), and quantification of live (Q1), early apoptotic (Q2), and late apoptotic/necrotic cells (Q3/4) (D); mean ± SEM, n = 3 independent experiments. E, F IF analysis of CytC release and CCasp3 staining in WT and p66KO NSCs treated with 1 μM pd032901, using ×20 (left) and ×60 (right) magnification. The hatched box indicates the magnified area. Scale = 50μm. Quantification of cells negative for CytC, positive for CCasp3, and live cells (positive for CytC, negative for CCasp3) (F); mean ± SEM, n = 3 independent experiments, each with at least three fields of view. G, H Western blot analysis of ERK and AKT signaling proteins in WT and p66KO NSCs treated with either DMSO vehicle (CTRL) or 1 μM pd032901 for 4 h, followed by 20 nM EGF stimulation for 30 minutes. Representative blots (G), and their densitometric analysis (H); mean ± SEM, n = 3 independent experiments. Statistics were obtained using two-way ANOVA: ns, p ≥ 0.05; *p < 0.05; **p < 0.01; ***p < 0.001.
Fig. 4
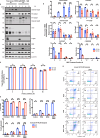
Fig. 4. Loss of p66Shc does not protect against staurosporine-mediated apoptosis.
A, B Effect of staurosporine concentration on CytC release and CCasp3, assessed by IF after treatment for 24 h. Scale = 50 μm. Quantification of percentage of apoptotic cells (negative for CytC staining or positive for CCasp3), percent of cell population positive for CytC (CytC-negative) and percent of cell population positive for cleaved caspase-3 (Cleaved Casp3 + ). mean ± SEM, n = 3 independent experiments, each with at least three fields of view. CE Effect 400 nM staurosporine on apoptosis of WT and p66KO NSCs over 24 h time-course. Representative phase contrast images showing morphological changes to WT and p66KO NSCs. Scale = 50 μm (C). IF images showing representative images of WT and p66KO NSCs stained for native CytC and CCasp3 after staurosporine treatment. The hatched box indicates the magnified area, showing p66KO cells undergoing release of CytC (>), and caspase-3 activity and chromatin condensation (>>). Scale = 50 μm (E). Quantification of the percentage of apoptotic cells (negative for CytC staining or positive for CCasp3), percent of cell population positive for CytC (CytC-negative) and percent of cell population positive for cleaved caspase-3 (Cleaved Casp3+). mean ± SEM, n = 3 independent experiments, each with at least three fields of view. F,G Western blot analysis of cleaved and procaspase-9 and -3 in WT and p66KO NSCs treated with 400 nM staurosporine for 6 h. Representative blots (F) and densitometric analysis (G); mean ± SEM, n = 3 independent experiments. Statistics were obtained using two-way ANOVA: ns, p ≥ 0.05; *p < 0.05; **p < 0.01; ***p < 0.001.
Fig. 5
Fig. 5. Loss of p66Shc protects against MEK inhibition-mediated apoptosis without enhancing pro-survival ERK or AKT signalling.
A, B Western blot analysis of cleaved caspase-3, procaspase-3, cleaved caspase-9, procaspase-9, P-AKT, AKT, P-ERK, ERK, and SHC in WT and p66KO NSCs treated with 1 μM PD0325901 over a 24 h time course. Representative blots (A) and densitometric analysis (B); mean ± SEM, n = 3 independent experiments. C Effect of PI3K inhibitor LY294002 concentration on WT and p66KO NSC viability after 24 h, assessed by trypan blue exclusion assay; mean ± SEM, n = 3 independent experiments. D, E Flow cytometry analysis of Annexin V and PI staining in WT and p66KO NSCs treated with DMSO, 1 μM PD0325901, 40 μM LY294002, or both inhibitors for 24 h. Representative flow plots (D) and quantification of live (Q1), early apoptotic (Q2), and late apoptotic/necrotic cells (Q3/4) (E); mean ± SEM, n = 3 independent experiments. Statistics were obtained using two-way ANOVA: ns, p ≥ 0.05; *p < 0.05; **p < 0.01; ***p < 0.001.
Fig. 6
Fig. 6. Resistance of p66KO NSCs to MEK inhibition is not mediated by decreased ROS production.
A, B Representative IF images of MitoSOX Red staining in WT and p66KO NSCs following either DMSO vehicle (control) or 1 μM pd032901 treatment in NSC growth media to assess mitochondrial superoxide production (A). Quantification of MitoSOX Red fluorescence intensity per cell; mean ± SEM, n = 3 independent experiments, each with at least three fields of view. C, D Representative IF images of CellROX and Mitotracker Red staining in WT and p66KO NSCs following 1 μM pd032901 treatment to assess ROS production and mitochondrial metabolism (D). Quantification of fluorescence using the ratio of CellROX/MitoTracker to assess the relative ROS production per metabolic unit; mean ± SEM, n = 3 independent experiments, each with at least three fields of view. E Effect of antioxidant N-acetyl cysteine (NAC) and mitoTEMPO (mTEMPO) concentrations on WT NSC viability during 1 μM pd032901 treatment, assessed by trypan blue exclusion assay; mean ± SEM, n = 3 independent experiments. F, G Flow cytometry analysis of annexin V and PI staining in WT NSCs following simultaneous treatment with 1 μM pd032901 and either 1 mM NAC or 5 μM mitoTEMPO for 24 h. Representative flow cytometry plots (F). Quantification of live (Q1), early apoptotic (Q2), and late apoptotic/necrotic cells (Q3/4) (G); mean ± SEM, n = 3 independent experiments. Statistics were obtained using two-way ANOVA: ns, p ≥ 0.05; *p < 0.05; **p < 0.01; ***p < 0.001.
Fig. 7
Fig. 7. Loss of p66Shc permits neuronal differentiation of NSCs during continuous MEK inhibition without influencing uncommitted or neuronal identities.
AD Representative IF images of WT and p66KO NSCs after EGF withdrawal (-EGF) or 18 h treatment with 1 μM pd032901 (MEKi), stained for NSC marker Nestin and neuronal commitment marker DCX (A). Quantification of live cells positive for each marker, assessing percentage of cells that are uncommitted NSCs (Nestin + /DCX−), neuronally committed (DCX+) and of unknown identity (Nestin-−/DCX−) (B). Percentage of condensed nuclei of each identity relative to the total number of cells of that identity to assess the sensitivity of each neural identity to EGF withdrawal (C) and MEK inhibition (D). Mean ± SEM, n = 3 independent experiments, each with at least three fields of view. E, G Effect of 7 days of continuous MEK inhibition on p66KO NSC identity. Representative phase contrast images of p66KO NSCs after 7-day treatment with 1 μM pd032901 (E). IF images of p66KO NSCs after 7-day treatment, stained for NSC marker Nestin, glial marker GFAP, and neuronal marker BIII-Tubulin (F). Quantification of cells positive for each marker, assessing percent of the cell population positive for Nestin, GFAP and BIII-Tubulin (G). Mean ± SEM, n = 3 independent experiments, each with at least three fields of view. Statistics were obtained using two-way ANOVA: ns, p ≥ 0.05; *p < 0.05; **p < 0.01; ***p < 0.001.
Fig. 8
Fig. 8. Summary of findings and proposed model positioning p66Shc within the intrinsic apoptotic cascade following MEK inhibition in neural stem cells.
A Summary of key experimental treatments and findings interrogating EGFR-ERK-mediated survival signalling in wild-type (WT; p66Shc+/+) and knockout (KO; p66Shc−/−) neural stem cells (NSCs). EGF withdrawal, EGFR inhibition (AG1478), and MEK inhibition (PD0325901) each induced apoptosis in WT NSCs but not in p66KO NSCs. These results identify ERK as the critical downstream effector of EGFR-mediated survival in NSCs. Notably, loss of ERK activity triggers apoptosis only in the presence of p66Shc, whereas NSCs lacking p66Shc evade cell death and instead proceed to neuronal differentiation. Created in BioRender. Lab, B. (2025) https://BioRender.com/yvuvlyb. B Schematic model of the intrinsic apoptotic cascade in response to MEK inhibition, highlighting differential pathway activation in WT (p66Shc+/+) and p66KO (p66Shc−/−) NSCs, and the proposed positioning of p66Shc within this cascade. Assessed apoptotic events are denoted by adjacent red arrows, with arrow size representing relative magnitude of change and “–” indicating limited or no significant change. Compared to WT NSCs, p66KO NSCs exhibit attenuated mitochondrial ROS production, reduced cytochrome c release, and impaired caspase-3 activation, despite equivalent ERK inhibition and comparable changes to BCL2 expression and phosphorylation. These differences position p66Shc downstream of ERK, likely at the level of the mitochondrion, and potentially also between caspase-9 activation and caspase-3 cleavage. The absence of p66Shc uncouples early apoptotic signalling from downstream execution, thereby conferring resistance to apoptosis induced by EGFR-ERK pathway disruption. Created in BioRender. Lab, B. (2025) https://BioRender.com/7sd195f.

Similar articles

References

    1. Yeo W, Gautier J. Early neural cell death: dying to become neurons. Dev Biol. 2004;274:233–44. - PubMed
    1. Miguel-Aliaga I, Thor S. Programmed cell death in the nervous system—a programmed cell fate?. Curr Opin Neurobiol. 2009;19:127–33. - PubMed
    1. Ryu JR, Hong CJ, Kim JY, Kim EK, Sun W, Yu SW. Control of adult neurogenesis by programmed cell death in the mammalian brain. Mol Brain. 2016;9:1–20. - PMC - PubMed
    1. Roth KA, D’Sa C. Apoptosis and brain development. Ment Retard Dev Disabil Res Rev. 2001;7:261–6. - PubMed
    1. Mazarakis N, Edwards A, Mehmet H. Apoptosis in neural development and disease. Arch Dis Child - Fetal Neonatal Ed. 1997;77:165–70. - PMC - PubMed

MeSH terms

Substances

LinkOut - more resources