. 2025 Jul 1;16(1):470.
doi: 10.1038/s41419-025-07814-7.

PKIB facilitates bladder cancer proliferation and metastasis through mediation of HSP27 phosphorylation by PKA

Affiliations

PKIB facilitates bladder cancer proliferation and metastasis through mediation of HSP27 phosphorylation by PKA

Xiaolong Liu et al. Cell Death Dis. .

Abstract

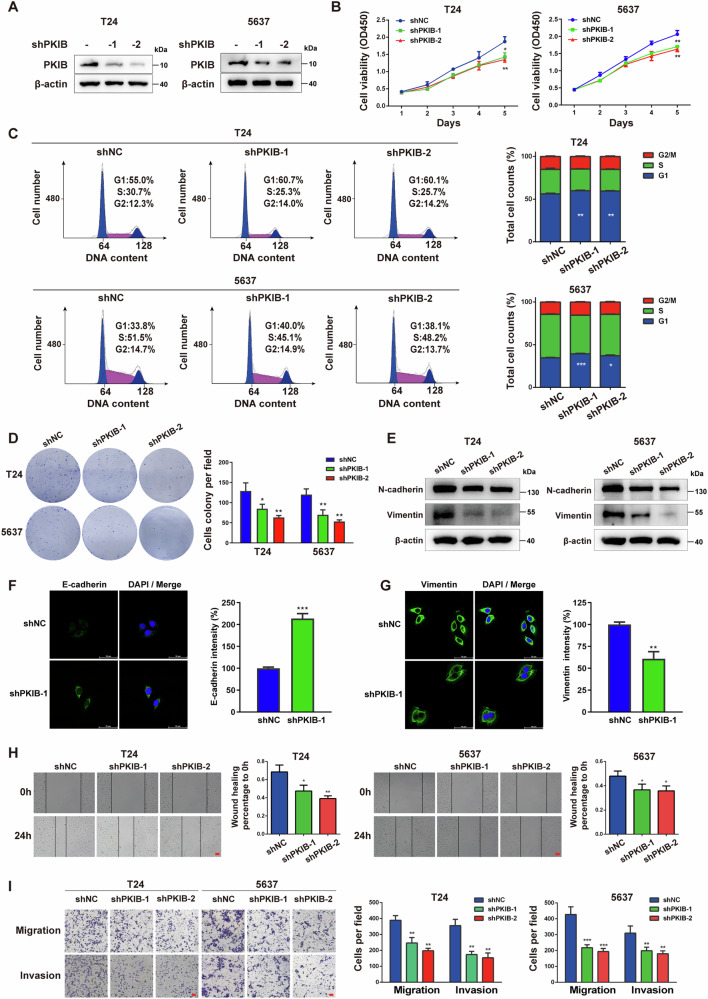
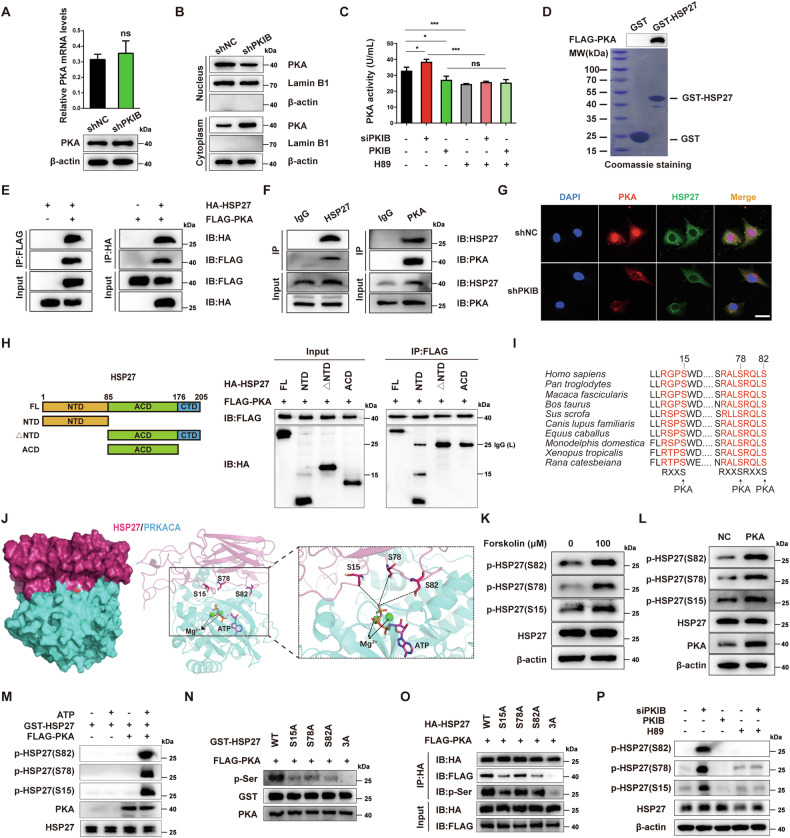
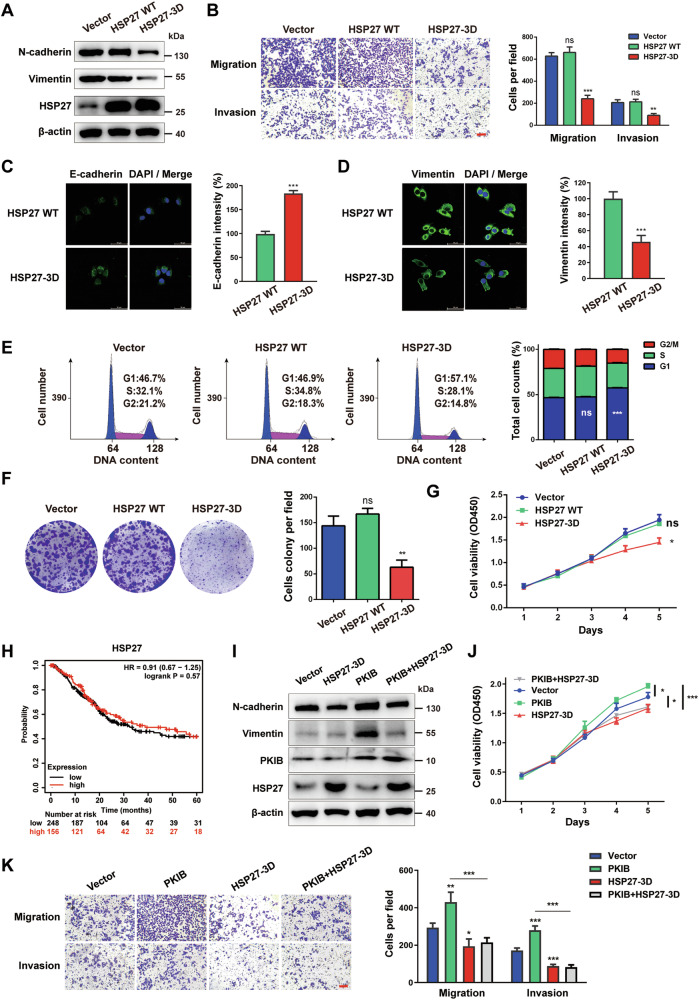
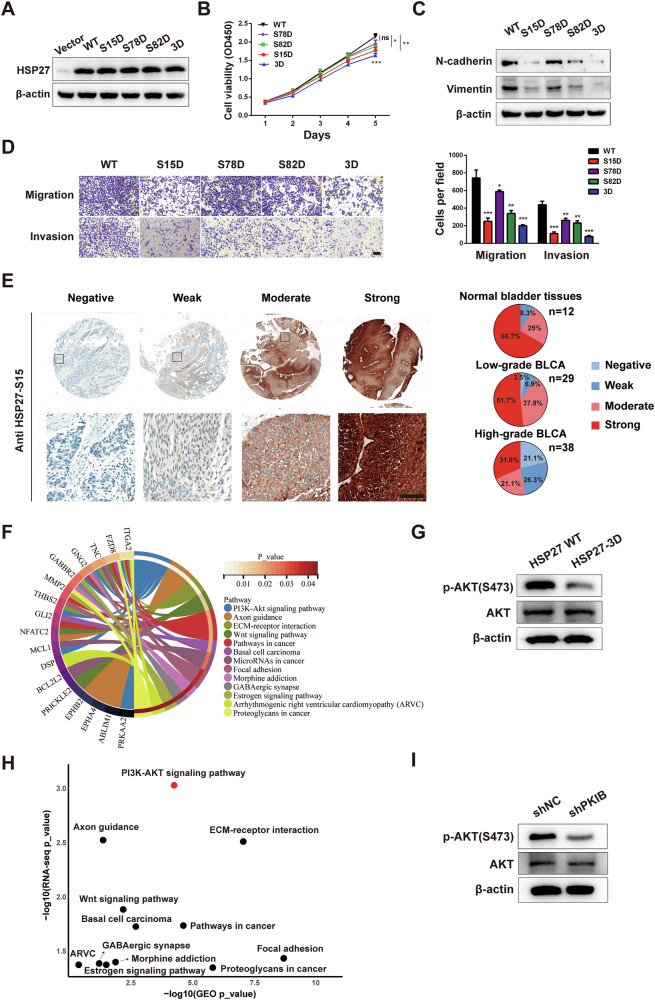
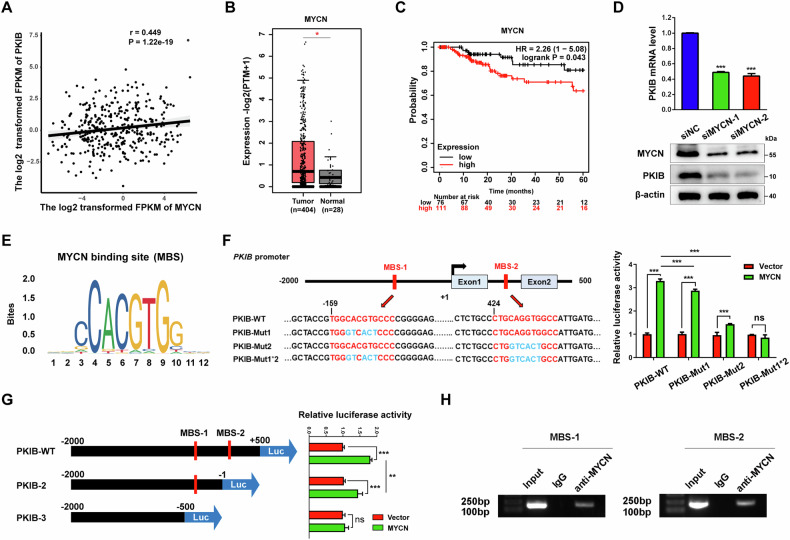
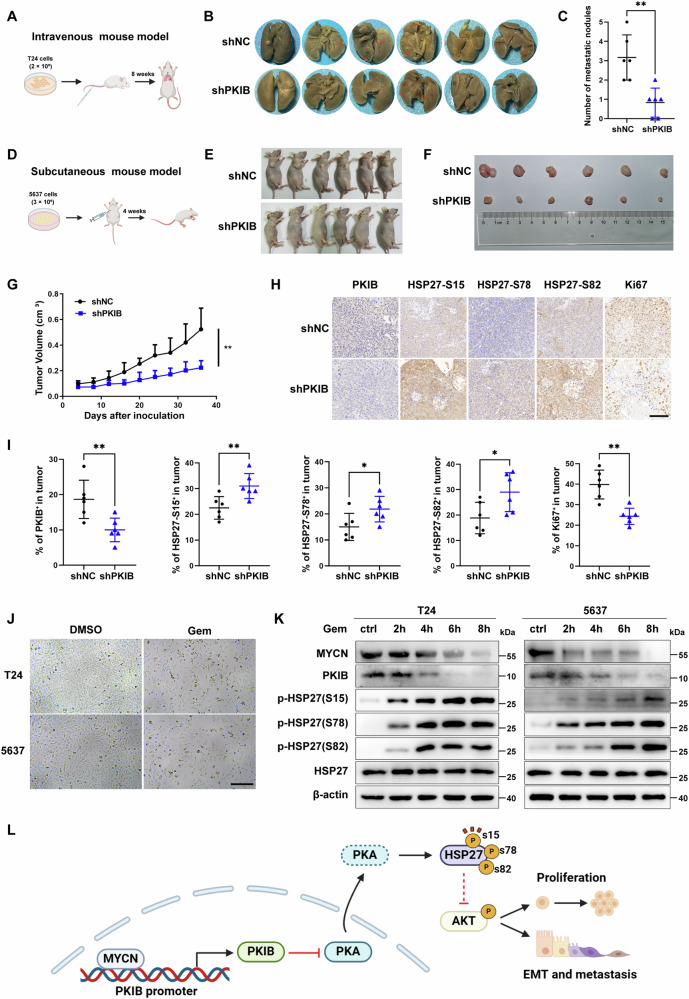
Cyclic AMP-dependent protein kinase A (PKA) is recognized for its pivotal involvement in various cancer types, with Protein Kinase Inhibitor Beta (PKIB) serving as an endogenous inhibitor that curtails PKA activity. Despite the documented escalation of PKIB expression in several malignancies, a comprehensive understanding of its precise mechanistic implications in human cancers remains elusive. This investigation is centered on bladder cancer (BLCA), unveiling an augmented expression of PKIB concomitant with heightened BLCA cell proliferation, migration, and invasion in vitro and augmented tumorigenic potential in an in vivo model. Mechanistically, PKIB disrupts PKA kinase activity, thereby resulting in diminished phosphorylation of the substrate target protein HSP27 at serine 15, 78, and 82. Additionally, the transcription factor MYCN exhibits an affinity for the PKIB promoter, leading to its enhanced expression in the context of BLCA. These findings reveal the oncogenic proclivity of PKIB and introduce a novel signalling pathway in BLCA, providing valuable insights into potential therapeutic targets for precise intervention.


Conflict of interest statement

Competing interests: The authors declare no competing interests. Ethical approval and consent to participate: Human BLCA tissues were collected after informed consent was obtained from all patients. The study protocol was conducted in accordance with the Declaration of Helsinki and has been approved by the Academic and Ethics Advisory Committee of the Second Affiliated Hospital of Soochow University (Approval No. [JD-LK-2019-104-01]). Animal experiments were conducted according to guidelines approved by the Animal Care and Use Committee of Soochow University. All animal experiments were approved by the Animal Care and Use Committee of Soochow University.

Figures

Fig. 1
Fig. 1. PKIB expression is associated with BLCA progression.
A The expression of PKIB in tumor samples was analysed via GEPIA2 (http://gepia2.cancer-pku.cn/#general). The samples highlighted in red and green indicate significant upregulation and downregulation of PKIB, respectively. Adrenocortical carcinoma (ACC), bladder urothelial carcinoma (BLCA), breast invasive carcinoma (BRCA), cervical squamous cell carcinoma and endocervical adenocarcinoma (CESC), cholangiocarcinoma (CHOL), colon adenocarcinoma (COAD), diffuse large B-cell lymphoma (DLBC), esophageal carcinoma (ESCA), glioblastoma multiforme (GBM), head and neck squamous cell carcinoma (HNSC), kidney chromophobe (KICH), kidney renal clear cell carcinoma (KIRC), kidney renal papillary cell carcinoma (KIRP), acute myeloid leukemia (LAML), brain lower grade glioma (LGG), liver hepatocellular carcinoma (LIHC), lung adenocarcinoma (LUAD), lung squamous cell carcinoma (LUSC), ovarian serous cystadenocarcinoma (OV), pancreatic adenocarcinoma (PAAD), pheochromocytoma and paraganglioma (PCPG), prostate adenocarcinoma (PRAD), rectum adenocarcinoma (READ), sarcoma (SARC), skin cutaneous melanoma (SKCM), stomach adenocarcinoma (STAD), testicular germ cell tumors (TGCT), thyroid carcinoma (THCA), thymoma (THYM), and uterine corpus cavernosum (UCEC). B mRNA expression analysis of PKIA, PKIB and PKIG in BLCA (n = 408) and normal tissue samples (n = 19) from the TCGA database. ** P = 0.0027, *** P < 0.0001, ns = not significant according to unpaired Student’s t test. C qRT‒PCR analysis of PKIA, PKIB and PKIG mRNA expression in BLCA and matched paracarcinoma tissues (n = 40). * P = 0.0264, ns = not significant according to unpaired Student’s t test. D Quantification of PKIB expression in 80 paired BLCA tissues and normal tissues by IHC analysis. P < 0.0001 according to unpaired Student’s t test. E K-M survival analysis of overall survival of patients with BLCA with low (staining intensity ≤1) versus high (staining intensity ≥2) PKIB expression. F Representative immunohistochemistry (IHC) images of PKIB-stained normal (n = 22) and different grade BLCA tissues (n = 75) are shown (left panel). Differential percentage of high-PKIB samples in normal and various BLCA tissues (right panel).
Fig. 2
Fig. 2. Knockdown of PKIB inhibits the proliferation, EMT, migration and invasion of BLCA cells.
A Western blot analysis of PKIB protein levels in T24 and 5637 cells stably transfected with a negative control vector (shNC) or the indicated shRNA-expressing vectors of PKIB (shPKIB). B Relative growth of T24 and 5637 cells with PKIB knockdown or empty vector transfection, as indicated, as determined by the CCK-8 assay. The data are shown as the means ± SD (n = 3). T24 shPKIB-1 *P = 0.0126, shPKIB-2 **P = 0.0045; 5637 shPKIB-1 **P = 0.0057, shPKIB-2, **P = 0.0053 by unpaired Student’s t test. C The cell cycle distribution was detected by PI staining in PKIB-silenced and control T24 and 5637 cells. The data are shown as the means ± SD (n = 3). T24 shPKIB-1 **P = 0.0041, shPKIB-2 **P = 0.0056; 5637 shPKIB-1 ***P = 0.0008, shPKIB-2, *P = 0.0163 by unpaired Student’s t test. D Representative images of colony formation assay of the indicated cell lines. The data are shown as the means ± SD (n = 3). T24 shPKIB-1 *P = 0.0289, shPKIB-2 **P = 0.0052; 5637 shPKIB-1 **P = 0.0093, shPKIB-2 **P = 0.0013 by unpaired Student’s t test. E The expression of the EMT markers N-cadherin and Vimentin was analysed via Western blotting. β-actin served as an internal control. F Representative IF images of E-cadherin in control and PKIB-silenced T24 cells (left panel). DNA was stained with DAPI (blue). Scale bar, 50 μm. Relative intensities (right panel). G Representative IF images of Vimentin in control and PKIB-silenced T24 cells (left panel). DNA was stained with DAPI (blue). Scale bar, 50 μm. Relative intensities (right panel). H A wound healing migration assay was performed with PKIB-silenced T24 and 5637 cells as well as control cells. Wound healing was recorded and quantified at least three times. The data are shown as the means ± SD (n = 3). T24 shPKIB-1 *P = 0.0208, shPKIB-2 **P = 0.0032; 5637 shPKIB-1 *P = 0.0358, shPKIB-2 *P = 0.0226 according to unpaired Student’s t test. Scale bar, 100 μm. I In Transwell assays, PKIB-silenced T24 and 5637 cells were allowed to migrate through an 8-μm porous membrane or invade through a Matrigel-coated membrane. After 24 or 48 h, migrating and invading cells were stained and counted in at least three microscopic fields. The data are shown as the means ± SD (n = 3). T24 Migration shPKIB-1, ** P = 0.0053; shPKIB-2, **P = 0.0015. T24 Invasion shPKIB-1, **P = 0.0020; shPKIB-2, **P = 0.0021. 5637 Migration shPKIB-1, ***P = 0.0009; shPKIB-2, ***P = 0.0004. 5637 Invasion shPKIB-1, **P = 0.0097; shPKIB-2, **P = 0.0047 by unpaired Student’s t test. Scale bar, 100 μm.
Fig. 3
Fig. 3. PKA directly interacts with HSP27 and phosphorylates HSP27 at serine 15, 78 and 82 in BLCA cells.
A qRT‒PCR and Western blot analyses of PKA expression in PKIB-silenced T24 cells. The data are shown as the mean ± SD (n = 3). Statistical analysis was conducted by unpaired Student’s t test. B Western blot analyses of PKA expression in the cytoplasmic and nuclear fractions extracted from PKIB-silenced T24 cells. β-actin and Lamin B1 served as loading controls for cytoplasmic and nuclear lysates. C T24 cells were transfected with siRNA against PKIB (siPKIB) or with a PKIB overexpression plasmid and treated with or without H89 as indicated. The lysates were collected to assess PKA activity. The data are shown as the mean ± SD (n = 3). *P < 0.05, **P < 0.01, ***P < 0.001, ns = not significant according to one-way ANOVA with Tukey’s multiple comparison tests. D Bacterially purified E. coli BL21 GST-HSP27 or GST protein was incubated with active FLAG-PKA for a GST pull-down assay. E The exogenous interaction between PKA and HSP27 was confirmed by Co-IP using anti-FLAG or anti-HA antibodies in HEK293T cells cotransfected with FLAG-PKA and HA-HSP27. F The endogenous interaction between PKA and HSP27 was determined by Co-IP using anti-PKA or anti-HSP27 antibodies in T24 cells. G Immunofluorescence analysis was performed to evaluate the colocalization of endogenous PKA (red) and HSP27 (green) in T24 cells with PKIB knockdown or empty vector transfection. The nuclei were stained with DAPI (blue). Scale bar, 25 μm. H Full-length and three truncated CDSs of HSP27 (denoted FL, NTD, △NTD, and CTD) were used for the construction of HA-tagged HSP27 expression vectors (left panel). The abovementioned HA-tagged HSP27 vectors and FLAG-tagged PKA vector were cotransfected into HEK293T cells as indicated for 48 h, after which the cells were subjected to Co-IP assays to detect the domains of HSP27 that interact with PKA (right panel). I The N-terminal amino acid sequences of HSP27 proteins from different species were aligned. The conserved serine 15 residue (S15), serine 78 residue (S78) and serine 82 residue (S82) are predicted to be potential PKA phosphorylation sites in above species. J The modeled structures of HSP27 (warmpink) and PRKACA (cyan) are shown as surfaces (left panel) and cartoons (right panel), respectively. The ATP and three potential phosphorylation sites (S15, S78 and S82) are represented as colored sticks, and the Mg2+ sites are shown as green spheres. K T24 cells were treated with forskolin as indicated for 1 h, then western blot analysis was used to determine the level of phosphorylated HSP27. L Western blot analysis of the phosphorylation level of HSP27 in T24 cells overexpressing PKA. M HEK293T cells were transfected with the FLAG-tagged PKA vector, followed by IP with anti-FLAG magnetic beads. Purified proteins were incubated with E. coli BL21 bacterially purified GST-HSP27 for the kinase assay, and immunoblot analysis was performed to measure the level of phosphorylated HSP27. N In vitro GST-HSP27 (WT or mutant) proteins were incubated with active FLAG-PKA for an in vitro kinase assay. The total amount of phosphorylated HSP27 was quantified via densitometry. O HA-tagged HSP27 (WT or mutant) vectors and the FLAG-tagged PKA vector were cotransfected into HEK293T cells as indicated for 48 h, after which the cells were subjected to IP with anti-HA magnetic beads to detect the binding of HSP27 mutants to PKA. P T24 cells were transfected with siPKIB or with the PKIB overexpression vector and treated with or without H89 as indicated. Immunoblot analysis was performed to detect the protein level of phosphorylated HSP27.
Fig. 4
Fig. 4. HSP27 overphosphorylation inhibits the proliferation, EMT, migration and invasion of BLCA cells.
A Western blot analysis of HSP27 and EMT markers (N-cadherin and Vimentin) protein levels in T24 cells stably transfected with a negative control vector (NC), wild-type HSP27 (HSP27 WT) or an HSP27-overexpressing mutant (HSP27-3D). B The migratory and invasive capabilities of the above-treated T24 cells were evaluated via Transwell assays. The data are shown as the mean ± SD (n = 3). **P = 0.0026, ***P = 0.0001, ns = not significant according to unpaired Student’s t test. Scale bar, 100 μm. C Representative IF images of E-cadherin in HSP27 WT and HSP27-3D T24 cells (left panel). DNA was stained with DAPI (blue). Scale bar, 50 μm. Relative intensities (right panel). D Representative IF images of Vimentin in HSP27 WT and HSP27-3D T24 cells (left panel). DNA was stained with DAPI (blue). Scale bar, 50 μm. Relative intensities (right panel). E The cell cycle distribution was detected in the above-described treated T24 cells. The data are shown as the mean ± SD (n = 3). ***P < 0.0001, ns = not significant according to unpaired Student’s t test. F Colony formation assay of HSP27-overexpression and HSP27 over-phosphorylation of T24 cells. The data are shown as the mean ± SD (n = 3). **P = 0.0040, ns = not significant according to unpaired Student’s t test. G CCK8 assay for HSP27-overexpressing and HSP27-overphosphorylation T24 cells. The data are shown as the mean ± SD (n = 3). **P = 0.0048, ns = not significant according to unpaired Student’s t test. H Kaplan-Meier survival curves (http://kmplot.com/analysis/) of patients with bladder carcinoma (n = 408) with high or low HSP27 expression. The log-rank test was used to analyse the difference between two groups. I T24 cells were cotransfected with PKIB and HSP27-3D and then subjected to Western blot analysis to detect the expression of PKIB, HSP27 and EMT markers (N-cadherin and Vimentin). J CCK8 assay of the above-treated T24 cells. The data are shown as the mean ± SD (n = 3). PKIB *P = 0.0216; PKIB + HSP27-3D *P = 0.0331; HSP27-3D *P = 0.0159; ***P = 0.0004, ns = not significant according to one-way ANOVA with Tukey’s multiple comparison tests. K The migratory and invasive capabilities of T24 cells cotransfected with PKIB and HSP27-3D were evaluated via Transwell assays. The data are shown as the mean ± SD (n = 3). Migration PKIB **P = 0.0092; HSP27-3D *P = 0.0449; ***P = 0.0005. Invasion PKIB ***P = 0.0001; HSP27-3D ***P = 0.0007. ***P < 0.0001 according to one-way ANOVA with Tukey’s multiple comparison tests. Scale bar, 100 μm. The numbers of migrated and invasive T24 cells are presented.
Fig. 5
Fig. 5. Overphosphorylation of HSP27 at residue 15 is more potent in BLCA cells inhibition.
A T24 cells were transfected with wild-type HSP27 or HSP27-S15A/S78A/S82A/3D mutants, then Western blot analysis of T24 cells with ectopic HSP27 expression was performed. B A CCK8 assay was used to assess the proliferation ability of the above-described treated T24 cells. The data are shown as the mean ± SD (n = 3). *P = 0.0467, **P = 0.0037, ***P = 0.0006, ns = not significant according to unpaired Student’s t test. C The expression of the EMT markers (N-cadherin and Vimentin) were analysed via Western blotting. D A transwell assay was performed to assess the migration and invasion of the above-described treated T24 cells. The data are shown as the mean ± SD (n = 3). Migration *P = 0.0414, **P = 0.0018, S15D ***P = 0.0009, 3D ***P = 0.0005; Invasion S15D ***P = 0.0002, S78D **P = 0.0026, S82D **P = 0.0016, 3D ***P <0.0001 according to unpaired Student’s t test. Scale bar, 100 μm. The numbers of migrated and invasive T24 cells are presented. E Representative immunohistochemistry (IHC) images of HSP27-S15 staining in normal and different grade BLCA tissues (left panel). Differential percentage of low HSP27-S15 expression in normal and various BLCA tissues (right panel). F Total RNA isolated from T24 cells overexpressing HSP27 or overphosphorylating HSP27 was subjected to RNA-seq analysis. Kyoto Encyclopedia of Genes and Genomes (KEGG) analysis revealed that HSP27 overphosphorylation in T24 cells downregulated the PI3K-AKT signaling pathway. The detailed relationships between the DEGs and major pathways annotated by KEGG are shown in the Circos graph. Differentially expressed genes with log2 FC > 2 were chosen for analysis and are shown on the left side of the graph. Representative signaling pathways are shown on the right. G Western blot analysis of total AKT and phosphorylated AKT S473 protein levels in T24 cells stably transfected with wild-type HSP27 or the 3D mutant. HSP27 overphosphorylation in T24 cells decreased the phosphorylation of AKT at serine 473. H The GEO database was used to screen for upregulated pathways in BLCA tissues overexpressing PKIB. Twelve signaling pathways were found to be upregulated by PKIB overexpression and downregulated by HSP27 phosphorylation. I Western blot analysis of total AKT and phosphorylated AKT S473 protein levels in PKIB-silenced T24 cells. PKIB knockdown in T24 cells reduces the phosphorylation of AKT at serine 473.
Fig. 6
Fig. 6. MYCN directly interacts with the PKIB promoter in BLCA cells.
A Correlation of MYCN and PKIB mRNA expression in BLCA tissues. The X- and Y-axes represent the log2-transformed FPKMs of MYCN and PKIB mRNA in BLCA tissues, respectively. B mRNA expression level of MYCN in BLCA and normal tissues in the TCGA database. (http://gepia2.cancer-pku.cn/#index). *P < 0.05. C Kaplan-Meier survival curves (http://kmplot.com/analysis/) of bladder cancer patients (n = 408) with high or low expression levels of MYCN. The log-rank test was used to analyse the difference between two groups. D qRT–PCR and Western blot analyses of PKIB mRNA and protein levels in MYCN-silenced T24 cells. qRT–PCR data are shown as the mean ± SD (n = 3). ***P < 0.0001 according to unpaired Student’s t test. E The conserved MYCN binding site (MBS) is shown (https://jaspar.genereg.net/matrix/MA0104.4/). F Schematic showing two predicted binding sites for MYCN in the PKIB promoter (upper left panel). Boxed areas indicate several PKIB promoter segments containing wild-type (PKIB-WT) or mutant MBS-1/2 (PKIB-Mut1, PKIB-Mut2, or PKIB-Mut1*2; lower left panel), which were subcloned and inserted into the pGL3-Luc reporter vector. The numbers indicate the location of the nucleotides of the PKIB promoter. The constructs were transiently transfected into 293 T cells overexpressing MYCN, after which luciferase activities were determined (right panel). The data are shown as the mean ± SD (n = 3). PKIB-WT vs PKIB-Mut1 ***P = 0.0003, others ***P < 0.0001, ns = not significant according to one-way ANOVA with Tukey’s multiple comparison tests. G Different fragments of the PKIB promoter (PKIB-WT, PKIB-2 and PKIB-3) were subcloned and inserted into the pGL3-Luc reporter vector (left panel), which was transiently transfected into 293 T cells overexpressing MYCN, after which luciferase activity was determined (right panel). The data are shown as the mean ± SD (n = 3). **P = 0.0018, PKIB-WT ***P < 0.0001, PKIB-2 ***P = 0.0018, ns = not significant according to one-way ANOVA with Tukey’s multiple comparison tests. H The ChIP assay was performed on T24 cells using an anti-MYCN antibody. An anti-IgG antibody was used as a negative control. The immunoprecipitated DNA fragment was subjected to PCR and analysis to determine the enrichment of MYCN.
Fig. 7
Fig. 7. Knockdown of PKIB suppresses BLCA cell metastasis and proliferation in vivo.
A Schematic flowchart of the in vivo metastasis model of BLCA cells. PKIB-silenced and control vector–transfected T24 cells (2 × 106 cells/mouse) were intravenously injected into BALB/c nude mice (6 mice per group). B Photographs of metastatic nodules established in mice after injection of indicated T24 cells for 8 weeks. Red arrowheads indicate metastatic nodules formed in lungs. C Plots showing the difference in lung metastatic nodules between the PKIB-silenced group and vector control group (6 mice per group). **P = 0.0021 by unpaired Student’s t test. D Schematic flowchart of the in vivo proliferation model of BLCA cells. PKIB-silenced and control vector–transfected 5637 cells (3 × 106 cells/mouse) were subcutaneously injected into BALB/c nude mice (6 mice per group). EG Xenograft tumorigenesis of PKIB-silenced T24 cells. Six nude mice were used for each group, and tumor growth curves were generated every 4 days. Images of tumors (E) and image of tumor volumes (F) in nude mice. G Growth curves of tumors formed by the indicated cells. **P = 0.0018 by unpaired Student’s t test. Representative immunohistochemistry (IHC) images (H) and quantitation (I) of mouse tumors showing PKIB, phosphorylation of HSP27 at S15, S78, S82 and Ki67. Scale bar, 100 μm. J T24 and 5637 cells were treated with 10 nM gemcitabine or DMSO for 24 h. Scale bar, 100 μm. K T24 and 5637 cells were treated with 10 nM gemcitabine for 0 h, 2 h, 4 h, 6 h or 8 h, then Western blot analysis were performed. L A schematic model showing that PKIB acts as a PKA inhibitor and inhibits PKA-mediated phosphorylation of HSP27 to promote tumor proliferation and metastasis.

Similar articles

References

    1. Kolch W, Halasz M, Granovskaya M, Kholodenko BN. The dynamic control of signal transduction networks in cancer cells. Nat Rev Cancer. 2015;15:515–27. - PubMed
    1. Gelens L, Qian J, Bollen M, Saurin AT. The importance of kinase-phosphatase integration: lessons from mitosis. Trends Cell Biol. 2018;28:6–21. - PubMed
    1. Naviglio S, Caraglia M, Abbruzzese A, Chiosi E, Di Gesto D, Marra M, et al. Protein kinase A as a biological target in cancer therapy. Expert Opin Ther Targets. 2009;13:83–92. - PubMed
    1. Tasken K, Skalhegg BS, Tasken KA, Solberg R, Knutsen HK, Levy FO, et al. Structure, function, and regulation of human cAMP-dependent protein kinases. Adv Second Messenger Phosphoprot Res. 1997;31:191–204. - PubMed
    1. Howe AK, Baldor LC, Hogan BP. Spatial regulation of the cAMP-dependent protein kinase during chemotactic cell migration. Proc Natl Acad Sci USA. 2005;102:14320–5. - PMC - PubMed

MeSH terms