. 2025 Jul 1;16(1):5489.
doi: 10.1038/s41467-025-60192-8.

A heterozygous CEBPA mutation disrupting the bZIP domain in a RUNX1 and SRSF2 mutational background causes MDS disease progression

Affiliations

A heterozygous CEBPA mutation disrupting the bZIP domain in a RUNX1 and SRSF2 mutational background causes MDS disease progression

Ruba Almaghrabi et al. Nat Commun. .

Abstract

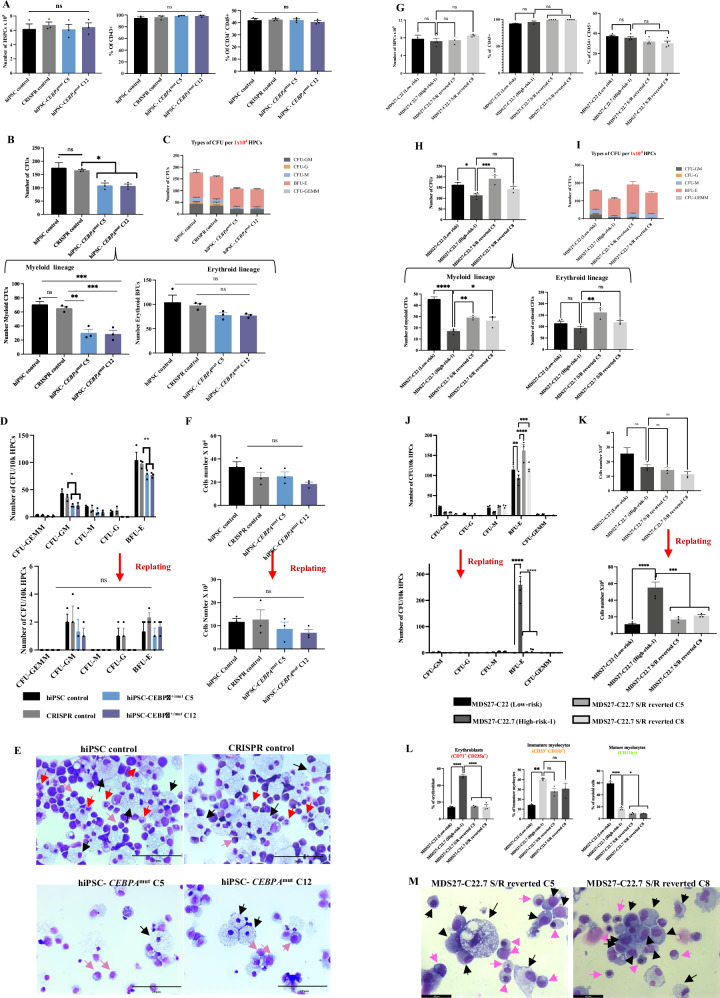
Myelodysplastic syndrome disease (MDS) is caused by the successive acquisition of mutations and thus displays a variable risk for progression to AML. Mutations in CEBPA are commonly associated with a high risk of disease progression, but whether they are causative for AML development is unclear. To analyse the molecular basis of disease progression we generated MDS patient-derived induced pluripotent stem cells from a low risk male patient harbouring RUNX1/SRSF2 mutations. This experimental model faithfully recapitulates the patient disease phenotypes upon hematopoietic differentiation. Introduction of a frameshift mutation affecting the C/EBPα bZIP domain in cells from low-risk stages mimicks disease progression by reducing clonogenicity of myeloid cells, blocking granulopoiesis and increasing erythroid progenitor self-renewal capacity. The acquisition of this mutation reshapes the chromatin landscape at distal cis-regulatory regions and promotes changes in cellular composition as observed by single cell RNAseq. Mutant C/EBPα is therefore causative for MDS disease progression. Our work identifies mutant CEBPA as causative for MDS disease progression, providing a new isogenic MDS experimental model for drug screening to improve diagnostic and therapeutic strategies.


Conflict of interest statement

Competing interests: Pablo Menendez is co-founder of OneChain Immunotherapeutics, a spin-off company from the Josep Carreras Leukaemia Institute. The remaining authors declare no competing interests.

Figures

Fig. 1
Fig. 1. Low-risk MDS27-hiPSC lines are able to differentiation into hematopoietic progenitors in semi-solid medium and into erythroid cells in the liquid culture.
A Genotyping screening for MDS27 patient sample taken at the time of diagnoses and after disease progression as well as for iPSC clones generated from the diagnosis MDS27 patient sample. Artwork generated with powerpoint Bundle-Biology. B Bar graph showing the total number of HPCs, percentage of early hematopoietic population (CD43+) and late hematopoietic population (CD34+ CD45+) on day 14 of differentiation. Statistical results are presented as mean ± SEM. ns = no significant, one-way ANOVA with Dunnett’s multiple comparisons. N = 4 independent experiments. Source data are provided as a Source Data file. C Total number of CFUs from 104 iPSC-HPC cells grown for 14 days in semi solid medium. Statistical results are presented as mean ± SEM. * p < 0.05, ** p < 0.001. Two-tailed unpaired t-test. N = 4 independent experiments. Exact p-values can be found in the Supplementary Data Table 5. D Number of each type of CFUs after 14 days in semisolid medium. Mean and SEM of different lines are shown. N = 4 independent experiments. Source data are provided as a Source Data file. E Relative percentage of each type of CFUs for 1 × 104 of HPCs after 14 days in semisolid media. Statistical results are presented as mean ± SEM and ****p < 0.0001, **p < 0.001, *p < 0.05, ns: no significant. Two-way ANOVA with Dunnett’s multiple comparisons. N = 4 independent experiments. Exact p-values can be found in the Supplementary Data Table 5. Source data are provided as a Source Data file. F Schematic representation of the experimental set up for the erythroid differentiation of HSPCs. Artwork generated with powerpoint Bundle-Biology. G Flow cytometry contour plots for CD71 and CD235a markers on Day 0, 4, 7, 11, 14 and 18 during erythroid differentiation. N = 4 independent experiments. Source data are provided as a Source Data file. H Percentage of erythrocyte (CD71+), erythroblasts (CD71+ CD235a+) and mature erythrocytes (CD235a+) during erythroid differentiation. Mean and SEM are shown (ns, no significant), two-way ANOVA with Dunnett’s multiple comparisons N = 4 independent experiments. Source data are provided as a Source Data file. I Diff-quick stained cytospins showing common aberrant morphology (black arrow) observe in MDS27-C22. The pictures were taken with a Leica DM6000 at ×100 magnification. N = 3 independent experiments. J Percentage of erythroid cells with aberrant morphology. Statistical results are presented as mean ± SEM. ***p < 0.0001 and *p < 0.05. Two-way ANOVA with Dunnett’s multiple comparisons. N = 4 independent experiments. Exact p-values can be found in the Supplementary Data Table 5. Source data are provided as a Source Data file. K May–Grunwald Giemsa staining stained bone marrow smears from MDS27 patient at the time of diagnosis showing aberrant erythroid cells. The pictures were taken with a Leica DM6000 at ×100 magnification. Taken from Supplementary Fig. 1A.
Fig. 2
Fig. 2. Erythroid-biased differentiation and increased self-renewal capacity of high-risk MDS-iPSC containing a C/EBPα bZIP frameshift mutation.
A Bar graph showing the total number of HPCs, percentage of early hematopoietic population (CD43+) and late hematopoietic population (CD34+ CD45+) on day 14 of differentiation. Total number of HPCs for normal and C22 taken from Fig. 1C. Statistical results are presented as mean ± SEM. ns = no significant, One-way ANOVA with Dunnett’s multiple comparisons. N = 4 independent experiments. Source data are provided as a Source Data file. B Percentage of hCD45+ cells (Left graph) engrafted in humanized niches implanted in NSG-SGM3 mice at 12 weeks. Each point represents an individual scaffold; each sample was transplanted into two mice, with technical replicates shown. Box plots display the full range of values (minimum to maximum), with the median indicated by a horizontal line. Lineage distribution (Right graph) within hCD45+ cells recovered from humanized niches in NSG-SGM3 mice. Bars represent mean values, and error bars indicate the standard error of the mean (SEM). Source data are provided as a Source Data file. C Total number of CFUs from 104 –iPSC-HPCsgrown for 14 days in semi-solid medium. Statistical results are presented as mean ± SEM. ****p < 0, ***p < 0.0001, **p < 0.001, *p < 0.05 and (ns, no significant). One-way ANOVA with Dunnett’s multiple comparisons. N = 4 independent experiments. Exact p-values can be found in the Supplementary Data Table 5. Source data are provided as a Source Data file. D Number of each type of CFUs after 14 days in semisolid medium. Mean and SEM of different lines are shown. N = 4 independent experiments. Source data are provided as a Source Data file. E Relative percentage of each type of CFUs for 1 × 104 of HPCs after 14 days in semisolid media. Statistical results are presented as mean ± SEM and ****p < 0.0001 and *p < 0.05, Two-way ANOVA with Dunnett’s multiple comparisons. N = 4 independent experiments. Exact p-values can be found in the Supplementary Data Table 5. Source data are provided as a Source Data file. F Representative flow cytometry panels showing the percentage of erythroblasts cells (blue square) (CD71+ CD235a+), immature myeloid cells, orange square (CD33+ CD11b+), and mature myeloid cells, green rectangle (CD11b+) obtained from colony assays. N = 3 independent experiments. Source data are provided as a Source Data file. G Fraction of erythroblasts (CD71+ CD235a+), immature myeloid (CD33+ CD11b+) and mature myeloid cells (CD11b+). Mean and SEM are shown. **** p < 0.0001, One-way ANOVA with Dunnett’s multiple comparisons. N = 3 independent experiments. Source data are provided as a Source Data file. H Diff-quick stained cytospins from colony assay showing erythroid cells (Red arrows), granulocytes (Green arrows) and monocytes (Pink arrows). The pictures were taken with a Leica DM6000 at ×40, 20 μm scale bar. N = 3 independent experiments. I Number of CFUs obtained from control, WT clones and mutant clones after second and third re-plating, each maintained for 14 days. Mean and SEM are shown. ****p < 0.0001, *p < 0.05, Two-way ANOVA with Dunnett’s multiple comparisons. N = 4 independent experiments. Exact p-values can be found in the Supplementary Data Table 5. Source data are provided as a Source Data file.
Fig. 3
Fig. 3. C/EBPα bZIP frameshift mutation on its own does not confer self-renewal capacity to healthy HPCs or to diseased HPCs after correction of SRSF2 and RUNX1 mutations.
A Bar graph showing the number of HPCs and percentage of early hematopoietic population (CD43+) and late hematopoietic population (CD34+ CD45+) on day 14 of differentiation. Statistical results are presented as mean ± SEM. ns = no significant, One way ANOVA with Dunnett’s multiple comparisons. N = 3 independent experiments. Source data are provided as a Source Data file. B Total number of CFUs from 104 iPSC-HPC cells grown for 14 days in semi-solid medium. Statistical results are presented as mean ± SEM. *p < 0.05; **p < 0.01, t-test. One-way ANOVA with Dunnett’s multiple comparisons. N = 3 independent experiments. Exact p-values can be found in the Supplementary Data Table 5. Source data are provided as a Source Data file. C Number of each type of CFU after 14 days in semisolid medium. Mean and SEM of different lines are shown. N = 3 independent experiments. Source data are provided as a Source Data file. D Number of CFUs obtained from healthy iPSC, healthy iPSC CRISPR control, and healthy iPSC clones containing C/EBPabZIP-fs (C5 and C12) after first and second re-plating, each maintained for 14 days. Mean and SEM are shown. **p < 0.001, *p < 0.05 and (ns, no significant), Two-way ANOVA with Dunnett’s multiple comparisons. N = 3 independent experiments. Exact p-values can be found in the Supplementary Data Table 5. Source data are provided as a Source Data file. E Diff-quick stained cytospins from colony assay showing erythroid cells (Pink arrows), granulocytes (Red arrows), and monocytes (black arrows). The pictures were taken with a Leica DM6000 at ×40, 20 μm scale bar. N = 3 independent experiments. F Bar graphs showing the number of cells obtained after the first and second replating. Statistical results are presented as mean ± SEM. ns, no significant, t test. One-way ANOVA with Dunnett’s multiple comparisons. N = 3 independent experiments. Source data are provided as a Source Data file. G Bar graph showing the number of HPCs and percentage of early hematopoietic population (CD43+) and late hematopoietic population (CD34+ CD45+) on day 14 of differentiation derived from MDS27-C22.7 S/R reverted (C5 and C8). Statistical results are presented as mean ± SEM. ns = no significant, One-way ANOVA with Dunnett’s multiple comparisons. N = 4 independent experiments. Data from C22 and C22.7 is taken from Fig. 2A. Source data are provided as a Source Data file. H Total number of CFUs from 104 iPSC-HPC cells grown for 14 days in semi-solid medium. Statistical results are presented as mean ± SEM. *p < 0.05; **p < 0.01, One-way ANOVA with Dunnett’s multiple comparisons. N = 3 independent experiments. Data from C22 and C22.7 is taken from Fig. 2B. Exact p-values can be found in the Supplementary Data Table 5. Source data are provided as a Source Data file. I Number of each type of CFUs after 14 days in semisolid medium. Mean and SEM of different lines are shown. N = 3 independent experiments. Data from C22 and C22.7 is taken from Fig. 2C. Source data are provided as a Source Data file. J Number of CFUs obtained from MDS27-C22.7 S/R reverted (C5 and C8) after first and second re-plating, each maintained for 14 days. Mean and SEM are shown. ****p < 0.0001, ***p < 0.001, **p < 0.01, Two-way ANOVA with Dunnett’s multiple comparisons. N = 3 independent experiments. Data from C22 and C22.7 is taken from Fig. 2H. Exact p-values can be found in the Supplementary Data Table 5. Source data are provided as a Source Data file. K Number of the single cells obtained after each replating. Statistical results are presented as mean ± SEM. ns= no significant ****p < 0.0001, ***p < 0.001, ns, no significant. One-way ANOVA with Dunnett’s multiple comparisons. N = 3 independent experiments. Data from C22 and C22.7 is taken from Supplementary Fig. 4C. Source data are provided as a Source Data file. L Fraction of erythroblasts (CD71+ CD235a+), immature myeloid (CD33+ CD11b+) and mature myeloid cells (CD11b+). Mean and SEM are shown. *p < 0.05; **p < 0.01; ****p < 0.0001; ns, no significant. One-way ANOVA with Dunnett’s multiple comparisons. N = 3 independent experiments. Exact p-values can be found in the Supplementary Data Table 5. Source data are provided as a Source Data file. M Diff-quick stained cytospins from colony assay showing erythroid cells (Pink arrows), and monocytes (Black arrows). The pictures were taken with a Leica DM6000 at ×63, 40 μm scale bar. N = 3 independent experiments.
Fig. 4
Fig. 4. High-risk MDS-iPSC containing a C/EBPα bZIP frameshift mutation exhibits a block in the granulocytic differentiation.
A Schematic representation of the myeloid differentiation protocol. Artwork generated with powerpoint Bundle-Biology. B Representative images of flow cytometric analysis of CD11b+ CD14 (granulocytes) and CD11b+ CD14+ (Monocytes) for the indicated cell types on day 0, day 4, and day 7 of differentiation. N = 4 independent experiments. Source data are provided as a Source Data file. C Percentages of CD11b+ CD14 (granulocytes) and CD11b+ CD14+ (Monocytes). Mean and SEM are shown ****p < 0.0001, *p < 0.05, and (ns, no significant). One-way ANOVA with Dunnett’s multiple comparisons. N = 4 independent experiments. Exact p-values can be found in the Supplementary Data Table 5. Source data are provided as a Source Data file. D Diff-quick stained cytospins showing the presence of granulocytic cells (green arrows) and erythroblasts (red arrows). The pictures were taken with a Leica DM6000 microscope at ×40 magnification, 20 μm scale bar. N = 4 independent experiments. E Diff-quick stained cytospin showing aberrant morphology of myeloid cells (black arrows) in MDS27-C22 (Low-risk) and MDS27 C22 CRISPR control. The pictures were taken with a Leica DM6000 microscope at ×100 magnification, 20 μm scale bar. N = 4 independent experiments. F May–Grunwald Giemsa stained bone marrow smears from MDS27 patient at disease progression showing aberrant myeloid cells (from Supplementary Fig. 1A). The pictures were taken with a Leica DM6000 at ×63 magnification. G RNA expression of C/EBPα, RUNX1, SPI1 (PU.1), GATA2 and LMO2 measured by qRT-PCR, normalized against the GAPDH housekeeping gene and expressed relative to HPCs expression. N = 3 independent experiments. Mean and SEM are shown ****p < 0.0001, ***p < 0.001, **p < 0.01, *p < 0.05, and (ns, no significant), Two-way ANOVA with Tukey’s correction. N = 3 independent experiments. Exact p-values can be found in the Supplementary Data Table 5. Source data are provided as a Source Data file.
Fig. 5
Fig. 5. Erythroid differentiation of high-risk MDS-iPSC containing a C/EBPα bZIP frameshift mutation reveals erythrodysplasia even after 5-Aza treatment.
A Percentage of early erythroid progenitor cells (CD71+), erythroblasts (CD71+ CD235a+) and mature erythrocytes (CD235a+) during several time points of erythroid differentiation. Mean and SEM are shown. **** <0.0001, **p < 0.001, *p < 0.05 and (ns, no significant), Two-way ANOVA with Dunnett’s correction. N = 4 independent experiments. Exact p-values can be found in the Supplementary Data Table 5. Source data are provided as a Source Data file. B Bar graph showing CD71 geometric mean (gMFI) of each cell line at day 18 of erythroid differentiation. Mean and SEM are shown. * p < 0.05, **p < 0.001. One-way ANOVA with Dunnett’s multiple comparisons. N = 4 independent experiments. Exact p-values can be found in the Supplementary Data Table 5. Source data are provided as a Source Data file. C Diff-quick stained cytospins showing erythroid dysplasia; Giant erythroblast (black arrow), Mitotic erythroblast (Grey arrows) in MDS27-C22.7 (High-risk-1) and MDS27-C22.20 (High-risk-2), Multinucleated erythroblast (green arrows), bi-nucleated erythroblast (blue arrows) and nuclear bridge (pink arrows). The pictures were taken with a Leica DM6000 microscope at ×100 magnification, 20 μm scale bar. N = 4 independent experiments. D Bar graph represents the percentage of the aberrant cells of MDS27 clones relative to the aberrant morphology of hiPSC control. Results are presented as mean ± SEM and ****p > 0.0001, Two-way ANOVA with Dunnett’s multiple comparisons. N = 4 independent experiments. Source data are provided as a Source Data file. E Bar graph represents the number of CFUs obtained from control, MDS27-C22 (Low-risk), and MDS27-C22.7 (high-risk) in the presence of different concentrations of 5-Aza or vehicle control (DMSO). Mean and SEM are shown. ****p < 0.0001, **p < 0.001, *p < 0.05 and (ns, no significant), Two-way ANOVA with Dunnett’s multiple comparisons. N = 3 independent experiments. Exact p-values can be found in the Supplementary Data Table 5. Source data are provided as a Source Data file. F Diff-quick stained cytospins from colony assay showing aberrant morphology in MDS27- C22.7 (high risk) after 5-Aza treatment; nuclear budding early orthochromatic erythroblasts (red arrow), bi-nucleated pronormoblast (green arrow), multinucleated basophilic erythroblast (blue arrows) and binucleated orthochromatic (nuclear bridge) (pink arrows). The pictures were taken with a Leica DM6000 microscope at ×63 magnification, 40 μm scale bar. N = 3 independent experiments. Source data are provided as a Source Data file. G May–Grunwald Giemsa stained bone marrow smears from MDS27 patient after receiving 3 rounds of Aza treatment showing aberrant erythroid cells. The pictures were taken with a Leica DM6000 at ×63 magnification. H Number of CFUs obtained from CD34+ sorted cells from MDS27 patient samples in normoxia (before and after disease progression) and hypoxia (after disease progression). Cell were maintained for each replating. Source data are provided as a Source Data file.
Fig. 6
Fig. 6. Changes in distal cis-regulatory elements in HPCs with C/EBPα mutation.
A Profiles of the ATAC-seq signals within each 2000-bp window centered on each peak for Day14 CD34+CD45+ HPC-iPSC derived from Low-risk MDS (C22) and from high-risk MDS (C22.7) (N = 2 independent experiments). Peaks are shown in order of decreasing log2 fold-difference between Low and High-risk samples (see the “Methods” section). Positions of transcription factor binding motifs are plotted alongside. B Motif enrichment analysis (Homer de novo motifs) for peaks only present in low-risk HPCs compared to unchanged peaks. C Motif enrichment analysis (Homer de novo motifs) for peaks only present in high-risk HPCs compared to unchanged peaks. D Pie chart showing the percentage of peaks at promoters and distal regulatory elements from peaks present in high-risk MDS HPCs only (left) or in low-risk MDS HPCs (right). E ATAC-seq UCSC genome browser screenshot depicting accessible chromatin sites being differentially regulated between the low- and high-risk HPCs. Red squares show differential ATAC-seq peaks between both conditions. Y-axis is set at 70 RPKM. F Profiles of the ATAC-seq signals within each 2000-bp window centered on each peak for CD34+ sorted cells from MDS27 patient samples before and after disease progression. Peaks are shown in order of decreasing log2-fold-difference between Low and High-risk samples (see the “Methods” section). Positions of transcription factor binding motifs are plotted alongside. G Motif enrichment analysis (Homer de novo motifs) for peaks only present in low-risk CD34+ cells compared to unchanged peaks. H Motif enrichment analysis (Homer de novo motifs) for peaks only present in high-risk CD34+ cells compared to unchanged peaks.
Fig. 7
Fig. 7. Distinct MDS transcriptome signature and changes in cellular composition during disease progression measured by single-cell transcriptome analysis.
A Analysis of scRNA-Seq data. Uniform Manifold Approximation and Projection for Dimensional Reduction (UMAP) map for individual samples. Each dot in the map represents a cell and is coloured according to cluster assignment. B Histogram showing the proportion of cells in each cell cycle phase within each cluster as identified by the expression of cell cycle-regulated genes. C 13 clusters based on the expression of specific genes. Cluster annotation was based on manual curation of marker genes. Each dot in the map represents a cell and is coloured according to cluster assignment. L = Low risk, H = high risk. D Table representing the number of cells in each cluster. Blue squares, clusters reduced during disease progression; red squares, clusters increased during disease progression; green squares, no change during disease progression. E Normalized enrichment scores (NES) calculated using gene set enrichment analysis (GSEA) with gene sets related to HSC and LSC signatures in single-cell RNA-Seq clusters 6 and 7, showing significant association with HSC and LSC signatures in these clusters (as indicated by a positive NES and Adjusted p-value < 0.1). NES and p-values were calculated using a permutation-based test (one-sided) using the GSEA software. F Expression of indicated genes projected on the UMAP map. Colour intensity represents expression data log2 normalized unique molecular identifier (UMI) counts. G Dot plots showing the scaled expression level of the indicted transcription factors in low-risk and high-risk MDS samples. Colours represent the scaled expression and size encodes the proportion of gene-expressing cells. H Dot plots showing the scaled expression level of the indicted myeloid genes in control and low-risk samples. Colours represent the scaled expression and size encodes the proportion of gene-expressing cells. I Monocle pseudo-time trajectory for MDS specific, myeloid, and erythroid cells projected on the UMAP map of scRNA clusters. Cells are coloured according to their pseudo-time value.

Similar articles

References

    1. Arber, D. A. et al. The 2016 revision to the World Health Organization classification of myeloid neoplasms and acute leukemia. Blood127, 2391–2405 (2016). - PubMed
    1. Steensma, D. P. Myelodysplastic syndromes current treatment algorithm 2018. Blood Cancer J.8, 47 (2018). - PMC - PubMed
    1. Walter, M. J. et al. Clonal architecture of secondary acute myeloid leukemia. N. Engl. J. Med.366, 1090–1098 (2012). - PMC - PubMed
    1. Walter, R. B. et al. Significance of FAB subclassification of “acute myeloid leukemia, NOS” in the 2008 WHO classification: analysis of 5848 newly diagnosed patients. Blood121, 2424–2431 (2013). - PMC - PubMed
    1. Papaemmanuil, E. et al. Clinical and biological implications of driver mutations in myelodysplastic syndromes. Blood122, 3616–3627 (2013). - PMC - PubMed

MeSH terms

Substances