. 2025 Jul 1;16(1):5706.
doi: 10.1038/s41467-025-60077-w.

DNA polymerase α/primase extraction from chromatin by VCP/p97 restricts ATR activation during unperturbed DNA replication

Affiliations

DNA polymerase α/primase extraction from chromatin by VCP/p97 restricts ATR activation during unperturbed DNA replication

Sara Rodríguez-Acebes et al. Nat Commun. .

Abstract

The replication stress response is an essential pathway that deals with the obstacles that halt the progression of DNA replication forks even during an unperturbed S phase. Basal activation of the ATR and CHK1 kinases prevents the premature firing of origins of replication during S phase, avoiding the activation of an excessive number of replication forks and the appearance of genomic instability. However, the mechanisms that regulate ATR activation in the unperturbed S phase have not been fully determined. Here we present evidence that the AAA ATPase VCP/p97 regulates the presence of the DNA polymerase α/Primase complex (POLA/PRIM) on chromatin, thus limiting its activity and hampering the subsequent activation of ATR by TOPBP1. As a consequence, inhibiting VCP/p97 activates ATR and CHK1 and leads to a cell cycle arrest in G2/M. We propose that the priming activity of POLA/PRIM in the lagging strand is one of the determinants of the basal activation of ATR during an unperturbed S phase and VCP/p97 limits this activation through the extraction of POLA/PRIM from chromatin.


Conflict of interest statement

Competing interests: The authors declare no competing interests.

Figures

Fig. 1
Fig. 1. VCP/p97 is necessary for DNA replication.
A, B Flow cytometry analysis of DNA content (DAPI) and DNA replication (EdU) in HCT116 cells, synchronized, released for 3 h and treated with 2 and 5 μM NMS873 (VCPi) for 3 h (A) or with 5 μM NMS873 (VCPi) for 3/6 h (B). One out of two representative experiments is shown. CH DNA fiber analysis in HCT116 cells, synchronized, released for 2 h, treated for 2 h with 10 μM NMS873 (VCPi) or DMSO (control). C To measure fork rate (FR) and origin firing, cells were sequentially incubated with CldU and IdU for 20 min. FR was measured by the length of the IdU track. Origin firing (1st label origins) was measured as the percentage of CldU tracks flanked by IdU tracks. D, E show FR and 1st label origins upon treatment with 5 μM NMS873 (VCPi) for 2 h or DMSO (control, C). The pool (fork rate, bars represent the median of the pooled, ***p = 0.0006, Mann–Whitney test) or the average (1st label origins, %, mean ± SD, **p = 0.0022, t test) of three experiments is shown. Symbols note the median of individual experiments. F For fork (CldU/IdU) and origin asymmetry (long/short), cells were sequentially incubated with CldU for 10 min and IdU for 30 min. The ratio of the track lengths CldU/IdU (CldU/IdU ratio) was used to follow fork stalling and the ratio of long and short IdU tracks arising from the same origin (long/short ratio) was used to follow origin asymmetry. G and H show the CldU/IdU ratio and long/short ratio upon treatment with 5 μM NMS873 (VCPi) for 2 h or DMSO (control, C). The pool of three independent experiments is shown. Bars represent the median of the pooled data. Symbols note the median of individual experiments. ****p < 0.0001 in (G, H), Mann–Whitney test. I Western blot analysis of whole cell extracts obtained from HCT116 cells, synchronized, released for 2 h and treated with 2 mM hydroxyurea (HU), 10 μM NMS873 (VCPi), a combination of both (HU-VCPi) or DMSO (lane 1, C). The indicated proteins were measured with specific antibodies. One of two repetitions is shown. Source data are provided as a Source Data file.
Fig. 2
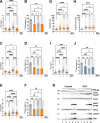
Fig. 2. Distinct effects of VCP/p97 in origin firing and fork progression.
AF DNA fiber analysis in HCT116 cells, synchronized, released for 2 h and treated for 2 h with: 10 μM VCPi, 150 μM dNTP, a combination of both or DMSO as a control (A, B); 10 μM VCPi, 20 μM CDC7i, a combination of both or DMSO (C, D); 10 μM VCPi, 0.5 μM POLAi, a combination of both or DMSO (E, F). FR (A, C, E) and 1st label origins (B, D, F) were determined. G, H DNA fiber analysis in cells synchronized, released for 2 h and treated for 2 h with: 10 μM VCPi, 0.5 μM POLAi, a combination of both or DMSO. CldU/IdU ratio (G) and long/short ratio (H) were determined. Individual data for the long/short ratio are shown in Supplementary Fig. 2B–E. I, J DNA fiber analysis in cells synchronized, released for 2 h and treated for 2 h with 0.5 μM POLAi, 20 μM CDC7i, a combination of both or DMSO. FR (I) and 1st label origins (J) were determined. For all DNA fiber analysis three independent experiments were performed; dot plots show pooled data and bars represent the median (FR, CldU/IdU and long/short fork) and bar graphs (1st label origins) plot the mean ± SD. The median of individual experiments is noted with different symbols both in dot plots and bar graphs. *p < 0.05; **p < 0.01; ***p < 0.001; ****p < 0.0001; ns, non-significant, in Kruskall–Wallis with Dunn’s post-test (A, C, E, G, H, I) or one-way ANOVA followed by Tukey’s test (B, D, F, J). K Western blot analysis of whole cell extracts from HCT116 cells, synchronized, released for 2 h and treated for 2 h with increasing concentrations of POLAi (0.1, 0.2, 0.5, 1 μM) alone or in combination with 10 μM VCPi. The levels of total and phosphorylated CHK1 (S345), total and phosphorylated RPA2 (S4/S8), phosphorylated H2AX (γH2AX) and total histone H2A were measured with specific antibodies. The experiment was repeated three times and one representative result is shown. Source data are provided as a Source Data file.
Fig. 3
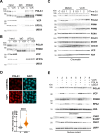
Fig. 3. VCP/p97 extracts POLA/PRIM to limit the replication stress response activation upon origin firing.
A, B Western blot analysis of the immunoprecipitation of PRIM2 (A) and UFD1L (B) from whole nuclear extracts from HCT116 cells, synchronized, released for 2 h and treated for 3 h with 5 μM NMS873 (VCPi) or DMSO as a control (marked as C). 2% of the input material is shown and a non-specific IgG was used as a negative control. The levels of POLA1, PRIM2, VCP/p97 and UFD1L were analyzed with specific antibodies; UBC9 was used as control. One representative experiment out of 4 replicates is shown. C Western blot analysis of the chromatin fraction from HCT116 cells, synchronized, released for 2 h (marked as C) and treated for the indicated times in the presence of 5 μM NMS873 (VCPi) or DMSO (DMSO). The levels of POLA1, POLA2, PRIM1, PRIM2, PCNA, POLD1, MCM5, CDC45 and VCP/p97 were analyzed with specific antibodies; histone H2A was used as control. One representative experiment out of 3 replicates is shown. D Immunofluorescence analysis in HCT116 cells, synchronized, released for 2 h and treated for 2 h with 5 μM NMS873 (VCPi) or DMSO (Control). After pre-extraction of the soluble nuclear material, POLA1 was detected with specific antibodies. Nuclei were counterstained with DAPI and the scale bar indicates 25 μM. The graph shows the pool of three experiments, the median for the pooled data and the individual medians noted with different symbols. ****p < 0.0001 in Mann–Whitney test. E Western blot analysis of the chromatin and nuclear soluble fractions from HCT116 cells, synchronized, released for 2 h and treated for 2 h with 5 μM NMS873 (VCPi), 0.5 μM adarotene (POLAi), 20 μM XL413 (CDC7i), combinations of these drugs or DMSO as a control. The levels of POLA1, PRIM2 and total RPA2 were analyzed in chromatin using histone H2A as a control; the levels of total and phosphorylated CHK1 (S345) were analyzed in the nuclear soluble fraction using USP7 as a control. One representative experiment out of 7 replicates is shown. Source data are provided as a Source Data file.
Fig. 4
Fig. 4. VCP/p97 cooperates with POLA/PRIM to control DNA replication and the replication stress response.
HCT116 cells were transfected with a non-specific siRNA (siC) or a combination of individual siRNA directed against POLA1, POLA2, PRIM1 and PRIM2. 24 h after transfection cells were synchronized, released for 2 h and treated with 5 μM NMS873 (VCPi) for 2 h or DMSO as control. A, B DNA fiber analysis of HCT116 cells depleted of POLA/PRIM. FR (A) and 1st label origins (B) were determined. C Western blot analysis of whole cell extracts measuring the levels of total and phosphorylated CHK1 (S345), total and phosphorylated RPA2 (S4/S8), phosphorylated H2AX (γH2AX), VCP/p97 and histone H2A as control. The experiments were repeated five times and one representative result is shown. D Densitometric quantification of the levels of phosphorylated CHK1 (S345) normalized to the levels of total CHK1 in 5 independent experiments from Fig. 4C. Mean ± SD is plotted; *, p = 00278 in t-test. E, F DNA fiber analysis in HCT116 cells depleted of POLA/PRIM. CldU/IdU ratio (E) and long/short ratio (F) were determined. Individual data for the long/short ratio are shown in Supplementary Fig. 5B-E. For all DNA fiber analysis three independent experiments were performed; dot plots show pooled data and bars represent the median (FR, CldU/IdU and long/short fork) and bar graphs (1st label origins) plot the mean ± SD. The median of individual experiments is noted with different symbols both in dot plots and bar graphs. *p < 0.05; ****p < 0.0001; ns, non-significant, in Kruskall–Wallis with Dunn’s post-test (A, E, F) or one-way ANOVA followed by Tukey’s test (B). Source data are provided as a Source Data file.
Fig. 5
Fig. 5. VCP/p97 activates the RSR through POLA/PRIM.
A Model for the action of VCP/p97 during an unperturbed S phase. POLA/PRIM is loaded to chromatin and generates primed DNA that activates ATR in a TOPBP1 dependent manner. VCP/p97 extracts POLA/PRIM from the lagging strand to limit the activation of CHK1. B Western blot analysis of whole extracts purified from HCT116 cells, synchronized, released for 2.5 h, treated for 10 min with increasing concentrations of adarotene (POLAi), and then treated for 2 h with 5 μM NMS873 (VCPi), increasing concentrations of adarotene (POLAi), a combination of these drugs or DMSO as a control (marked as double negative). The levels of total and phosphorylated Chk1 (S345), total and phosphorylated RPA2 (S4/S8), and VCP/p97 were measured with specific antibodies. The experiment was repeated three times and one representative result is shown. C Flow cytometry analysis of the cell cycle progression showing histograms for DNA content by DAPI staining in HCT116 cells, synchronized, released for 3 h and treated for 9 h with 5 μM NMS873 (VCPi), 2.5 μM LY2603618 (CHK1i), a combination of both (VCPi-CHK1i) or DMSO as a control. Source data are provided as a Source Data file.
Fig. 6
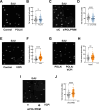
Fig. 6. VCP/p97 limits priming by POLA/PRIM.
Comet assay on nascent DNA labelled with EdU. Cells were incubated with 30 μM EdU for 60 min, and EdU was conjugated to a fluorescent probe after alkaline comet assay. A, B HCT116 cells were synchronized, released for 2.5 h and treated for 2 h with 0.5 μM adarotene (POLAi) or DMSO as a control. Representative images are shown in (A) and quantification in (B). C, D HCT116 cells were transfected with a non-specific siRNA (siC) or a combination of individual siRNA directed against POLA1, POLA2, PRIM1 and PRIM2. 24 h after transfection cells were synchronized, released for 3 h and incubated with EdU. Representative images are shown in (C) and quantification in (D). E, F HCT116 cells were synchronized, released for 2.5 h and treated for 2 h with 5 μM NMS873 (VCPi) or DMSO as a control. Representative images are shown in (E) and quantification in (F). G, H HCT116 cells were synchronized, released for 2.5 h and treated for 2 h with 0.5 μM adarotene (POLAi) alone or in combination with 5 μM NMS873 (VCPi). Representative images are shown in (G) and quantification in (H). I, J HCT116 cells were transfected with a combination of individual siRNA directed against POLA1, POLA2, PRIM1 and PRIM2. 24 h after transfection cells were synchronized, released for 2.5 h HCT116 cells and treated for 2 h with 5 μM NMS873 (VCPi) or DMSO as a control. Representative images are shown in (I) and quantification in (J). In all cases the dot plots show pooled data of at least 4 experiments and bars represent the median of pooled data. The individual medians of independent experiments are noted with different symbols. **p < 0.01; ****p < 0.0001; ns, non-significant, in Mann–Whitney test (B, D, F, H, J). Source data are provided as a Source Data file.

References

    1. Lecona, E. & Fernández-Capetillo, O. Replication stress and cancer: it takes two to tango. Exp. Cell Res.329, 26–34 (2014). - PMC - PubMed
    1. Zeman, M. K. & Cimprich, K. A. Causes and consequences of replication stress. Nat. Cell Biol.16, 2–9 (2014). - PMC - PubMed
    1. Cortez, D. Replication-coupled DNA repair. Mol. Cell74, 866–876 (2019). - PMC - PubMed
    1. Lecona, E. & Fernandez-Capetillo, O. Targeting ATR in cancer. Nat. Rev. Cancer18, 586–595 (2018). - PubMed
    1. Simoneau, A. & Zou, L. An extending ATR-CHK1 circuitry: the replication stress response and beyond. Curr. Opin. Genet. Dev.71, 92–98 (2021). - PubMed

MeSH terms

LinkOut - more resources