. 2025 Jul 1;16(1):5697.
doi: 10.1038/s41467-025-60613-8.

Transcriptional landscape of the cell cycle in a model thermoacidophilic archaeon reveals similarities to eukaryotes

Affiliations

Transcriptional landscape of the cell cycle in a model thermoacidophilic archaeon reveals similarities to eukaryotes

Miguel V Gomez-Raya-Vilanova et al. Nat Commun. .

Abstract

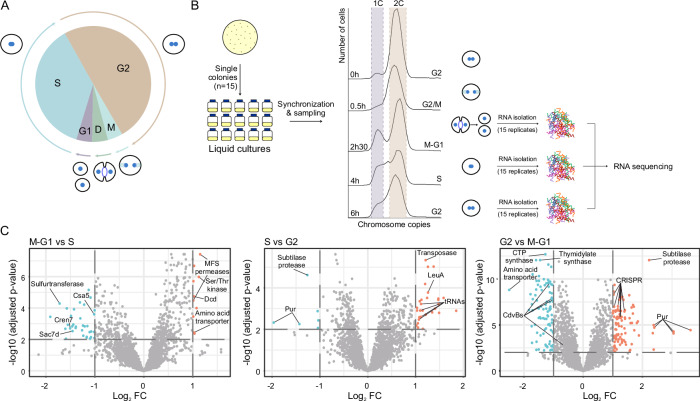
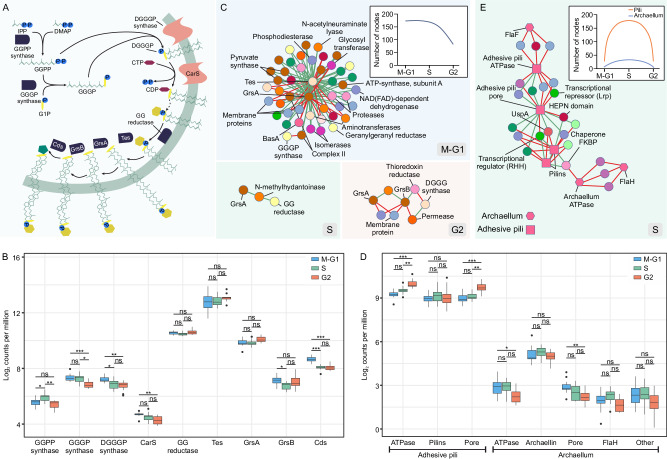
Similar to many eukaryotes, the thermoacidophilic archaeon Saccharolobus islandicus follows a defined cell cycle program, with two growth phases, G1 and G2, interspersed by a chromosome replication phase (S), and followed by genome segregation and cytokinesis (M-D) phases. To study whether and which other processes are cell cycle-coordinated, we synchronized cultures of S. islandicus and performed an in-depth transcriptomic analysis of samples enriched in cells undergoing the M-G1, S, and G2 phases, providing a holistic view of the S. islandicus cell cycle. We show that diverse metabolic pathways, protein synthesis, cell motility and even antiviral defense systems, are expressed in a cell cycle-dependent fashion. Moreover, application of a transcriptome deconvolution method defined sets of phase-specific signature genes, whose peaks of expression roughly matched those of yeast homologs. Collectively, our data elucidates the complexity of the S. islandicus cell cycle, suggesting that it more closely resembles the cell cycle of certain eukaryotes than previously appreciated.


Conflict of interest statement

Competing interests: The authors declare no competing interests.

Figures

Fig. 1
Fig. 1. Overview of the transcriptional landscape across cell cycle phases.
A The cell cycle of an exponentially growing Saccharolobus cell. Cell cycle phases occupy an area proportional to their typical duration. Morphological changes occurring throughout the cell cycle are depicted next to the corresponding phases. B Experimental workflow for the transcriptomic analysis. Fifteen S. islandicus colonies were isolated and inoculated in liquid medium. The corresponding cultures were synchronized and samples collected at the indicated time points. The cell cycle phase at each sampled time point was determined by evaluating the genomic content of the cells using flow cytometry in three replicates (a representative profile is shown). The total RNA was extracted and sequenced for each of the 15 cultures during the time points corresponding to the enrichment in cells undergoing the M-G1, S and G2 phases. C Differential gene expression by pair-wise comparison of the three analyzed phases (M-G1, S and G2) represented using volcano plots. The y-axis represents the adjusted p value in logarithmic scale in base 10. The x-axis represents the fold change (FC) between the two phases in logarithmic scale in base 2. The horizontal lines mark the thresholds for significance, i.e., a p value of <0.01 (-log10(0.01) = 2). The vertical lines mark the thresholds for strong differential expression, i.e., FC of 2 (log2(±2) = ± 1). Statistical significance is extracted from the DGE analysis (Supplementary Data 1), where it was calculated with the limma package and p values were adjusted for multiple comparisons using the Benjamini-Hochberg method. Genes of interest are marked with general annotations.
Fig. 2
Fig. 2. Core network of S. islandicus.
A Violin plots of the expression of the genes included in the core network throughout the three phases: M-G1, S and G2. A dashed horizontal line marks the average of the M-G1 phase as a reference. The expression of each gene corresponds to the average of 15 biological replicates, the expression of 411 core genes included in the DGE analysis is plotted in each violin plot. In the box plots, the center line represents the median; the box limits, the first and third quartiles; whiskers extend 1.5 times the interquartile range; data beyond the whiskers are outliers represented as points. Statistical significance was calculated by a two-sided paired Wilcoxon test. *** = p value < 0.0001. p values M-G1 vs S = 5.03e-18, M-G1 vs G2 = 6.1e-27. B Functional classification of the core genes. Genes were annotated and classified using the arCOG framework (see Methods). Correspondence between the letter code and the name of each category is provided in Supplementary Data 1. The different categories are grouped into four classes. C Topological representation of the core network. Each node is colored according to its arCOG category following the same color coding as in (B). D Essentiality of the genes in the core network compared to the non-core genes. Compartmentalization of the genes in the core network compared to the non-core genes. E Compartmentalization of the genes in the core network compared to the non-core genes. Information on compartmentalization of the genome was extracted from data obtained previously. F Conservation of the genes in the core network compared to the non-core genes. Genes were assigned to four categories: (i) exclusive to Saccharolobus, (ii) restricted to Sulfolobales, (iii) conserved across Thermoproteota, and (iv) present in Thermoproteota and Methanobacteriota, Halobacteriota and Thermoplasmatota. Statistical significance was calculated by performing a Chi-square test. *** = p value = 6.347e-10.
Fig. 3
Fig. 3. Cell cycle phase specific processes.
A Classification of the strongly differentially expressed genes in each pair-wise comparison by arCOG category. Genes were annotated and classified using the arCOG framework (see Methods). Genes included in the graph were only those strongly differentially expressed, i.e., their fold change (FC) was at least ±2 and their adjusted p value was <0.01. Statistical significance is extracted from the DGE analysis (Supplementary Data 1), where it was calculated with the limma package and p values were adjusted for multiple comparisons using the Benjamini-Hochberg method. The number of genes is shown on the x-axis, genes to the right of the vertical axis are upregulated in the corresponding comparison, while genes to the left are downregulated. B Specific co-expression during the S phase. GCN of the S phase with the specific nodes highlighted, grouped and colored by arCOG category (see Supplementary Fig. S5 for GCNs of the M-G1 and G2 phases). C Differences in the metabolism between phases. A full metabolic map of S. islandicus was extracted from the KEGG database (accession number: sir01100 [https://www.kegg.jp/pathway/sir01100]). Each dot represents a metabolite while each line represents the enzymes that transform those metabolites. Each pathway is classified into six groups depending on their peak of activity according to the KEGG enrichment and DGE analysis: (i) ‘All’, if their activity does not change, (ii) ‘M-G1’, (iii) ‘S’ or (iv) ‘G2’, if their activity peaks at each of the corresponding phases, and (v) ‘M-G1/S’ or (vi) ‘S/G2’, if their activity increased at the M-G1 or S phases and was maintained high into the following phase. Different pathways of interest are labeled on the map next to their metabolites.
Fig. 4
Fig. 4. Changes in membrane biogenesis, motility and adhesion across the cell cycle.
A Major steps of membrane biogenesis in S. islandicus. Dashed line represents possible modifications the polar head may have. IPP, isopentenyl pyrophosphate; DMAP, dimethylallyl monophosphate; GGPP, geranylgeranyl diphosphate; GGGP, geranylgeranylglyceryl phosphate; G1P, glycerol-1-phosphate; DGGGP, digeranylgeranylglyceryl phosphate; Tes, tetraether synthase; Cds, calditol synthase. B Expression of membrane biogenesis enzymes. Box plot of the expression of the enzymes in the 15 replicates. The center line represents the median; the box limits, the first and third quartiles; whiskers extend 1.5 times the interquartile range; data beyond the whiskers are outliers represented as points. Statistical significance is extracted from the DGE analysis, calculated with the limma package and p values were adjusted for multiple comparisons using the Benjamini-Hochberg method. * = p value ≤ 0.01. ** = p value ≤ 0.001. *** = p value ≤ 0.0001. Exact p values are in Supplementary Data 1. C Gene co-expression subnetworks of membrane biogenesis enzymes. Subnetworks contain only those nodes that co-express with at least two membrane biogenesis enzymes. Nodes are colored by arCOG category as in Fig. 2B, positive edges are green and negative edges, red. C inset. Line plot representing the number of nodes of the subnetwork of all genes co-expressing with the membrane biogenesis enzymes. D Expression of adhesive pili and archaellum. Box plot of their expression in the 15 replicates as in (B). Statistical significance as in (B). E Gene co-expression subnetwork at the S phase of the adhesive pili and archaellum. The subnetwork contains only those nodes that co-express with at least two of their components. Coloring as in (C). E inset. Line plots represent the number of nodes of the subnetworks of all genes co-expressing with the adhesive pili and the archaellum.
Fig. 5
Fig. 5. Defense systems are expressed cyclically.
A Organization of the different defense cassettes in the S. islandicus REY15A genome. CRISPR-Cas and Hma loci of REY15A are shown with different color-coded boxes. A diagonal dotted dash indicates a gap between the genes or cassettes. B Expression of the different defense related genes and cassettes throughout the cell cycle. Pair-wise comparisons between phases are represented in three volcano plots. The y-axis represents the adjusted p value in logarithmic scale in base 10. The x-axis represents the fold change (FC) between the two phases in logarithmic scale in base 2. The horizontal lines mark the threshold for significance, i.e., a p value of <0.01 (-log10(0.01) = 2). The vertical lines mark the threshold for strong differential expression, i.e., FC of 2 (log2(±2) = ± 1). Statistical significance is extracted from the DGE analysis (Supplementary Data 1), where it was calculated with the limma package and p values were adjusted for multiple comparisons using the Benjamini-Hochberg method. Defense genes and cassettes are highlighted and color-coded. C Gene co-expression subnetworks of the defense components. The subnetworks are extracted from the full GCNs by maintaining only those nodes that co-express with at least two defense-related (CRISPR-Cas or hma) genes. Nodes are colored by arCOG category following the same color code as in Fig. 2B, while edges are colored green if the co-expression is positive and red if it is negative. C inset. Size of the co-expression subnetwork of the CRISPR-Cas interference cassettes and the Hma cassette throughout the cell cycle. Line plot representing the number of nodes of the subnetwork of all genes co-expressing with the Cmr-β, the Cascade, the Cmr-α and the Hma cassettes at each of the phases of the cell cycle.
Fig. 6
Fig. 6. Cell cycle of S. islandicus.
A Circular heatmap of the signature genes identified via a transcriptome deconvolution method. The predicted expression estimated by transcriptome deconvolution was normalized in between phases and genes were clustered based on k-means into four different groups depending on whether they tended to be more highly expressed at one of the three phases studied (groups 1–3) or displayed uniform expression throughout the cell cycle (group 4). The clusters of genes were represented in a circular heatmap with their normalized expression using the circlize R package. Genes are ordered by arCOG category and their arCOG class (information storage and processing, cellular processes and signaling or metabolism) is marked in the graph. In a clockwise order starting at 6 o’clock, genes clustering as peaking at M-G1 are shown first, then those peaking at S and finally those that do at G2. Genes of interest are marked with their annotations next to the heatmap. B Graphical summary of the changes occurring during the cell cycle. The core and housekeeping processes which are maintained throughout the cycle are shown in the center of the graphic, whereas the phase-specific processes are depicted at the periphery. The presumed morphological states at each of the cell cycle phases are also depicted.

Similar articles

Cited by

References

    1. Wang, Z. Cell cycle progression and synchronization: an overview. Methods Mol. Biol.2579, 3–23 (2022). - PubMed
    1. Reyes-Lamothe, R. & Sherratt, D. J. The bacterial cell cycle, chromosome inheritance and cell growth. Nat. Rev. Microbiol17, 467–478 (2019). - PubMed
    1. Cezanne, A., Foo, S., Kuo, Y. W. & Baum, B. The archaeal cell cycle. Annu Rev. Cell Dev. Biol.10.1146/annurev-cellbio-111822-120242 (2024). - PMC - PubMed
    1. McQuillen, R. & Xiao, J. Insights into the structure, function, and dynamics of the bacterial cytokinetic FtsZ-Ring. Annu Rev. Biophys.49, 309–341 (2020). - PMC - PubMed
    1. Hurley, J. H. ESCRTs are everywhere. EMBO J.34, 2398–2407 (2015). - PMC - PubMed

LinkOut - more resources