. 2025 Jul 1;16(1):5531.
doi: 10.1038/s41467-025-60445-6.

Type 1 interferon signature and allograft inflammatory factor-1 contribute to refractoriness to TNF inhibition in ankylosing spondylitis

Affiliations

Type 1 interferon signature and allograft inflammatory factor-1 contribute to refractoriness to TNF inhibition in ankylosing spondylitis

Woogil Song et al. Nat Commun. .

Abstract

Ankylosing spondylitis (AS) is a chronic inflammatory arthritis that primarily affects the enthesis and may culminate in bony ankylosis of the spine. Despite TNF inhibitor (TNFi) being foundational in managing active inflammation, 30-40% of patients with AS remain non-responsive. Through longitudinal and multi-omics profiling of peripheral blood mononuclear cells from TNFi-receiving patients with AS, here we reveal that elevated type I IFN signatures at baseline are associated with poor TNFi response, leading to a paradoxical enhancement of IFN signatures and Th17 responses following TNFi therapy. Among type I IFN-related genes, we identify and validate AIF-1 as a predictive biomarker reflecting the inherent IFN signature that differentiates responders from non-responders. AIF-1 also contributes to an inflammatory cycle by increasing IFNα receptor expression and Th17 responses. In summary, our findings advocate for a personalized approach to managing AS by considering individual variations in AIF-1 levels and IFN signatures.


Conflict of interest statement

Competing interests: Eun Young Lee is a consultant for Samsung Bioepis and IMBiologics. The remaining authors declare no competing interests.

Figures
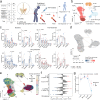
Fig. 1
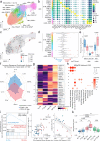
Fig. 1. Comprehensive analysis of single-cell profiles of PBMCs in TNFi-treated patients with AS.
a Schematic of the study design, showing blood sample collection from 167 patients with ankylosing spondylitis (AS) before and after TNFi treatment. This includes a discovery cohort (n = 32), of which 22 patients (responders: R_Pre, R_Post, n = 12; non-responders: NR_Pre, NR_Post, n = 10) underwent scRNA-seq analysis, as well as validation cohort 1 (n = 18) and validation cohort 2 (n = 117). Figure created with BioRender. Created in BioRender. https://BioRender.com/q70l192. b UMAP of single-cell RNA sequencing data from PBMCs (n = 199,926), revealing 10 major cell clusters colored according to cell type. c Comparisons between pre- and post-treatment within the same group (R, NR) were performed using the Wilcoxon matched-pairs signed rank test or a paired t-test, while comparisons between different groups (R_Pre vs. NR_Pre, R_Post vs. NR_Post) used a two-sided Mann-Whitney U test or an unpaired t-test, based on normality. In the cluster names, “CD14 M” and “CD16 M” refer to CD14⁺ and CD16⁺ monocytes, respectively, and “prolif” indicates proliferating cells. Bar plots indicate means, and error bars represent standard deviation (SD). Exact p-values for CD14 Monocyte and NK cell comparisons within responders are 0.00012 and 0.00029, respectively (Wilcoxon matched-pairs signed rank test, two-sided). d Milo analysis comparing PBMC neighborhoods (k = 45) between NR and R baselines. Red indicates neighborhoods more abundant in the NR group, and blue indicates neighborhoods more abundant in the R group. Nhood size corresponds to circle size, and overlap size corresponds to line thickness. e Neighborhood function that uses community detection to partition neighborhoods, showing automatic grouping of 15 Nhood groups in different colors. f Visualization of differential abundance (DA) fold changes in different neighborhoods, focusing on the distribution in PBMCs: cytotoxic (CTX), proliferating (PRF), central memory (CM), and effector memory (EM). Statistical testing for differential abundance utilized the quasi-likelihood F-test implemented in edgeR (two-sided), with spatial FDR controlled using a weighted Benjamini–Hochberg method. g Pearson correlation coefficient analysis of TNFi-induced changes. Responder pairs (n = 12), non-responder pairs (n = 10); error bars indicate standard error. Statistical significance was tested using the Wilcoxon matched-pairs signed rank test (two-sided). Source data are provided as a Source Data file.
Fig. 2
Fig. 2. Elevated type 1 IFN signature in baseline monocytes of non-responders.
a UMAP of CD14+ or CD16+ monocytes (n = 52,218), with 13 clusters identified and color-coded, including classical (cMo), intermediate (intMo), and non-classical (ncMo) monocytes. b Dot plot showing the average expression of marker genes for each monocyte cluster. c Milo analysis UMAP comparing non-responders (NRs) and responders (Rs), with red indicating higher abundance in NRs and blue indicating a higher abundance in Rs. Neighborhoods with a spatial FDR < 0.5 are plotted in the figure. Cells are depicted as circles proportional in size to the number of cells contained. d Beeswarm and box plots illustrating log2-fold differences across neighborhoods. Boxplot center lines represent medians, boxes show interquartile ranges (IQR), whiskers extend to the smallest and largest values within 1.5 × IQR from the box edges, and points beyond whiskers indicate outliers. e Boxplots comparing baseline proportions between groups (R_Pre, n = 12; NR_Pre, n = 10). Statistical tests were two-sided t-test or Wilcoxon tests, depending on normality. Boxplot definitions as in panel d. Data are presented as mean ± standard deviation. f Radar plot showing -log(adjusted P value) of the top 5 cytokines from Immune Response Enrichment Analysis for EGR1hi cMo and CXCL10hi cMo. FDR-adjusted p-value from two-sided Wilcoxon rank-sum test. g K-means clustering of DEGs in monocytes, showing the relative expression under different conditions. Significant modules are highlighted in red. h Pathway analysis of each module using MSigDB HallMark 2020, showing the top 3 significant pathways per module. Red intensity indicates the significance, and circle size represents the enrichment score. Statistical analysis using MAST (two-sided), BH-adjusted. i, Gene Ontology analysis of DEGs between R_Pre and NR_Pre. Blue represents R_Pre, and red represents NR_Pre enriched ontology, BH-adjusted. j Correlation analysis of the IFNα response score with CXCL10hi cMo cluster and delta ASDAS. Spearman correlation was used for the cluster score and Pearson correlation for delta ASDAS, both two-sided. Shaded bands represent 95% confidence intervals. k Bar graphs showing the average IFNα score (paired samples: R n = 12, NR n = 10, IL-17i n = 10) per sample, compared across conditions. Source data are provided as a Source Data file.
Fig. 3
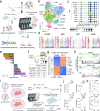
Fig. 3. Identification of AIF-1 as a delimiting soluble marker for the IFN signature in non-responders.
a Correlation of ISGhi ncMo proportion with IFNα score and delta ASDAS. P values were calculated using Pearson correlation (two-sided), shaded bands represent 95% confidence intervals. Left, the black line indicates the overall correlation slope, and the gray lines indicate the NR (steeper slope) and R groups. b Volcano plot comparing ISGhi ncMo and ncMo. Thresholds were set at absolute log2 fold change of 0.25 and adjusted P value of 0.05 (MAST (two-sided, BH adjustment)). c Experimental design to validate AIF-1 as a predictive biomarker of the response to treatment with TNF inhibitor (TNFi). Figure created with BioRender.com. Created in BioRender. https://BioRender.com/q70l192. d Gene expression of AIF1 by qRT-PCR compared between Rs (n = 10) and NRs (n = 8) using PBMCs from TNFi-treated SpA patients in the validation cohort 1 at baseline (Welch two-sample t-test (two-sided)). Data are presented as mean ± standard deviation. e Baseline serum level of AIF-1 measured by ELISA compared between Rs (n = 69) and NRs (n = 48), two-sided Mann-Whitney test. Three different criteria (BASDAI50, ASAS40, and ASAS20) were used to determine the clinical response at week 14. Data are presented as mean ± standard deviation. f, g ROC curve of baseline serum AIF-1 levels for predicting a non-response at week 14 (f), odds ratio analysis of serum AIF-1 levels for TNFi response prediction. The gray diamond represents the unadjusted odds ratio, while the red diamond represents the adjusted odds ratio, accounting for age, initial BASDAI, CRP, and ESR in the logistic regression model. After adjustment, the odds ratio remained significant at 6.96 (95% CI). Error bars indicate 95% confidence intervals, with center points representing odds ratios (unadjusted, gray; adjusted, red) (g). h Validation of baseline serum AIF-1 levels in an independent cohort (Validation cohort 3, n = 58). Data shown as mean ± standard error; statistical significance assessed by Wilcoxon rank sum test. Exact P-value = 3.64e-06. i Change in serum AIF-1 between week 0 (baseline) and week 14 after initiating TNFi (R n = 59, NR n = 39), two-sided t-test. Source data are provided as a Source Data file.
Fig. 4
Fig. 4. AIF-1 induces IFN response in monocytes and promotes Th17 responses.
a Schematic of the experimental design. PBMCs from healthy donors (n = 4) were treated with AIF-1 or control (Ctl) and subjected to scRNA-seq. In addition, CD14+ monocytes were isolated from PBMCs using CD14 Microbeads and treated with AIF-1 or Ctl, followed by bulk RNA sequencing. Created in BioRender. https://BioRender.com/q70l192. b UMAP of monocytes from AIF-1-treated PBMCs, revealing 10 clusters (n = 2245). c Dot plot showing the average expression of key markers in each cluster from AIF-1-treated UMAP. d Violin plot of log-normalized expression values for SLAMF7, GBP1, IRF7, and ISG20. e Bar plots showing the proportion of each cluster in AIF-1-treated versus Ctl PBMCs, represented as the AIF-1/Ctl ratio. f Dot plot comparing the expression of IFNAR1 and IFNGR1 between AIF-1 treated monocytes and control monocytes. The accompanying table summarizes the average log2 fold change (avg_log2FC), Bonferroni-adjusted p-value (adj p-value), and expression levels (exp) in AIF-1 treated versus control cells. (Wilcoxon rank sum test, two-sided). g Heatmap showing the expression of inflammatory cytokines (e.g., IL1B, IL6, IL-23) in monocytes treated with AIF-1 versus Ctl as determined by bulk RNA sequencing. h GSEA plot of DEGs from bulk RNA-seq, highlighting monocyte-derived dendritic cells (Mo-DCs) and BDCA1+ DC markers. i Schematic overview of the experimental design. THP-1 monocytes were transfected with siRNA targeting AIF1 (siAIF1) or scrambled control siRNA via liposomal carrier-based transfection. Created in BioRender. https://BioRender.com/q70l192. j Bulk RNA-seq analysis (n = 4) comparing the expression of AIF1 and Th17-promoting cytokines (IL1B, IL6, IL23A) between control and AIF1 knockdown (KD) THP-1 cells. Statistical comparisons performed t-test and Wilcoxon test (two-sided). Exact p-values: AIF1 = 2.68e-5, IL6 = 1.37e-5, IL23A = 7.30e-5. k FACS analysis comparing the proportion of IL-17A+ and IFNγ+ populations within memory CD4+ T cells between control and siAIF1-treated conditions (n = 5, biological replicates). Statistical significance assessed by paired t-test (two-sided). Figure 4a and i created with BioRender. Source data are provided as a Source Data file.
Fig. 5
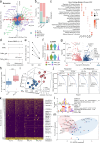
Fig. 5. Paradoxical enhancement of the IFN response in non-responders post-TNFi treatment.
a A plot of DEGs in monocytes for responders (Rs) and non-responders (NRs) before and after treatment with TNF inhibitor (TNFi). Each point represents a gene, colored by gene type as indicated in the lower right legend. b Bar graphs showing the proportion of genes in each quadrant, specifically highlighting R_only and NR_only genes. c Dot plot of Gene Ontology analysis for significant genes based on their response pattern, showing the top 5 terms per group, with red indicating higher significance. (Wilcoxon rank sum test (BH adjustment, two-sided)). d Schematic of in vitro experiments to assess the effect of adalimumab (ADA). Human PBMCs from four individuals were treated with TNFα for 12 h, followed by IgG1 control or ADA for 6 h prior to scRNA-seq. e The proportion change in the CXCL10hi cMo cluster in response to ADA treatment, with each dot representing one sample (n = 4, biological replicates). f Violin plots of normalized expression of SLAMF7 and JUN across four conditions. g A volcano plot of DEGs between ADA and control (IgG1), with red indicating downregulated genes and blue indicating upregulated genes (BH-adjusted P value). h Boxplots comparing the average expression of ADA-upregulated gene modules in Rs and NRs. Boxplot comparison (R n = 10, NR n = 12), two-sided t-test. i A 3D plot of baseline patient status defined by three variables, with arrows indicating the Pearson correlation between IFNα score and delta ASDAS (upper left) and between the score and ADA-upregulated module (lower right). Each point represents a patient (blue for R, red for NR). j Plots of regulon specificity scores (RSS) based on the AUC in each condition. The top 10 regulons with the highest RSS are indicated by red circles. k Heatmap with binarized regulon activity. Regulons that showed significant differences between pre- and post-TNFi in the NR group are highlighted with red boxes. l Motif logos of the highest normalized enrichment score (NES) motifs for key transcription factors in the R and NR groups. m A PCA plot illustrating the contribution of different programs to the separation of Rs and NRs and their changes post-TNFi treatment, with ADA-up representing in vitro ADA-upregulated modules. Statistical analyses were performed using the unpaired t-test. Source data are provided as a Source Data file.
Fig. 6
Fig. 6. In vitro experiments corroborate that specific IFNα-related features are observed in the NR model.
a In vitro bulk RNA-seq experimental design. CD14+ monocytes were isolated from human PBMCs and treated with combinations of cytokines and adalimumab (ADA) to create six conditions before harvest and library construction. ‘I’ denotes IFNα and ‘T’ denotes TNFα. b Heatmap of DEGs identified through k-means clustering across six conditions. Modules are named and characterized on the left. Statistical confirmation was performed using the MAST algorithm (Seurat implementation), with significance determined by Bonferroni-adjusted P < 0.05 and a log2FC > 0.1. c Heatmap showing the relative comparison of modules scored against 11 CD14+ monocyte clusters from patients with AS. Columns are ordered based on the Euclidean distance. d Bar plots showing the pathway analysis and TF analysis for module 4, with the top three P value terms highlighted. Terms with an adjusted P < 0.05 are in green; non-significant terms are in gray. Combined scores were calculated by multiplying the Fisher exact test log(P value) by the z-score of the deviation from the expected rank. (BH adjustment, two-sided) e Venn diagram of ADA-upregulated genes in the R and NR models. Roman numeral I denotes R model-specific genes, II denotes genes upregulated in both models, and III denotes NR model-specific genes, with counts provided. Bar graphs show the counts and proportion of genes upregulated by IFNα added to TNFα or to control within each category.f Line graph of deconvoluted proportions (n = 3) from in vitro bulk RNA-seq data using patient data as the reference. Key clusters from patient data are in bold. Error bars represent the standard error of the mean (SEM). g Box plot comparing the cosine similarity of deconvoluted data for the key clusters in bold from the I + T condition between R_Pre and NR_Pre samples (R n = 12, NR n = 10) and analyzed using the Wilcoxon rank sum exact test. Boxplot definitions as in Fig. 2d. Source data are provided as a Source Data file.
Fig. 7
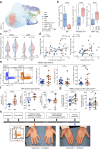
Fig. 7. Non-responders have higher levels of activated Th17 cells, with AIF-1 contributing to this increase.
a UMAP of memory CD4+ T cells (n = 17,777) from TNF inhibitor (TNFi)-treated patients, displaying eight distinct clusters. b Boxplots (R n = 12, NR n = 10) comparing effector memory (EM, Wilcoxon two-sided), activated Th17, and MAFlo Treg clusters (two-sided t-test) in the R and NR baselines. Boxplot definitions as in Fig. 2d. c Violin plots showing normalized expression levels of RORA and CD69 in activated Th17 cells. (Wilcoxon rank-sum test, two-sided, BH adjustment) d Plots showing the correlation between CXCL10hi cMo and the activated Th17 and MAFlo Treg clusters. Pearson and Spearman correlations (two-sided); shaded bands represent 95% confidence intervals. e, f Serum AIF-1 concentrations higher or lower than the cut-off of 63.5 pg/ml were denoted as ‘High’ (n = 12 patients with AS) or ‘Low’ (n = 16 patients with AS), respectively. PBMCs were stimulated by anti-CD3 antibody and anti-CD28 antibody for 6 h, and the CD4+CD45RA- population was considered memory CD4+ T cells. e Proportions of IL-17A+, IFNγ+, and IL-17A+IFNγ+ cells among memory CD4+ T cells were measured by flow cytometry after intracellular cytokine staining (ICS). Two contour plots show representative cases of AIF-1 high (AIF-1hi) and low (AIF-1lo) among patients with AS. Data are presented as mean ± standard deviation. (Two-sided t-test) f Serum cytokine changes compared between AIF-1hi (above cut-off) and AIF-1lo groups (AIF1 low, n = 4; AIF1 high, n = 8; two-sided t-test) among TNFi-treated patients with AS. Changes from baseline to week 14 are shown as percentages and are presented as mean ± standard deviation. g TNFi was added to AIF-1-stimulated and control PBMCs from active patients with AS (n = 10) stimulated with anti-CD3 antibody and anti-CD28 antibody for 6 h. Data are presented as mean ± standard deviation. (two-sided t-test) h Summary of the clinical history of the patient with AS who experienced paradoxical psoriasis after initiating TNFi and improvement with IL-17 inhibitor secukinumab, including the immunophenotype of memory CD4+ T cells (left contour plot), clinical photos, and serum AIF-1 level. Source data are provided as a Source Data file.

References

    1. Rudwaleit, M. et al. The development of assessment of SpondyloArthritis international Society classification criteria for axial spondyloarthritis (part II): validation and final selection. Ann. Rheum. Dis.68, 777–783 (2009). - PubMed
    1. Rudwaleit, M. et al. The Assessment of SpondyloArthritis International Society classification criteria for peripheral spondyloarthritis and for spondyloarthritis in general. Ann. Rheum. Dis.70, 25–31 (2011). - PubMed
    1. Sieper, J. et al. Axial spondyloarthritis. Nat. Rev. Dis. Prim.1, 15013 (2015). - PubMed
    1. Kehl, A. S., Corr, M. & Weisman, M. H. Review: Enthesitis: New Insights Into Pathogenesis, Diagnostic Modalities, and Treatment. Arthritis Rheumatol.68, 312–322 (2016). - PMC - PubMed
    1. Taurog, J. D., Chhabra, A. & Colbert, R. A. Ankylosing Spondylitis and Axial Spondyloarthritis. N. Engl. J. Med374, 2563–2574 (2016). - PubMed

MeSH terms