

Response time of global deltas to changes in fluvial sediment supply
- PMID: 40593527
- PMCID: PMC12219431
- DOI: 10.1038/s41467-025-60531-9
Response time of global deltas to changes in fluvial sediment supply
Abstract
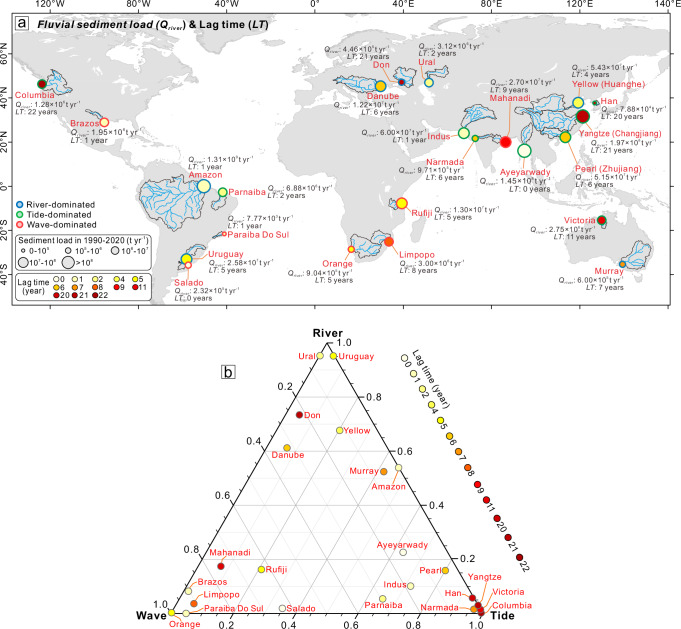
Fluvial sediment supply supports global delta growth, yet the relationship between these two key variables remains difficult to verify for modern river deltas. Part of the complication might be that deltas are slow to adjust to changes in fluvial sediment supply. To test this hypothesis, here we analyze yearly time series of fluvial sediment supply and delta land area changes for 60 major deltas through 1990-2020. Cross-correlations show that, globally averaged, changes in delta growth rate lag 6 years behind fluctuations in fluvial sediment supply. For the 24 deltas with increased sediment supply, the lag time of land change rates was reduced to 1 year; while the 36 deltas supplied with lower fluvial sediment loads lagged by 6 years. High sediment availability in river-dominated deltas leads to a quicker response of delta land area to upstream supply changes, and deltas with stronger tidal dominance have a subdued response with long lag times. Our findings here highlight the high vulnerability of deltas and their ecosystems to changing external drivers.
© 2025. The Author(s).
Conflict of interest statement
Competing interests: The authors declare no competing interests.
Figures


Similar articles
-
Use of β-adrenoreceptor drugs and Parkinson's disease incidence in women from the French E3N cohort study.J Parkinsons Dis. 2025 Jun;15(4):789-804. doi: 10.1177/1877718X251330993. Epub 2025 Apr 29. J Parkinsons Dis. 2025. PMID: 40302366
-
Home treatment for mental health problems: a systematic review.Health Technol Assess. 2001;5(15):1-139. doi: 10.3310/hta5150. Health Technol Assess. 2001. PMID: 11532236
-
Pharmacological treatments in panic disorder in adults: a network meta-analysis.Cochrane Database Syst Rev. 2023 Nov 28;11(11):CD012729. doi: 10.1002/14651858.CD012729.pub3. Cochrane Database Syst Rev. 2023. PMID: 38014714 Free PMC article.
-
Intravenous magnesium sulphate and sotalol for prevention of atrial fibrillation after coronary artery bypass surgery: a systematic review and economic evaluation.Health Technol Assess. 2008 Jun;12(28):iii-iv, ix-95. doi: 10.3310/hta12280. Health Technol Assess. 2008. PMID: 18547499
-
A rapid and systematic review of the clinical effectiveness and cost-effectiveness of paclitaxel, docetaxel, gemcitabine and vinorelbine in non-small-cell lung cancer.Health Technol Assess. 2001;5(32):1-195. doi: 10.3310/hta5320. Health Technol Assess. 2001. PMID: 12065068
References
-
- Galloway, W. E. Process framework for describing the morphologic and stratigraphic evolution of deltaic depositional systems. In Brousard, M. L. (Ed.), Deltas, Models for Exploration 87–98 (Houston Geological Society, Houston, Texas, 1975).
-
- Hoitink, A. J. F. et al. Resilience of river deltas in the Anthropocene. J. Geophys. Res.:Earth Surf.125, e2019JF005201 (2020).
-
- Day, J. W. et al. Restoration of the mississippi delta: lessons from hurricanes katrina and rita. Science315, 1679–1684 (2007). - PubMed
-
- Kirwan, M. L. & Megonigal, J. P. Tidal wetland stability in the face of human impacts and sea-level rise. Nature504, 53–60 (2013). - PubMed
-
- Syvitski, J. P. M., Vörösmarty, C. J., Kettner, A. J. & Green, P. Impact of humans on the flux of terrestrial sediment to the global coastal ocean. Science308, 376–380 (2005). - PubMed
Grants and funding
LinkOut - more resources
Full Text Sources
