. 2025 Jul 1;16(1):5708.
doi: 10.1038/s41467-025-60520-y.

Muscle Rev-erb controls time-dependent adaptations to chronic exercise in mice

Affiliations

Muscle Rev-erb controls time-dependent adaptations to chronic exercise in mice

Jidong Liu et al. Nat Commun. .

Abstract

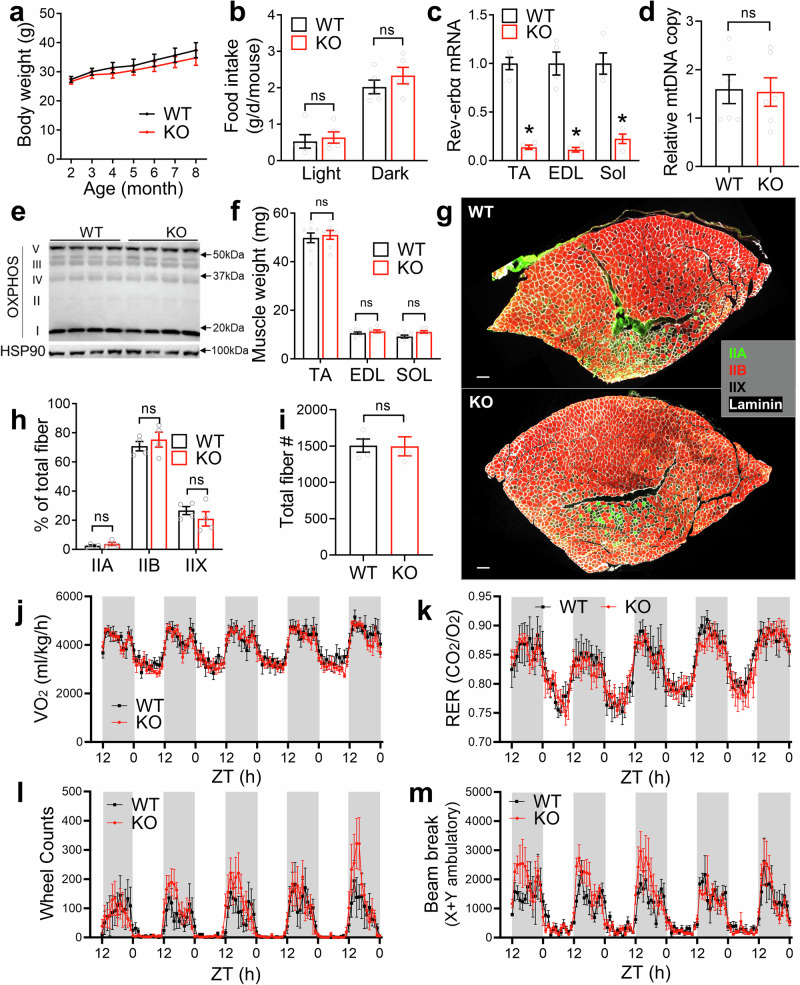
The best time of the day for chronic exercise training and the mechanism underlying the timing effects is unclear. Here, we show that low-intensity, low-volume treadmill training in mice before sleep yields greater benefits than after waking for muscle contractile performance and systemic glucose tolerance. Baseline muscle performance also exhibits diurnal variations, with higher strength but lower endurance before sleep than after waking. Muscle-specific knockout of circadian clock genes Rev-erbα/β (Rev-MKO) in male mice eradicates the diurnal variations in both training and baseline conditions without affecting muscle mass, mitochondrial content, food intake, or spontaneous activities. Multi-omics and metabolic measurements reveal that Rev-erb suppresses fatty acid oxidation and promotes carbohydrate metabolism before sleep. Thus, the muscle-autonomous clock, not feeding or locomotor behaviors, dictates diurnal variations of muscle functions and time-dependent adaptations to training, which has broad implications in metabolic disorders and sports medicine as Rev-erb agonists are exercise mimetics or enhancers.


Conflict of interest statement

Competing interests: The authors declare no competing interests.

Figures

Fig. 1
Fig. 1. Low-intensity exercise before sleep is better than after waking for weight control, contractile performance, and glucose tolerance.
a Treadmill training scheme. b Body weight (n = 10 mice/group), *p = 0.0067, 0.0161, 0.0191, and 0.0147 for EX_AM vs. EX_PM; #p = 0.0316, 0.0363, 0.0358, and 0.0360 for EX_AM vs. Rest, with 2-way repeated-measure ANOVA and Tukey test. c Magnetic resonance imaging (MRI) analysis of body composition at 6 months of age (n = 6 mice for Rest, n = 7 mice for EX_AM or EX_PM). *p = 0.0013 (Rest vs. EX_AM) and 0.0316 (EX_AM vs. EX_PM) by 2-way ANOVA and Holm-Sidak test. d Average daily food intake at 6 months old (n = 10 mice). e Forelimb grip strength at 7 months old (n = 10). *p =  0.0095 (EX-AM vs. Rest at ZT23-1), 0.0392 (EX-AM vs. EX-PM at ZT23-1), 0.0003 (EX-AM vs. Rest at ZT11-13), and 0.036 (EX-AM vs. EX-PM at ZT11-13) by 2-way ANOVA and Holm-Sidak test. f Wire hang tests at 7 months old (n = 10 mice). *p = 0.0001 (EX-AM vs. Rest at ZT23-1), 0.0001 (EX-AM vs. EX-PM at ZT23-1), and 0.046 (EX-AM vs. Rest at ZT11-13) by 2-way ANOVA and Holm-Sidak test. g Treadmill speed profile. h Distance traveled before receiving 50 shocks at 7 months old (n = 10 mice). *p = 0.0001 (EX-AM vs. Rest at ZT23-1), 0.002 (EX-PM vs. Rest at ZT23-1), 0.0007 (EX-AM vs. EX-PM at ZT23-1), 0.0085 (EX-AM vs. Rest at ZT11-13), and 0.0165 (EX-PM vs. Rest at ZT11-13) by 2-way ANOVA and Holm-Sidak test. i, j GTT at 8 months old (n = 10 mice). Data are mean ± SD. *p = 0.0035, 0.013, 0.0325, and 0.0068 for EX_AM vs. EX_PM; #p = 0.0004, 0.0074, 0.0495, and 0.0068 at ZT23-1 or 0.0256 at ZT11-13 for EX_AM vs. Rest with 2-way repeated-measure ANOVA and Holm-Sidak test. k Area under the curve (AUC) for the GTT tests. *p = 0.0001 (EX-AM vs. Rest at ZT23-1), 0.0004 (EX-AM vs. EX-PM at ZT23-1), and 0.0184 (EX-AM vs. Rest at ZT11-13) by 2-way ANOVA and Tukey test. Data are mean ± SEM unless otherwise specified.
Fig. 2
Fig. 2. Rev-MKO mice show normal baseline mitochondrial content, muscle mass, fiber type, locomotor activities, and energy expenditure.
a Body weight. n = 8 mice for WT (4 Rev-erbfloxed and 4 MLC-Cre), n = 7 mice for KO. b Average food intake at 6 months of age (n = 5 mice per group). For WT, 3 Rev-erbfloxed and 2 MLC-Cre. Analyzed by 2-sided student t-test. c RT-qPCR analysis of the tibialis anterior (TA), extensor digitorum longus (EDL), and soleus (Sol) muscle from 8 month-old male mice harvested at ZT6 using primer pairs that span the floxed exons in Rev-erbα (n = 4 mice per group). For WT, 2 Rev-erbfloxed and 2 MLC-Cre. *p < 0.0001 for WT vs. KO by 2-sided unpaired student t-test. d Relative mitochondrial copy number by qPCR analysis in EDL muscles at 6 months of age (n = 6 mice per group). For WT, 3 Rev-erbfloxed and 3 MLC-Cre. Analyzed by 2-sided student t-test. e Western blot analysis of mitochondrial OXPHOS protein complexes in quadriceps muscle at 6 months of age (n = 4 mice per group, repeated 2 times). For WT, 2 Rev-erbfloxed and 2 MLC-Cre. f Muscle weight at 6 months of age (n = 8 mice for WT and n = 7 mice for KO). For WT, 4 Rev-erbfloxed and 4 MLC-Cre. Analyzed by 2-sided student t-test. (g) Representative immunofluorescence staining (from 3 replicates) of cross-sections of tibialis anterior (TA) muscles at 6 months of age. Scale bar = 200 μm. h, i Quantification of the muscle fiber composition and total fiber number at 6 months of age (n = 4 mice per group). For WT, 2 Rev-erbfloxed and 2 MLC-Cre. Analyzed by 2-sided student t-test. jm Oxygen consumption rate (VO2), respiratory exchange ratio (RER), voluntary wheel-running counts, and beam breaks as measured by the Oxymax/CLAMS-HC system at 6 months of age (n = 5 mice per group). For WT, 3 Rev-erbfloxed and 2 MLC-Cre. ns, not significant. Data are mean ± SEM.
Fig. 3
Fig. 3. Muscle Rev-erb is required for the timing effects of exercise training on weight control, contractile performance, and glucose tolerance.
a Body weight (n = 9 mice for KO EX_AM, n = 10 mice for the other groups). *p = 0.0473 and 0.042 for WT EX_AM vs. WT EX_PM with 2-way repeated-measure ANOVA and Tukey test. WT, Rev-erbfloxed mice. b, c Forelimb grip strength test and wire hang test at 6 months old (n = 9 mice for KO EX_AM, n = 10 mice for the other groups). *p = 0.0318 (ZT23-1) and 0.0332 (ZT11-13) for grip strength, 0.0409 (ZT23-1) and 0.0346 (ZT11-13) for wire hang, by 2-way ANOVA and Tukey test. d Treadmill distance at 7 months old (n = 9 mice for KO EX_AM, n = 10 mice for the other groups). *p = 0.0001 (EX-AM vs. EX-PM at ZT23-1) and 0.0297 (ZT23-1 vs. ZT11-13 for WT EX_AM) by 2-way ANOVA and Tukey test. e GTT at ZT 23-1 at 8 months old (n = 9 mice for KO EX_AM, n = 10 mice for the other groups). Data are mean ± SD. *p = 0.0414, 0.0486 and 0.0236 for WT_EX_AM vs. WT_EX_PM with 2-way repeated-measure ANOVA and Holm-Sidak test. f Area under the curve (AUC) in GTT. *p = 0.0149 with 1-way ANOVA and Tukey test. g, h Dorsi flexor tetanic torque at 9 months old (n = 9 mice for KO EX_AM, n = 10 mice for the other groups). *p = 0.0255 (ZT23-1) and 0.0193 (ZT11-13) by 1-way ANOVA and Tukey test. il Fatigue analysis at 9 months old at ZT23-1 (n = 8 mice for WT, n = 6 mice for KO) or ZT11-13 (n = 8 mice for WT EX_AM, n = 7 mice for WT EX_PM, n = 5 for KO EX_AM, n = 6 mice or KO EX_PM). *p = 0.0053 (ZT23-1) and 0.0202 (ZT11-13) by 1-way ANOVA and Tukey test. Data are mean ± SEM unless otherwise specified. ns, not significant.
Fig. 4
Fig. 4. Muscle Rev-erb is required for the time-dependent effects of chronic exercise on energy balance and locomotor activity.
a Average daily food intake (n = 9 mice/group). WT are Rev-erbfloxed mice. *p = 0.0452, 0.0208, and 0.0183 by 1-way ANOVA and Holm-Sidak test. b Body weight at 4.5 months old (n = 8 mice for WT EX_AM, n = 9 mice for WT EX_PM, n = 9 mice for KO EX_AM, n = 7 mice for KO EX_PM). c, d Linear regression analysis (2-sided) of average daily oxygen consumption vs. body weight at 4.5 months old (n = 8 mice for WT EX_AM, n = 9 mice for WT EX_PM, n = 9 mice for KO EX_AM, n = 7 mice for KO EX_PM). ej Oxygen consumption, voluntary wheel-running activity, and spontaneous beam-breaking activity as measured by the Oxymax/CLAMS-HC system at 4.5 months old (n = 8 mice for WT EX_AM, n = 9 mice for WT EX_PM, n = 9 mice for KO EX_AM, n = 7 mice for KO EX_PM). Arrows indicate a temporary disruption when mice were taken out for treadmill exercise sessions. k Average daily beam break counts at 4.5 months of age (n = 8 mice for WT EX_AM, n = 9 mice for WT EX_PM, n = 9 mice for KO EX_AM, n = 7 mice for KO EX_PM). *p = 0.0431 by 1-way ANOVA and Sidak test. ln Rectal temperature across different days or average temperature from multiple days at 4.5 months old (n = 11 mice for WT EX_AM, n = 10 mice for the other groups). Arrows indicate treadmill sessions. *p = 0.0034 and 0.0301 (WT_EX_AM vs. WT_EX_PM for panel l) and 0.0034 (WT_EX_AM vs. WT_EX_PM for panel m) by 2-way ANOVA and Tukey test. All data are mean ± SEM. ns, not significant.
Fig. 5
Fig. 5. Muscle Rev-erb regulates the baseline diurnal rhythm of muscle strength and endurance.
a Wire hang in males at 3 months old. *p = 0.0085 (WT vs. KO at ZT23-1) and 0.0255 (ZT23-1 vs. ZT11-13 for WT). b Forelimb grip strength in males at 3 months old. *p = 0.001 (WT vs. KO at ZT23-1) and 0.0001 (ZT23-1 vs. ZT11-13 for WT). Data are mean ± SD. c Treadmill test with the low-speed profile in males at 4 months old. *p = 0.0047 (WT vs. KO at ZT23-1) and 0.0424 (ZT23-1 vs. ZT11-13 for WT). (a-c) n = 14 mice/group. WT are 9 Rev-erbfloxed and 5 MLC-Cre. d Forelimb grip strength in females at 4 months old (n = 10 mice/group). WT are Rev-erbfloxed mice. Data are mean ± SD. *p = 0.0001 (WT vs. KO at ZT23-1) and 0.0001 (ZT23-1 vs. ZT11-13 for WT). e Treadmill test in females with the low-speed profile at 3 months old (n = 19 WT, 11 KO). WT are Rev-erbfloxed mice. *p = 0.0005 (WT vs. KO at ZT23-1) and 0.0034 (ZT23-1 vs. ZT11-13 for WT). f Dorsi flexor tetanic torque in vivo in males at 9 months old (n = 9). WT are Rev-erbfloxed mice. *p = 0.0323 (WT vs. KO at ZT23-1) and 0.0492 (ZT23-1 vs. ZT11-13 for WT). af were determined by 2-way ANOVA and Holm-Sidak test. g, h Dorsi flexor fatigue resistance in vivo in males at 9 months old at ZT23-1 (n = 8 WT, 10 KO) or ZT11-13 (n = 5 WT, 6 KO). im Ex vivo muscle physiology of EDL muscles at 6 months old (n = 4 mice/group). WT are 2 Rev-erbfloxed mice and 2 MLC-Cre mice. *p = 0.0458 by t-test (j), 0.0021 (l) and 0.0264 (m) by 2-way repeated-measure ANOVA. ns Treadmill test at 5 months old at the low-speed profile ((np) n = 15 WT, 9 KO) or the high-speed profile ((r, s) n = 9 mice/group). WT are Rev-erbfloxed mice. *p = 0.0206 (p) and 0.0434 (s) by t-test. Data are mean ± SEM unless otherwise specified. ns, not significant.
Fig. 6
Fig. 6. Multi-omics characterization of muscle Rev-erb functions.
a Venn diagram showing the ZT22 and ZT10 overlap of differentially expressed genes (DEGs) in KO vs. WT as identified by RNA-seq at 6 months of age (q < 0.05, fold change > 1.5). WT are Rev-erbfloxed mice. b, c Top enriched KEGG pathways in DEGs at ZT22 and ZT10. d, e Heat map of DEGs showing the relative abundance (in Z-score) involved in glycolysis, TCA cycle, fatty acid metabolism, BCAA metabolism, circadian clock, muscle contraction, adhesion, sarcomere, and insulin signaling. f Pie chart representing the genomic distribution of Rev-erbα ChIP-seq peaks. g Top enriched motif of Rev-erbα peaks at ZT10. h Venn diagram showing the overlap of Rev-erbα binding peaks at ZT10 and ZT22. i Heat map of Rev-erbα ChIP-seq signals at ZT10 and ZT22. j, k Browser tracks of Rev-erbα peaks at genes involved in metabolism. l Metabolomics heat map showing the relative abundance (in Z-score) of metabolites at the indicated ZT in quadriceps muscle at 10 months of age (n = 3 mice per group). WT are Rev-erbfloxed mice. Statistical differences were determined using 2-way ANOVA followed by the Tukey test and were indicated on the right side by colors as illustrated in the color key.
Fig. 7
Fig. 7. Muscle Rev-erb regulates the diurnal rhythm of bioenergetics and time-dependent metabolic adaptations to acute exercise.
a Integrated transcriptomics and metabolomics analysis. b, c Glucose uptake and fatty acid oxidation (FAO) rates in primary myotubes isolated from mice at 3 months old, followed by electric pulse stimulation (EPS) during isotope tracing with 3H-deoxyglucose (DOG) or 3H-palmitate (n = 4 wells of cells from 3 mice/group). WT are Rev-erbfloxed mice. *p = 0.0098 (b) and *p = 0.0027 (c) with student t-test. d FAO rate measured by blood 3H-H2O at 20 min after intraperitoneal injection of 3H-palmitate. Mice at 6 months old were running treadmill at 10 m/min during tracing (n = 10 mice/group). WT are 7 Rev-erbfloxed and 3 MLC-Cre mice. *p = 0.0001 by 2-way ANOVA and Holm-Sidak test. eg Muscle triglycerides (TG), muscle glycogen, and liver glycogen at 5 months old (n = 6 mice/group). WT are 3 Rev-erbfloxed and 3 MLC-Cre mice. *p = 0.0002 (e), 0.0002 (WT vs. KO at ZT23-1) and 0.0276 (ZT23-1 vs. ZT11-13 for WT) for (f), and 0.0001 (g) by 2-way ANOVA and Holm-Sidak test. h Blood lactate after a bout of treadmill exercise at 4 months old (n = 11 mice/group). WT are 9 Rev-erbfloxed and 2 MLC-Cre mice. *p = 0.0081 (WT vs. KO at ZT23-1) and 0.0027 (ZT23-1 vs. ZT11-13 for WT) by 2-way repeated-measure ANOVA and Holm-Sidak test. i, j GTT at 10 months old after running at 12 m/min speed for 25 min (n = 10 WT, 11 KO). *p = 0.0101 for genotype effects with 2-way repeated-measure ANOVA. WT are 8 Rev-erbfloxed and 2 MLC-Cre mice. k HOMA-IR at 10 months old (n = 10). WT are 8 Rev-erbfloxed and 2 MLC-Cre mice. *p = 0.0004 by 2-way ANOVA and Holm-Sidak test. l, m Speed profile and RER during a bout of treadmill exercise at 9 months old (n = 8 mice/group). WT are 6 Rev-erbfloxed and 2 MLC-Cre mice. *p = 0.0013 (WT_ZT0 vs. KO_ZT0) for genotype effects by 2-way repeated-measure ANOVA. n A working model of muscle fuel metabolic rhythmicity. Data are mean ± SEM. ns, not significant.

References

    1. Cartee, G. D., Hepple, R. T., Bamman, M. M. & Zierath, J. R. Exercise promotes healthy aging of skeletal muscle. Cell Metab.23, 1034–1047 (2016). - PMC - PubMed
    1. Distefano, G. & Goodpaster, B. H. Effects of exercise and aging on skeletal muscle. Cold Spring Harb. Perspect. Med.8, a029785 (2018). - PMC - PubMed
    1. Steele, J. et al. Slow and steady, or hard and fast? A systematic review and meta-analysis of studies comparing body composition changes between interval training and moderate intensity continuous training. Sports Basel Switz.9, 155 (2021). - PMC - PubMed
    1. van der Velde, J. H. P. M. et al. Timing of physical activity in relation to liver fat content and insulin resistance. Diabetologia66, 461–471 (2023). - PMC - PubMed
    1. Qian, J. et al. Association of timing of moderate-to-vigorous physical activity with changes in glycemic control over 4 years in adults with type 2 diabetes from the look ahead trial. Diabetes Care46, 1417–1424 (2023). - PMC - PubMed

MeSH terms

Substances

LinkOut - more resources