. 2025 Jul 1;16(1):5798.
doi: 10.1038/s41467-025-60681-w.

Enhanced role of the entorhinal cortex in adapting to increased working memory load

Affiliations

Enhanced role of the entorhinal cortex in adapting to increased working memory load

Jiayi Yang et al. Nat Commun. .

Abstract

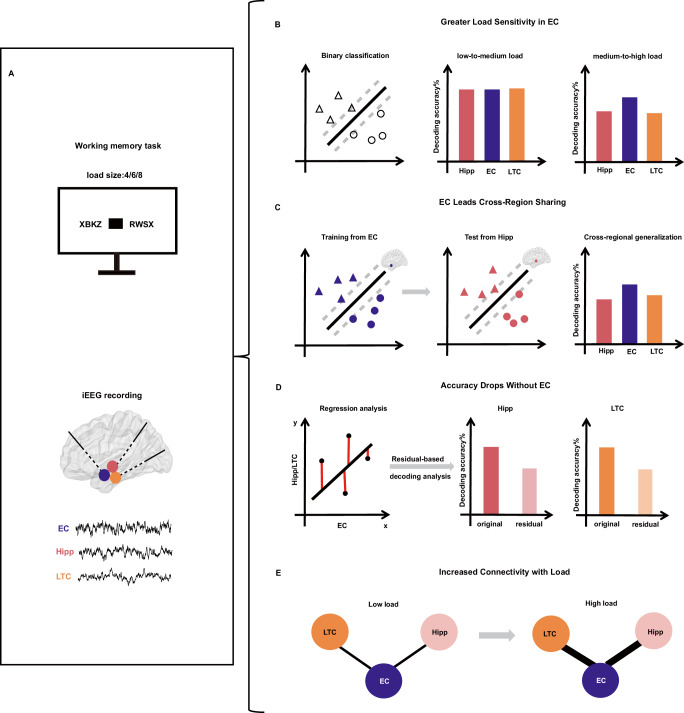
In daily life, we frequently encounter varying demands on working memory (WM), yet how the brain adapts to high WM load remains unclear. To address this question, we recorded intracranial EEG from hippocampus, entorhinal cortex (EC), and lateral temporal cortex (LTC) in humans performing a task with varying WM loads (load 4, 6, and 8). Using multivariate machine learning analysis, we decoded WM load using the power from each region as neural features. The results showed that the EC exhibited both higher decoding accuracy on medium-to-high load and superior cross-regional generalization. Further analysis revealed that removing EC-related information significantly reduced residual decoding accuracy in the hippocampus and LTC. Additionally, we found that WM maintenance was associated with enhanced phase synchronization between the EC and other regions. This inter-regional communication increased as WM load rose. These results suggest that under higher WM load, the brain relies more on the EC, a key connector that links and shares information with the hippocampus and LTC.


Conflict of interest statement

Competing interests: The authors declare no competing interests.

Figures

Fig. 1
Fig. 1. Overview of the analysis pipeline.
A Schematic illustration of the WM task and intracranial EEG (iEEG) recording sites in the entorhinal cortex (EC), hippocampus (Hipp), and lateral temporal cortex (LTC). B Under medium-to-high load conditions, decoding accuracy based on EC power features was higher than that derived from the hippocampus or LTC. C Cross-regional decoding, in which decoders trained on one region’s data were tested on another, revealed that EC-based decoders demonstrated the highest generalization under medium-to-high load conditions. D Residual decoding analysis showed that removing neural activity shared with the EC significantly reduced decoding accuracy in the hippocampus and LTC under medium-to-high load conditions. E Functional connectivity analysis indicated that the phase locking value (PLV) between the EC and other regions increased with enhanced WM load. The brain (A, C) was visualized by the BrainNet Viewer toolbox (www.nitrc.org/projects/bnv/).
Fig. 2
Fig. 2. Experimental paradigm, recording sites, schematic, and results of single-regional decoding analysis.
A Each trial began with a 1 s fixation screen, followed by a 2 s presentation of four, six, or eight letters. After letters disappeared, there was a 3 s maintenance period with a black square shown. Participants responded whether a probe letter was part of the original set by pressing “IN” or “OUT”. B Channel locations of all participants included 91 channels in the hippocampus (Hipp; light red), 46 channels in the entorhinal cortex (EC; light blue), and 136 channels in the lateral temporal cortex (LTC; light green). The brain was visualized by the BrainNet Viewer toolbox (www.nitrc.org/projects/bnv/). C We conducted binary classification (load 4 vs load 6, load 6 vs load 8). Time-frequency analysis was performed on each trial to obtain power spectra in the hippocampus, EC, and LTC. For each classification task, 70% of the data was used for training and 30% for testing with a linear SVM classifier. D The decoding accuracy for load 4 vs load 6 did not show significant differences among the hippocampus, EC, and LTC across all cross-validations (n = 100, two-sided permutation t test: EC vs hippocampus: p = 0.768; EC vs LTC: p = 0.379; LTC vs hippocampus: p = 0.690; see distribution with 150 iterations in Supplementary Fig. S1). The EC exhibited the highest decoding accuracy for load 6 vs load 8 (n = 100 cross-validations; two-sided permutation t test: all ps < 0.001). ***p < 0.001. E Differences in decoding accuracy between low-to-medium and medium-to-high load conditions were smallest in the EC (n = 100 cross-validations; two-sided permutation t test: hippocampus vs EC: p < 0.001; LTC vs EC: p = 0.005; hippocampus vs LTC: p = 0.047). *p < 0.05, **p < 0.01, ***p < 0.001. In the box plots shown in (D, E), the center line represents the median, and the edges of the box correspond to the lower and upper quartiles, respectively. The whiskers extend to the minimum and maximum data points at most 1.5 times the interquartile range. Source data are provided as a Source Data file.
Fig. 3
Fig. 3. Highest cross-regional generalization in the EC.
A Schematic of cross-regional decoding analysis. Using the entorhinal cortex (EC) as an example, we trained classifiers using power features from EC for each trial and predicted the load using power from the hippocampus (Hipp) for both low-to-medium and medium-to-high load conditions. The specific decoding steps were the same as shown in Fig. 2C. For all brain regions, models were trained using their own power features and tested on data from the other two brain regions. The generalization of each brain region was determined by averaging its accuracy when tested on data from the other two brain regions (hippocampus: light red; EC: light blue; lateral temporal cortex: LTC, light green). The brain was visualized by the BrainNet Viewer toolbox (www.nitrc.org/projects/bnv/). B Accuracy matrix of cross-regional decoding on low-to-medium load (left) and medium-to-high load (right). The rows of the matrix represented the regions used for training, while the columns denoted the regions employed for testing, with the values representing the average accuracy. C The averaged cross-regional decoding accuracy for load 4 vs load 6 did not differ significantly among hippocampus, EC, and LTC across all cross-validations (n = 100; two-sided permutation t tests: EC vs hippocampus: p = 0.637; EC vs LTC: p = 0.128; LTC vs hippocampus: p = 0.141). The EC showed the highest cross-regional decoding accuracy for load 6 vs load 8 across all cross-validations (n = 100; two-sided permutation t tests: EC vs hippocampus: p < 0.001; EC vs LTC: p = 0.002; LTC vs hippocampus: p < 0.001). **p < 0.01, ***p < 0.001. The center line represents the median, and the edges of the box correspond to the lower and upper quartiles, respectively. The whiskers extend to the minimum and maximum data points at most 1.5 times the interquartile range. Source data are provided as a Source Data file.
Fig. 4
Fig. 4. Residual-based decoding analysis.
A Schematic of residual-based decoding analysis. We first transformed the time-frequency power features of each trial across three brain regions into vectors. Then, we used the feature vector of the hippocampus (Hipp) and lateral temporal cortex (LTC) as dependent variables (y) separately, with the features of the entorhinal cortex (EC) as independent variables (x), to construct linear regression models for each trial. The resulting residuals of the hippocampus and LTC were retained as features for training and testing the classifier. The specific decoding steps were the same as shown in Fig. 2C. B Original features (dark colors) represented decoding accuracy using the original power features from the hippocampus (red) and LTC (green). EC-residual (light colors) indicated decoding accuracy using residuals after removing EC-shared information from the hippocampus (red) and LTC (green). The EC-residual decoding accuracies were significantly lower than those obtained using the original features from the hippocampus and LTC (n = 100 cross-validations; two-sided permutation t tests: all ps < 0.001). ***p < 0.001. C Left panel: the change in decoding accuracy after removing shared information from EC (EC-residual = Hippres-EC - Hipporig; light red) and LTC (LTC-residual = Hippres-LTC - Hipporig; dark red) in the hippocampus. The decrease in decoding accuracy was significantly greater for EC-residual than for LTC-residual (n = 100 cross-validations; two-sided permutation t tests: p < 0.001). Right panel: the change in decoding accuracy after removing shared information from EC (EC-residual = LTCres-EC - LTCorig; light green) and hippocampus (Hipp-residual = LTCres-Hipp - LTCorig; dark green) in the LTC. The decrease in decoding accuracy was significantly greater for EC-residual than for Hipp-residual (n = 100 cross-validations; two-sided permutation t tests: p = 0.029). *p < 0.05, ***p < 0.001. In the box plots shown in (B, C), the center line represents the median, and the edges of the box correspond to the lower and upper quartiles, respectively. The whiskers extend to the minimum and maximum data points at most 1.5 times the interquartile range. Source data are provided as a Source Data file.
Fig. 5
Fig. 5. Decoding performance of high and low behavioral groups and phase synchronization.
A Participants were divided into high-performing (7 participants) and low-performing (6 participants) groups based on median recall accuracy for load 8. B Single-regional decoding accuracy was significantly higher in the high-performing group (dark color) than in the low-performing group (light color) for the entorhinal cortex (EC, blue; two-sided permutation t tests: p < 0.001), but not for the hippocampus (Hipp, red; two-sided permutation t tests: p = 0.621) or lateral temporal cortex (LTC, green; two-sided permutation t tests: p = 0.457) across all cross-validations (n = 100). ***p < 0.001. ( C) Cross-regional decoding accuracy was significantly higher in the high-performing group than in the low-performing group for the EC (two-sided permutation t-tests: p < 0.001), but not for the hippocampus (two-sided permutation t tests: p = 0.264) or LTC (two-sided permutation t-tests: p = 0.406) across all cross-validations (n = 100). ***p < 0.001. D Phase locking value (PLV) between EC and hippocampus increased significantly from load 4 (purple) to load 6 (yellow) and from load 4 to load 8 (orange) (n = 13 participants; repeated-measures ANOVA: load 4 vs load 6, p = 0.01; load 4 vs load 8, p = 0.002; load 6 vs load 8, p > 0.05). **p < 0.01, *p < 0.05. E PLV between EC and LTC increased significantly from load 4 to load 8 (n = 13 participants; repeated-measures ANOVA: load 4 vs load 6, p = 0.10; load 4 vs load 8, p = 0.005; load 6 vs load 8, p = 0.79). **p < 0.01. F The average EC-residualed PLV did not differ significantly across load conditions (n = 13 participants; repeated-measures ANOVA: all ps > 0.05). In the box plots shown in (BF), the center line represents the median, and the edges of the box correspond to the lower and upper quartiles, respectively. The whiskers extend to the minimum and maximum data points at most 1.5 times the interquartile range. Source data are provided as a Source Data file.

Similar articles

References

    1. Cowan, N. Working memory underpins cognitive development, learning, and education. Educ. Psychol. Rev.26, 197–223 (2014). - PMC - PubMed
    1. Nozari, N. & Martin, R. C. Is working memory domain-general or domain-specific?. Trends Cogn. Sci.28, 1023–1036 (2024). - PMC - PubMed
    1. Owen, A. M. Working memory: imaging the magic number four. Curr. Biol.14, R573–R574 (2004). - PubMed
    1. Brockhoff, L., Schindler, S., Bruchmann, M. & Straube, T. Effects of perceptual and working memory load on brain responses to task-irrelevant stimuli: Review and implications for future research. Neurosci. Biobehav. Rev.135, 104580 (2022). - PubMed
    1. Wang, Y. et al. Fronto-parietal activity changes associated with changes in working memory load: Evidence from simultaneous electroencephalography and functional near-infrared spectroscopy analysis. Eur. J. Neurosci.60, 5413–5427 (2024). - PubMed

LinkOut - more resources