. 2025 Jul 1;16(1):5448.
doi: 10.1038/s41467-025-60704-6.

Epitenon-derived progenitors drive fibrosis and regeneration after flexor tendon injury in a spatially-dependent manner

Affiliations

Epitenon-derived progenitors drive fibrosis and regeneration after flexor tendon injury in a spatially-dependent manner

Anne E C Nichols et al. Nat Commun. .

Abstract

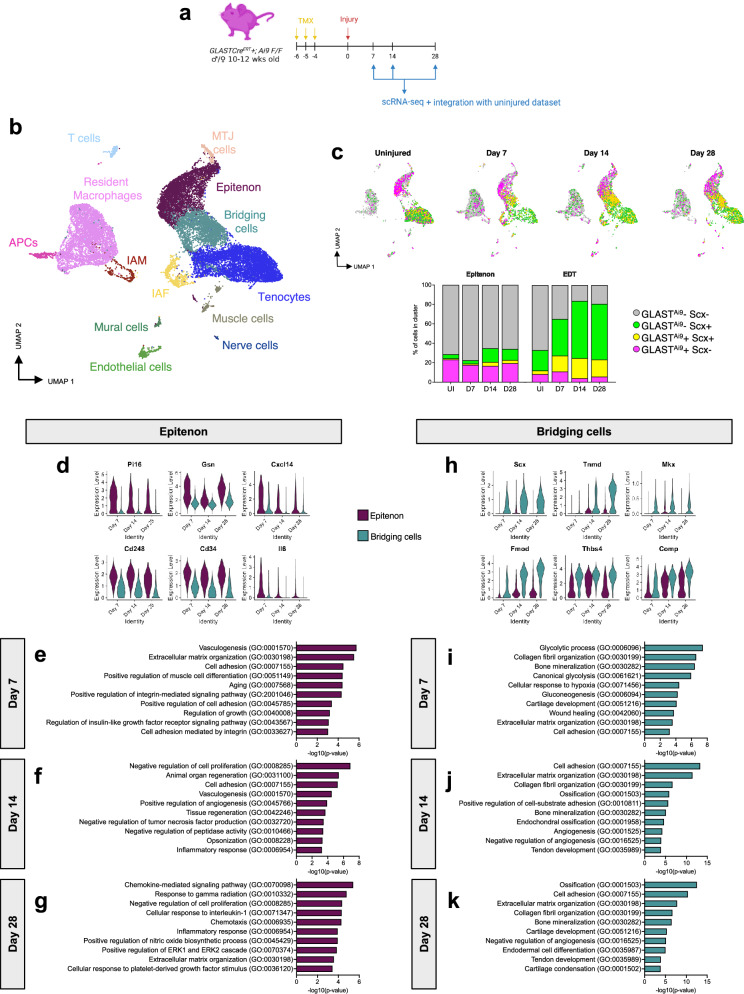
Flexor tendon injuries are common and heal poorly owing to both the deposition of function-limiting peritendinous scar tissue and insufficient healing of the tendon itself. Therapeutic options are limited due to a lack of understanding of the cell populations that contribute to these processes. Here, we identified the epitenon as a major source of cells that contribute to both peritendinous fibrosis and regenerative tendon healing following acute tendon injury. Using a combination of genetic lineage tracing and single cell RNA-sequencing (scRNA-seq), we profiled the behavior and contributions of each cell fate to the healing process in a spatio-temporal manner. Integrated scRNA-seq analysis of mouse healing with human peritendinous scar tissue revealed remarkable transcriptional similarity between mouse epitenon-derived cells and fibroblasts present in human peritendinous scar tissue, which was further validated by immunofluorescent staining for conserved markers. Finally, ablation of pro-fibrotic epitenon-derived cells post-tendon injury significantly improved functional recovery. Combined, these results clearly identify the epitenon as the cellular origin of an important progenitor cell population that could be leveraged to improve tendon healing.


Conflict of interest statement

Competing interests: The authors declare no competing interests.

Figures

Fig. 1
Fig. 1. Characterization of the tendon epitenon during homeostasis.
a Overview of experimental design. Created in BioRender. Nichols, A. (2025) https://BioRender.com/3bneueh. b Sagittal section of the FDL tendon showing IF for GLASTAi9 (magenta) and myosin (green). Scale bar = 50 μm. c SHG imaging (gray) of endogenous GLASTAi9 labeling (magenta) in relation to the collage matrix in sagittal frozen sections. d 3D reconstruction of an axial section through the FDL tendon showing GLASTAi9 (magenta) cells in both the epitenon (orange arrows) and surrounding blood vessels adjacent to the epitenon (white arrows). e In situ multiphoton imaging of GLASTAi9 epitenon cells (magenta cells; white arrows), small blood vessels on the surface of the FDL tendon (αSMA; green), and non-GLASTAi9 epitenon cells (yellow arrows). f In situ multiphoton imaging of GLASTAi9 perivascular cells (white arrows) and non-GLASTAi9 cells (yellow arrows). Scale bars = 10 μm. g Representative immunofluorescent staining for EAAT1 (magenta) protein encoded by GLAST gene) in human flexor tendon. Scale bar = 50 μm. h GLASTAi9; ScxGFP mice received TMX injections and were harvested for frozen histology. Created in BioRender. Nichols, A. (2025) https://BioRender.com/78wxret (i) Sagittal section (scale bar = 25 μm) and (j) quantification of the mean endogenous GLASTAi9 (magenta) and ScxGFP (green) fluorescence (n = 4 mice). Error bars represent standard deviation. UMAP of clusters containing GLASTAi9 cells (k) in scRNA-seq dataset from uninjured FDL tendons. l GLASTAi9 cell distribution in cell clusters. m Expression of pan-fibroblast marker genes in clusters from uninjured tendon. n Transcriptional markers of the epitenon cell cluster in uninjured FDL tendons. In all images, nuclei are counterstained with Hoechst (blue).
Fig. 2
Fig. 2. GLASTAi9 epitenon cells proliferate and migrate into the scar area follow acute tendon injury.
a Overview of experimental design. Created in BioRender. Nichols, A. (2025) https://BioRender.com/rqeui4y. b Representative images of GLASTAi9 (magenta) cells located in both a peripheral capsule (orange arrows) around the injury site and within the scar tissue (aqua arrows). Tendon stubs are outlined by white dashed lines and the scar area is outlined by yellow dotted lines. Sutures are marked by white asterisks. Scale bar = 200 μm. c Ki67 IF (green) in the uninjured epitenon (GLASTAi9; magenta) and representative images (d) of the epitenon adjacent to the injury site throughout healing. e Quantification of the mean percentage of proliferating GLASTAi9 epitenon cells (GLASTAi9; Ki67+) at each timepoint (D3: n = 3, D7: n = 3, D10: n = 4, D14: n = 4, D21 n = 4, D28: n = 3 mice). Error bars represent standard deviation. In all images, nuclei are counterstained with Hoechst (blue).
Fig. 3
Fig. 3. A subset of GLASTAi9 epitenon cells differentiate into tenocytes during healing.
a Representative images of healing tendons from GLASTAi9; ScxGFP mice at days 3, 7, 10, 14, 21, and 28 post-injury showing the presence of GLASTAi9; ScxGFP− cells (magenta cells, orange arrows), ScxGFP+ tenocytes (green cells), and GLASTAi9; ScxGFP+ tenocytes (white cells, white arrows). Tendon stubs are outlined by white dashed lines and the scar area is outlined by yellow dotted lines. Sutures are marked by white asterisks. Scale bars = 200 μm, magnified image scale bars = 50 μm. b Quantification of all cell populations present in the scar area throughout healing (D3: n = 3, D7: n = 3, D10: n = 4, D14: n = 4, D21 n = 4, D28: n = 3 mice). Bars represent the mean cell number and error bars denote the standard deviation. In all images, nuclei are counterstained with Hoechst (blue).
Fig. 4
Fig. 4. Epitenon-derived cells exhibit dual fates during healing.
a Overview of experimental design. b Annotated UMAP plot of integrated healing dataset containing cells from uninjured FDL tendon and tendons at 7, 14, and 28 days post-injury. IAF Injury-associated fibroblasts, APCs Antigen-presenting cells, IAM Injury-associated macrophages. c UMAP plots (top) and quantification (bottom) of epitenon cells (magenta: GLASTAi9+; Scx−), tenocytes (green: GLASTAi9−; Scx+), and Bridging cells, (yellow: GLASTAi9+; Scx+) in the integrated dataset at each timepoint. d, e Increased expression of fibrotic markers in the epitenon cluster (d) and tenogenic markers in the Bridging cells cluster (e) over time. fk GO terms enriched in the epitenon (f–h) and Bridging cells (ik) clusters at each timepoint. p-values were calculated by a modified Fisher’s Exact p-value (EASE score).
Fig. 5
Fig. 5. GLASTAi9 epitenon-derived cells on the periphery of the injury site exhibit increased expression of the pro-inflammatory/pro-fibrotic cytokine CXCL14.
a Representative images of healing tendons from GLASTAi9; ScxGFP mice at days 3, 7, 10, 14, 21, and 28 post-injury showing the presence of GLASTAi9 cells (red) and CXCL14 (yellow). Tendon stubs are outlined by white dashed lines and the scar area is outlined by white dotted lines. Scale bars = 200 μm, magnified image scale bars = 50 μm. Pink outlined magnified images denote GLASTAi9 cells on the periphery of the injury site and light blue outlined magnified images show GLASTAi9 cells within the bridging scar tissue. Quantification of GLASTAi9; CXCL14+ cells in the bridging scar tissue (b) vs the peripheral capsule (c) (D3: n = 3, D7: n = 4, D10: n = 4, D14: n = 4, D21 n = 4, D28: n = 3 mice). Bars represent the mean cell number and error bars denote the standard deviation. In all images, nuclei are counterstained with Hoechst (blue).
Fig. 6
Fig. 6. Branched trajectory analysis and transcriptional regulation of epitenon-derived cell fates.
a Annotated UMAP graph of clusters used for trajectory analysis. b UMAP depicting inferred branched trajectory from uninjured epitenon to tenogenic (green) and fibrotic (blue) fates. c Pseudotime progression of epitenon-derived cells from uninjured epitenon to day 28 EDT. Boxes denote the median and interquartile range (Q1–Q3) as a box, whiskers extending up to 1.5 × IQR, and individual points for outliers beyond the range. d, e Upregulation of tenogenic (e) and fibrotic (e) markers along the different fate trajectories. f GO terms enriched along in the tenogenic trajectory. g Putative transcription factors regulating tenogenesis of epitenon cells. h Potential tenogenic transcriptional regulators in pseudotime, colored by cell type in real time. i GO terms enriched along in the fibrotic trajectory. j Putative transcription factors regulating fibrotic fate of epitenon cells. k Potential fibrotic transcriptional regulators in pseudotime, colored by cell type in real time. p-values were calculated by a modified Fisher’s Exact p-value (EASE score).
Fig. 7
Fig. 7. Depletion of GLASTAi9 epitenon cells improves functional recovery.
a Overview of experimental design. Created in BioRender. Nichols, A. (2025) https://BioRender.com/u06u383. b Representative images of metatarsophalangeal joint (MTP) range of motion (ROM) from PBS (control) and diphtheria toxin (DT) treated tendons at days 14 and 28 post-injury. Quantification of the mean (c) MTP ROM, (d) gliding resistance, (e) maximum load at failure, and (f) stiffness of PBS or DT treated tendon repairs at days 14 and 28 post-injury. All outcomes at Day 14: PBS: n = 12, DT: n = 13 mice, all outcomes at Day 28 PBS: n = 10, DT: n = 9 mice. p-values were determined by unpaired t tests for normally distributed data (MTP ROM, maximum load) or Mann–Whitney tests for non-normally distributed data (gliding, stiffness) using the Šidák–Holm method to correct for multiple comparisons. *p < 0.05 **p < 0.01.
Fig. 8
Fig. 8. Integration of mouse healing scRNA-seq dataset with human peritendinous scar tissue.
a Experimental overview. Created in BioRender. Nichols, A. (2025) https://BioRender.com/f98k758. b Proportion of human peritendinous scar cells that correspond to individual mouse clusters, colored by timepoint. IAF Injury-associated fibroblasts, APCs Antigen-presenting cells, IAM Injury-associated macrophages. c UMAP of annotated integrated mouse healing scRNA-seq dataset. d Feature plots showing conserved expression of Ccn3 in the mouse epitenon throughout healing. e UMAP of annotated integrated human peritendinous scar scRNA-seq dataset. f Feature plot showing expression of CCN3 in the fibroblast cluster. g Immunofluorescent staining of CCN3 (magenta) in uninjured human flexor tendon. Image is representative of n = 2 individual humans. Scale bar = 50 μm. h Immunofluorescent staining for conserved epitenon-derived cell marker CCN3 (magenta) in the peritendinous scar tissue from three individual human patients. In all immunofluorescent images, nuclei are counterstained with Hoechst (blue).
Fig. 9
Fig. 9. Working model of the epitenon cell contribution to flexor tendon healing.
Created in BioRender. Nichols, A. (2025) https://BioRender.com/h82a999.

Update of

Similar articles

References

    1. Nichols, A. E. C., Best, K. T. & Loiselle, A. E. The cellular basis of fibrotic tendon healing: challenges and opportunities. Transl. Res.209, 156–168 (2019). - PMC - PubMed
    1. Pennisi, E. Tending tender tendons. Science295, 1011 (2002). - PubMed
    1. Mehrzad, R. et al. The economic impact of flexor tendon lacerations of the hand in the United States. Ann. Plast. Surg.83, 419–423 (2019). - PubMed
    1. Strickland, J. W. & Glogovac, S. V. Digital function following flexor tendon repair in Zone II: a comparison of immobilization and controlled passive motion techniques. J. Hand Surg. Am.5, 537–543 (1980). - PubMed
    1. Quadlbauer, S. et al. Early Passive Movement in flexor tendon injuries of the hand. Arch. Orthop. Trauma. Surg.136, 285–293 (2016). - PubMed

LinkOut - more resources