. 2025 Jul 1;16(1):5903.
doi: 10.1038/s41467-025-60800-7.

Neurons exploit stochastic growth to rapidly and economically build dense dendritic arbors

Affiliations

Neurons exploit stochastic growth to rapidly and economically build dense dendritic arbors

Xiaoyi Ouyang et al. Nat Commun. .

Abstract

Dendrites grow by stochastic branching, elongation, and retraction. A key question is whether such a mechanism is sufficient to form highly branched dendritic morphologies. Alternatively, does dendrite geometry depend on signals from other cells or from the topological hierarchy of the growing network? To answer these questions, we developed an isotropic and homogenous mean-field model in which branch dynamics depends only on average lengths and densities: that is, without external influence. Branching was modeled as density-dependent nucleation so that no tree structures or network topology was present. Despite its simplicity, the model predicted several key morphological properties of class IV Drosophila sensory dendrites, including the exponential distribution of branch lengths, the parabolic scaling between dendrite number and length densities, the tight spacing of the dendritic meshwork (which required minimal total branch length), and the radial orientation of branches. Stochastic growth also accelerated the overall expansion rate of the arbor. We show that stochastic dynamics is an economical and rapid space-filling mechanism for building dendritic arbors without external guidance or hierarchical branching mechanisms. Our work therefore provides a general theoretical framework for understanding how macroscopic branching patterns emerge from microscopic dynamics.


Conflict of interest statement

Competing interests: The authors declare no competing interests.

Figures

Fig. 1
Fig. 1. Growth of class IV neurons during development.
a Schematic of a Drosophila larva from the dorsal side attacked by a parasitoid wasp. Larval body plan axes are marked with anterior (A), posterior (P), dorsal (D), ventral (V), dorsal left (L), and dorsal right (R). The size of the larva is exaggerated in comparison to the wasp. b Class IV neurons (48 h after egg-lay, AEL) are marked with the transmembrane protein CD4 tagged with green fluorescent protein (GFP) (genotype is;;ppkCD4-tdGFP) and imaged using a 40x water immersion objective by spinning-disk confocal microscopy and displayed as the maximum projection of 10 sections (see Methods). The scale bar is 100 μm and also applies to (ce). White arrowheads indicate tilings. c-e Coarse-grained dendrite length density of class IV neurons at 24 (13 cells from 10 animals), 48 (12 cells from 12 animals), and 96 (9 cells from 9 animals) hours AEL, respectively. The rectangles represent the corresponding average segment sizes at each developmental stage, with gray-shaded regions being the standard error of the mean (9 cells from 3 animals for each developmental stage). f, g Mean dendrite length density along the AP and LR axes at different developmental stages: 24 h in red, 48 h in purple, and 96 h in yellow. The scales in (f, g) are the same as for (b-e).
Fig. 2
Fig. 2. Distribution of branch length and orientation.
a The schematic illustrates branch classification. A terminal branch (blue segment) extends from a branch point (small gray circle) to a tip (red circle), while an internal branch (brown segment) connects either two branch points or a branch point and the soma (large gray circle). For a binary tree, the number of terminal branches exceeds the number of internal branches by one. Theta (θ) denotes the angle of the branch relative to the radial direction (red dashed line). b The skeleton of an example class IV neuron at 48 h AEL showing terminal branches in blue and internal branches in brown. c The average lengths of terminal and internal branches are similar (61 cells ranging from 24−120 h AEL). The black line has a slope of one. The black point corresponds to the cell in (b). Insets show the terminal and internal branches of the dendrite in (b). d Branch lengths at 48 h AEL are shown with exponential fits (ignoring the first bin). e The branches in the same cell as (b) are color-coded by radial angle. fh Radial-angle distributions for all branches, terminal branches only, and internal branches only at 24 and 96 h AEL. The distributions are peaked in the outward direction in (f) and (h) but remain mostly flat in (g).
Fig. 3
Fig. 3. Dendrite dynamics.
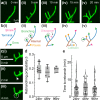
a Time-lapse images illustrating the microscopic behavior of dendrite branches at 24 h AEL. b Schematics of the branch dynamics in (a). Growing, shrinking, and paused tips are indicated by green, magenta, and orange arrowheads, respectively. The green arrowheads with radiating lines indicate branching events. The faded green arrowhead with a dashed line indicates a collision. The faded magenta arrowhead indicates spontaneous branch disappearance. c Time-lapse images of a 24 h class IV dendrite tip showing a debranching event (white arrowhead indicates the site of tip disappearance) and the subsequent rebranching (white circle). d The probability of rebranching within 1520 min of debranching at different developmental stages (24 h: 12 cells from 6 larvae, 48 h: 6 cells from 6 larvae, 96 h: 6 cells from 6 larvae). The points represent cells, and the box-and-whisker plots represent animal averages: long horizontal lines are medians, the boxes enclose the second and third quartiles, and the short horizontal lines (whiskers) show the range. If rebranching were simply due to spontaneous branching near the debranching location (within ± 2 pixels), then the probability of a spontaneous branch in a 15 min recording time would be 0.07 (24 h, 106 nm pixel), 0.021 (48 h, 162 nm pixel) and 0.012 (96 h, 162 nm pixel), smaller than the observed probabilities. The differences between ages are not statistically significant (one-way ANOVA, Tukey correction, 5% level). e Time to rebranch at different developmental stages. (24 h: 71 rebranching events from 6 larvae, 48 h: 22 events from 6 larvae, 96 h: 44 events from 6 larvae). Box-and-whisker plots are defined as in (d). Spontaneous branching would lead to apparent rebranching times of 300 min, 1000 min, and 1700 min respectively, much longer than the observed times. The differences between ages are not statistically significant (one-way ANOVA, Tukey correction, 5% level).
Fig. 4
Fig. 4. Mean-field model.
a Schematic of a radially symmetrical class IV dendrite. The red arrow shows the radial direction within the black-box region. b Zoomed-in view of tip dynamics. Terminal branches (blue) transition between growing (green), shrinking (magenta), and paused (orange) states. Branches are lost in two ways. Either they collide with their base (length zero) in the shrinking state, or they collide with another branch and disappear. New branches are born by spontaneous branching or by regrowing following shrinkage to zero length (“rebranching”, green arrowhead with radiating lines on top of a faded magenta arrowhead). l and θ denote branch length and radial angle, respectively. c An example frame from the directed-rod simulation. d Schematic of the mean-field model. Dendrite densities of the growing (green), shrinking (magenta), and paused (orange) states are represented along the branch length axis with their corresponding colors. Dependence of dendrite densities on radial angle, radial position, and time are omitted. Green arrowheads represent the flow of growing dendrite density toward longer branch lengths due to elongation. Magenta arrowheads represent the flow of shrinking dendrite density toward shorter branch lengths due to retraction. State transitions are shown by gray triangles perpendicular to the length axes. Collision-based disappearance of growing dendrites is represented by black parallel arrows pointing away from the growing length axis. Additionally, boundary fluxes from branching, rebranching, and spontaneous disappearance are plotted at the left zero-length boundary (l=0).
Fig. 5
Fig. 5. The mean-field model predicts the steady-state branch lengths and densities.
a Experimental measurements (gray circles) of average branch length at 24 h (13 cells), 48 h (12 cells), and 96 h (9 cells) AEL. The means and standard deviations are superimposed as vertical bars. The model predictions with rebranching probabilities, β, varying from 0 to 1 are visualized by color-coded bars; the measured value of 0.2 is indicated by the red rectangle. The crosses are the characteristic lengths of the measured exponential distributions. Predictions from the one-state model are shown in red circles. See Methods for statistical analysis. b Measurements and model predictions of average length density. See (a) for details. c The parabolic relation between number density and length density. Each point represents a different cell. The solid line is predicted by the model using the parameters at 48 h AEL in Table 1. Parameters from 24 and 96 h AEL produce similar results. d The same data are plotted on a log-log axis, together with data from Horizontal System (HS) cells from Drosophila melanogaster and from the larger fly, Calliphora erythrocephala,. The model prediction is shown as the green line. The linear fit to the class IV data is Ntot=αρtotp with α=0.84 ( ± 2SE range 0.69 to 0.98) and p=1.84 ( ± 2SE range 1.75 to 1.94). The fit to the directed-rod simulations (shown as the black line) has α=1.03 ( ± 2SE range 1.02 to 1.04) and p=2.01 ( ± 2 SE range 2.01 to 2.02). e Mesh sizes for several tilings listed in the legend. The black solid line corresponds to regular 2D tilings, while the lower and upper dashed lines represent equally spaced and randomly spaced horizontal line patterns, respectively. f Examples of tilings of the plane by regular and irregular shapes. All tilings have the same length density. The red circles indicate the inscribed circles of the polygonal tilings. The blue circles represent the characteristic mesh size, defined as circles with a 50% chance of intersecting the branches.
Fig. 6
Fig. 6. The mean-field model reveals that arbor expansion is driven by length fluctuations.
a Measured arbor diameters are plotted from 24–120 h AEL along the anterior-posterior (AP) and left-right (LR) axes. Growth initiates at 16 h AEL from a soma of size 10 µm (black hollow circle). Cubic regressions used to fit the front speed are shown in solid lines. b Dendrite length density along the LR axis is normalized by its central density. Solid lines show the mean front profiles at 24 (red), 48 (purple), and 96 (yellow) hours AEL, averaged from individual neuron front profiles shown in faded lines aligned at 10% of their central length density. The lower 25% of the densities are fitted with exponential functions (dashed lines) to estimate the decay length. c Allowed values of the front speed c and decay length λ by Eq. (16). The marginally stable solution coincides with the global minimum of the front speed confined on the c-λ curve (solid circles). The average measured front speed and decay length along the LR axis are visualized by solid triangles. d Numerical solutions of the dendrite density at 1600 min from an initial isotropic sigmoid front of radius ~10 µm. The computation uses parameters at 48 h AEL. e, f Front speed and front decay length from measurements along AP and LR axes, theoretical predictions, and numerical solutions at 24, 48, and 96 h AEL. All errors are standard deviations. Those for the theory are estimated by bootstrapping (Methods: Statistical Analysis).
Fig. 7
Fig. 7. Length fluctuation increases arbor expansion speed.
a Phase diagram of front speed as a function of the tip drift velocity (x-axis) and effective diffusion coefficient (y-axis). The black circle corresponds to the measured average tip speed at 48 h AEL. The error bar represents the standard error in tip speed at 48 h AEL. The black curve represents the contour of constant front speed passing through the black circle. The red curve indicates the phase boundary, which represents a threshold below which the arbor cannot grow. b Simulated arbor sizes after 1000 min using different mean tip velocities and length fluctuations indicated in (a). I: data at 48 h. II: zero average tip speed. III: increased average tip speed. IV: Increased fluctuations. V: Decreased fluctuations. The color code represents normalized dendrite density. Representative directed-rod simulations are superimposed. See growth dynamics of these simulations in Supplementary Fig. 7.
Fig. 8
Fig. 8. Radial orientation of dendrite branches.
a The dendrites are separated into frontal and central regions. The same skeletonized neuron as in Fig. 2b is shown (48 h AEL). b, c Radial-angle distributions of terminal and internal branches at 48 h AEL within the frontal and central regions, respectively. The black curves represent mean-field predictions using 48-h parameters, agreeing with the terminal-branch distributions. d The radial orientation of dendrites computed from directed-rod simulations is visualized by the order parameter j=1Meiθj/M (zero corresponds to a uniform radial distribution). The left and right halves depict, respectively, the order parameter from the mean-field theory and the directed-rod simulations. The right half is overlaid with a representative configuration snapshot from the simulation. e, f The directed-rod simulations (histograms) align closely with the mean-field theory (solid line).

Update of

Similar articles

References

    1. Winding, M. et al. The connectome of an insect brain. Science379, eadd9330 (2023). - PMC - PubMed
    1. Schlegel, P. et al. Whole-brain annotation and multi-connectome cell typing of Drosophila. Nature634, 139–152 (2024). - PMC - PubMed
    1. Rockhill, R. L., Daly, F. J., MacNeil, M. A., Brown, S. P. & Masland, R. H. The diversity of ganglion cells in a mammalian retina. J. Neurosci.22, 3831–3843 (2002). - PMC - PubMed
    1. Jan, Y. N. & Jan, L. Y. Branching out: mechanisms of dendritic arborization. Nat. Rev. Neurosci.11, 316–328 (2010). - PMC - PubMed
    1. Chklovskii, D. B. Synaptic connectivity and neuronal morphology: two sides of the same coin. Neuron43, 609–617 (2004). - PubMed

LinkOut - more resources