. 2025 Jul 1;16(1):5883.
doi: 10.1038/s41467-025-60754-w.

Commitment of adipose-resident c-kit+ progenitors to brown adipocytes contributes to adipose tissue homeostasis and remodeling

Affiliations

Commitment of adipose-resident c-kit+ progenitors to brown adipocytes contributes to adipose tissue homeostasis and remodeling

Qishan Chen et al. Nat Commun. .

Abstract

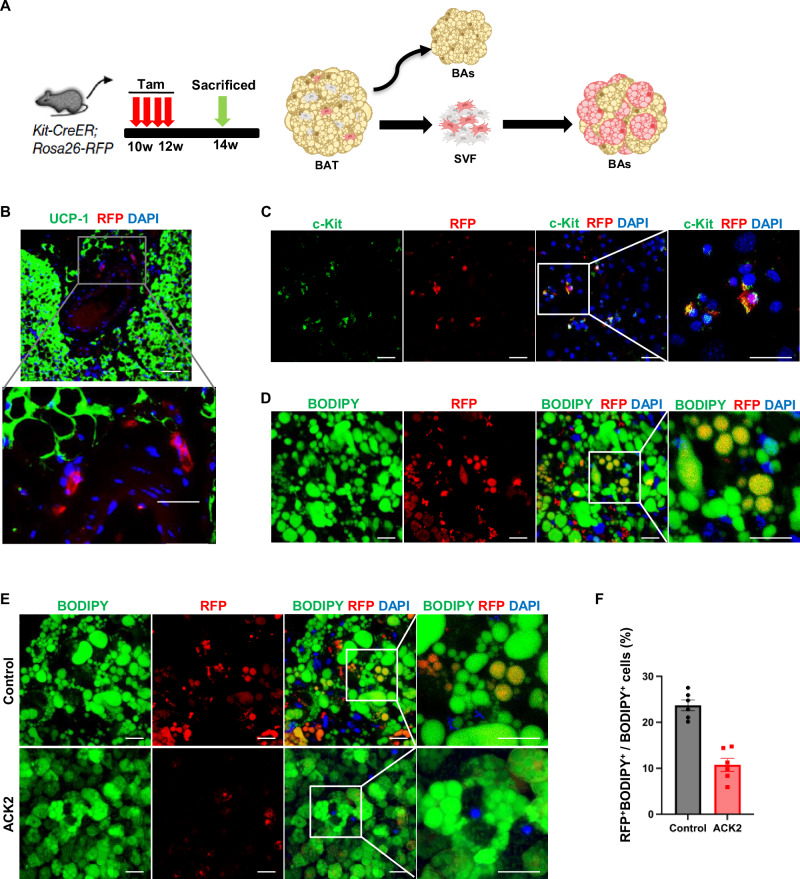
The global incidence of obesity-related metabolic disorders and their comorbidities continue to increase along with a demand for innovative therapeutic interventions. An in-depth understanding of de novo thermogenic adipogenesis is vital to harness the potential of these adipocytes. Here, we combine genetic lineage tracing and single-nucleus RNA sequencing to demonstrate that adult adipose-resident c-kit+ cells are previously unidentified brown adipocyte progenitor cells (APCs). c-kit+ APCs differentiate into brown adipocytes but not white adipocytes in adipose tissue homeostasis as well as in cold exposure-, high-fat diet (HFD)- and aging-induced adipose remodeling. More importantly, the vital role of c-kit+ APCs in the generation of brown adipocytes is indicated by decreased brown fat, impaired thermogenic capacity, and excessive fat accumulation in c-kit mutant mice of both genders. In conclusion, the present study demonstrates that adult c-kit+ APCs give rise to brown adipocytes which are responsible for fat homeostasis and remodeling. Thus, c-kit+ progenitors may be an innovative and crucial target for obesity and metabolic diseases.


Conflict of interest statement

Competing interests: The authors declare no competing interests.

Figures

Fig. 1
Fig. 1. snRNA-seq indicates that adipose-resident c-kit+ cells are previously unidentified thermogenic APCs.
A t-distributed stochastic neighbor embedding (tSNE) plot of cell nuclei isolated from iBAT of Kit-CreER; Rosa26-RFP mice after exposure to cold temperature for 4 weeks after tamoxifen (Tam) administration, showing 16 subpopulations. B Bubble plots showing expression levels and distributions of representative transcripts for the selected genes among different cell clusters. The dot size represents the percentage of cells that expressed the gene, and the color represents the scaled value of the average expression level of gene X in cluster Y. The average expression levels of genes are calculated by normalization of the transcriptome data (gene sequence reads by a factor of 10,000, with log-transformed). C Violin plots showing expression levels of representative transcripts for adipose progenitor marker genes, including Pdgfrα, Kit, Cd34, Ly6a, Dpp4, Trpv1, Ebf2, and Erbb4 in c-kit+ APCs and PDGFRα+ APCs. D Gene Ontology enrichment analysis of the transcripts significantly upregulated by cold stimulation in c-kit+ adipocyte progenitors.
Fig. 2
Fig. 2. Lineage trajectory of c-kit+ cells in adipogenesis revealed their commitment to brown adipocytes.
A tSNE plot of c-kit+ APCs, two subpopulations of pre-brown adipocytes (Pre-BAs-1 and Pre-BAs-2 clusters), and four subpopulations of brown adipocytes (BAs-1, BAs-2, BAs-3, and BAs-4 clusters). B tSNE plots showing the distribution and expression of the indicated genes (Pparg, Pparα, Ppargc1α, Prdm16, Elovl6, Lipe, Pnpla2, Pnpla3, Ucp1, Cidea, Cox7a1, and Cox8b) across these cell clusters. C Trajectory analysis was performed to determine the significant transitional relationships among the c-kit+ APCs, Pre-BAs-1, Pre-BAs-2, BAs-1, BAs-2, BAs-3, and BAs-4 clusters. D Pseudotime curves were calculated for the c-kit+ APCs, Pre-BAs, and BAs, indicating the contribution of c-kit+ APCs to brown adipogenesis. E Distribution of RFP expression in c-kit+ APCs, as well as the Pre-BAs and BAs clusters within the tSNE plot. F Quantitation of the percentage of RFP+ cells in c-kit+ APCs and the two subpopulations of pre-brown adipocytes and four subpopulations of brown adipocytes. G Distribution of RFP+ cells in the lineage trajectory of c-kit+ APCs, Pre-BAs, and BAs.
Fig. 3
Fig. 3. c-kit+ progenitor cells are able to differentiate into mature brown adipocytes.
A Schematic of the Tam induction strategy for Kit-CreER; Rosa26-RFP mice, and isolation of the stromal vascular fraction for culture and differentiation into brown adipocytes. Partial elements created in BioRender. Yang, M. (2025) https://BioRender.com/x6xcmbq. B Representative immunofluorescence staining with RFP and UCP1 indicates the presence of c-kit+ APCs in the stromal vascular fraction of iBAT. Scale bar = 100 μm, n = 6 mice. C Representative images of stromal cells double-stained for c-Kit and RFP, Scale bar = 50 μm. D Representative images of brown adipocytes double-stained for BODIPY and RFP, Scale bar = 50 μm. C, D Each experiment was independently reproduced at least 3–4 times. E Representative images of control and ACK2-treated brown adipocytes double-stained for BODIPY and RFP, Scale bar = 50 μm. F Quantitative analysis of RFP+ BODIPY + cells. Each dot indicates a value from one cell experiment, n = 6. The data are presented as the mean ± SEM. *P < 0.05 (Control versus ACK2).
Fig. 4
Fig. 4. Genetic lineage tracing of c-kit+ progenitors converting to brown adipocytes during fat homeostasis.
A Schematic depicting the experimental procedures. Ten-week-old Kit-CreER; Rosa26-RFP mice were administered with Tam, and different adipose tissues were collected at 10 and 40 weeks after Tam treatment, respectively, for analysis. BG Classic interscapular brown adipose tissue (iBAT), iBAT that interfaces with interscapular white adipose tissue (iBAT/iWAT), and perigonadal white adipose tissue (pgWAT) were collected for immunofluorescence staining of the red fluorescent protein (RFP) lineage marker and the uncoupling protein 1 (UCP1) thermogenic marker, n = 6 mice/group. At 10 weeks post-Tam treatment, RFP+UCP1+ cells were observed in iBAT (B) and iBAT/iWAT (C), whereas few RFP+UCP+ cells were observed in pgWAT (D). At 40 weeks post-Tam treatment, more RFP+UCP1+ cells were observed in iBAT (E) and iBAT/iWAT (F) but not in pgWAT (G). Scale bar = 100 μm.
Fig. 5
Fig. 5. Dynamic recruitment of c-kit+ progenitor-derived brown adipocytes is involved in pathophysiological adipose remodeling.
A Schematic depicting the experimental procedure for the exposure of Kit-CreER; Rosa26-RFP mice to cold temperature (4 °C) or to room temperature (RT; 22 °C) for 4 weeks after Tam treatment. B Representative H&E staining of adipose tissue sections of iBAT and ingWAT depots in the cold and RT group, n = 6 mice/group. C-D Immunofluorescence (IF) staining of tissue sections of iBAT (C) and ingWAT (D) for RFP and UCP1. Quantitative analysis showing cold exposure increased the percentages of RFP+UCP1+ cells both in iBAT (C) and ingWAT (D). C, D Each dot indicates a value from one mouse and n = 6 mice/group. The data are presented as the mean ± SEM. *P < 0.05 (RT versus Cold). E Schematic illustrating Tam-induced Kit-CreER; Rosa26-RFP mice fed on a high-fat diet (HFD) or chow diet (Control) for 16 weeks. F H&E staining of adipose tissue sections of iBAT and ingWAT depots from control and HFD mice, n = 6 mice/group. G-H Representative IF images of iBAT (G) and ingWAT (H) tissue sections double-stained for RFP and UCP1. Quantitative analysis indicating that HFD significantly reduced the proportion of RFP+UCP1+ cells in iBAT (G). RFP+UCP1+ cells were scarcely observed in ingWAT (H) in both the control and HFD mice. G Each dot indicates a value from one mouse and n = 8 mice/group. The data are presented as the mean ± SEM. *P < 0.05 (Control versus HFD). H Each dot indicates a value from one mouse and n = 7 mice/group. The data are presented as the mean ± SEM. *P < 0.05 (Control versus HFD). I Graph representing adipose tissues was collected for analysis from Kit-CreER; Rosa26-RFP mice at 10 weeks, 40 weeks, 70 weeks, and 100 weeks after Tam treatment. J Quantitation of RFP+UCP1+ cells in iBAT at different ages. Each dot indicates a value from one mouse and n = 4 mice/group. The data are presented as the mean ± SEM. *P < 0.05 (Tam 40 w versus Tam 70 w; Tam 70 w versus Tam 100 w). Scale bar = 100 μm. K Representative images of iBAT tissue sections double-stained for RFP and UCP1 at indicated time points.
Fig. 6
Fig. 6. c-kit inhibition results in obesity and reduced brown adipogenesis.
A Representative photograph of 50-week-old c-kit+/+and c-kitw/+ mice. B Body weights of c-kit+/+and c-kitw/+ mice over 80 weeks on a standard chow diet. Each dot indicates a value from one mouse and n = 9–14 mice/group. The data are presented as the mean ± SEM. *P < 0.05 (c-kit+/+ mice versus c-kitw/+ mice). C The body compositions of c-kit+/+and c-kitw/+ mice were detected by a Body Composition Analyzer. Each dot indicates a value from one mouse and n = 8 mice/group. The data are presented as the mean ± SEM. *P < 0.05 (c-kit+/+ mice versus c-kitw/+ mice). D Representative PET-CT images of mice after a cold challenge study for 4 h at 4 °C and quantitative analysis of the 18FDG uptake in BAT as indicated by the percentage injected dose per gram of tissue (%ID/g). Each dot indicates a value from one mouse and n = 5 mice/group. The data are presented as the mean ± SEM. *P < 0.05 (c-kit+/+ mice versus c-kitw/+ mice). E Adipose tissue sections from iBAT, ingWAT, and pgWAT of c-kit+/+and c-kitw/+mice were collected and stained with H&E (left). Quantitative analysis of the lipid droplet surface of stained adipose tissue sections (right). Each dot indicates a value from one mouse and n = 4 mice/group. The data are presented as the mean ± SEM. *P < 0.05 (c-kit+/+ mice versus c-kitw/+ mice). F Schematic of the experimental procedure for Kit-CreER; Rosa26-RFP mice with localized inhibition of c-kit by intra-iBAT injection of IgG control or ACK2 and exposure to cold temperature (4 °C) for 2 weeks. Partial elements created in BioRender. Yang, M. (2025) https://BioRender.com/90iw46s. G Immunofluorescence staining of the tissue sections of iBAT for RFP and UCP1 (left). Quantitative analysis showed local injection of ACK2 decreased the percentages of RFP+UCP1+ cells in iBAT (right). Each dot indicates a value from one mouse and n = 8 mice/group. The data are presented as the mean ± SEM. *P < 0.05 (c-kit+/+ mice versus c-kitw/+ mice). H The weight of different adipose tissues. Each dot indicates a value from one mouse, and n = 15–16 mice/group. The data are presented as the mean ± SEM. *P < 0.05 (c-kit+/+ mice versus c-kitw/+ mice). I Relative mRNA level of browning genes in iBAT in mice treated with Control and ACK2. Each dot indicates a value from one mouse and n = 7-11 mice/group. The data are presented as the mean ± SEM. *P < 0.05 (c-kit+/+ mice versus c-kitw/+ mice). J Rectal temperature in mice treated with Control and ACK2. *P < 0.05 (c-kitw/+ versus c-kit+/+ or ACK2 versus Control). Each dot indicates a value from one mouse and n = 8 mice/group. The data are presented as the mean ± SEM. *P < 0.05 (c-kit+/+ mice versus c-kitw/+ mice).

References

    1. Oikonomou, E. K. & Antoniades, C. The role of adipose tissue in cardiovascular health and disease. Nat. Rev. Cardiol.16, 83–99 (2019). - PubMed
    1. Ghaben, A. L. & Scherer, P. E. Adipogenesis and metabolic health. Nat. Rev. Mol. Cell Biol.20, 242–258 (2019). - PubMed
    1. Cypess, A. M. et al. Identification and importance of brown adipose tissue in adult humans. N. Engl. J. Med.360, 1509–1517 (2009). - PMC - PubMed
    1. Saito, M. et al. High incidence of metabolically active brown adipose tissue in healthy adult humans: effects of cold exposure and adiposity. Diabetes58, 1526–1531 (2009). - PMC - PubMed
    1. Claussnitzer, M. et al. FTO obesity variant circuitry and adipocyte browning in humans. N. Engl. J. Med.373, 895–907 (2015). - PMC - PubMed

MeSH terms

Substances