. 2025 Jul 1;16(1):5543.
doi: 10.1038/s41467-025-60654-z.

Intraindividual epigenetic heterogeneity underlying phenotypic subtypes of advanced prostate cancer

Affiliations

Intraindividual epigenetic heterogeneity underlying phenotypic subtypes of advanced prostate cancer

Kei Mizuno et al. Nat Commun. .

Abstract

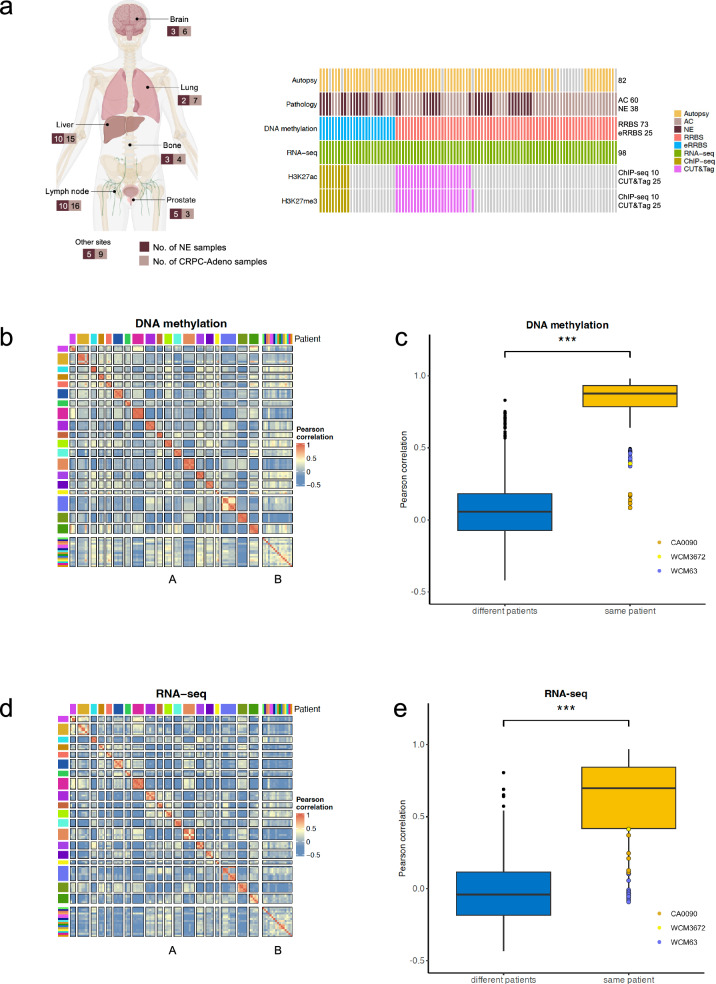
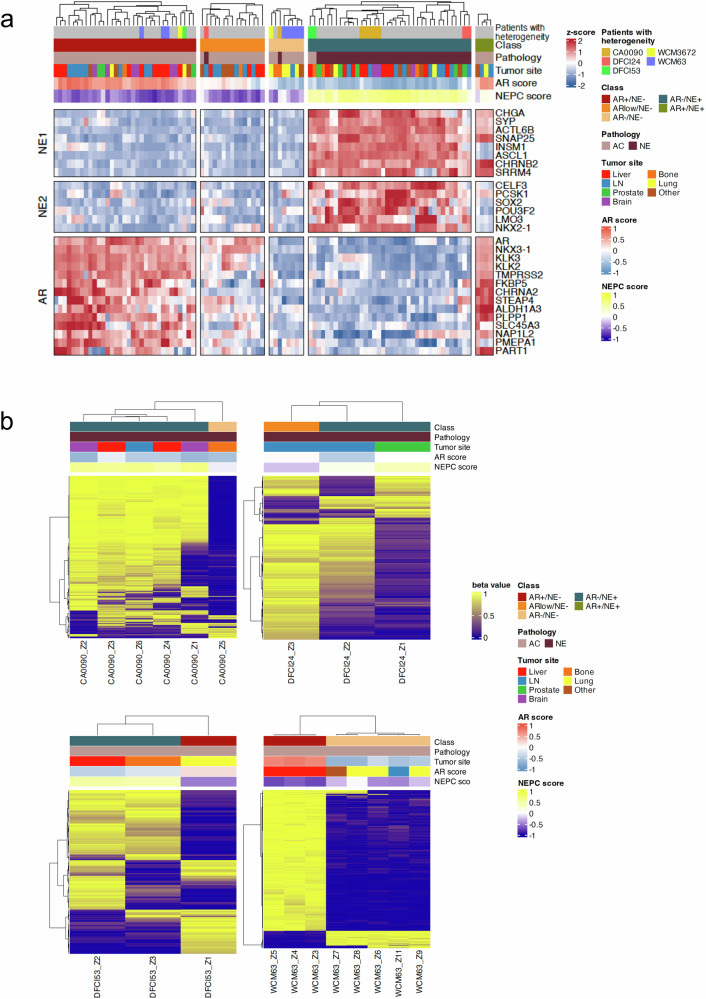
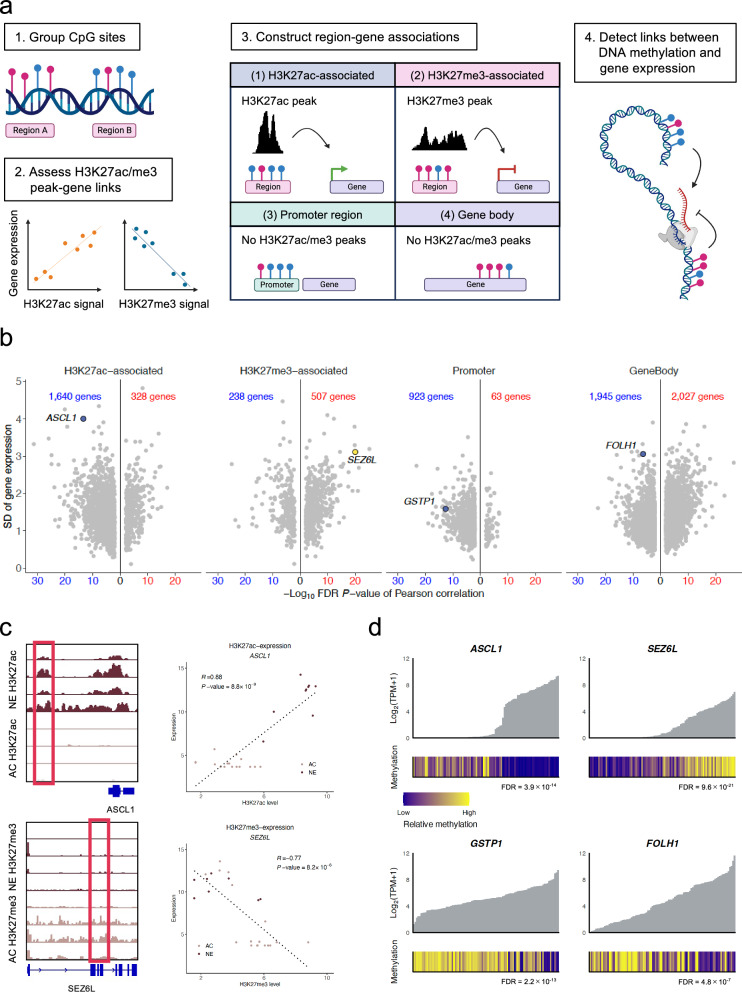
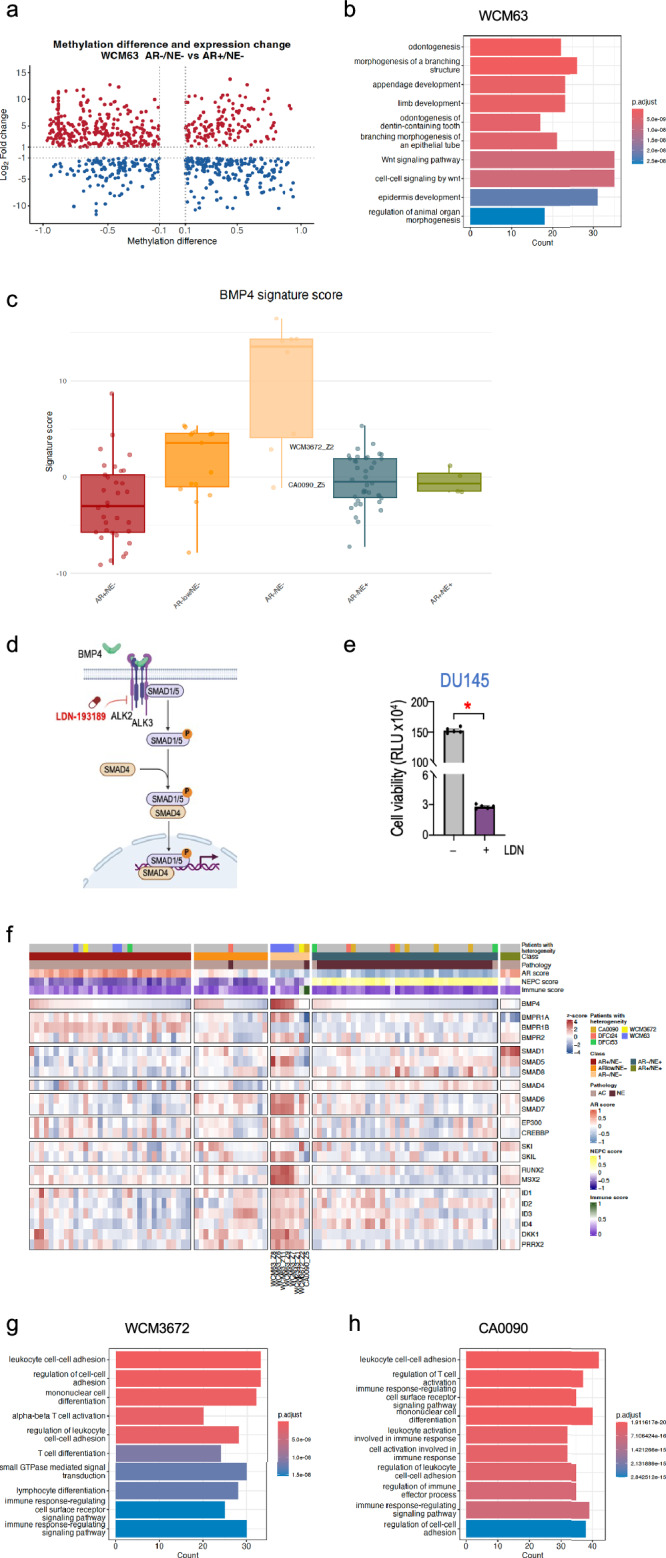
Castration-resistant prostate cancer is a heterogeneous disease with variable phenotypes commonly observed in later stages of the disease. These include cases that retain expression of luminal markers and those that lose hormone dependence and acquire neuroendocrine features. While there are distinct transcriptomic and epigenomic differences between castration-resistant adenocarcinoma and neuroendocrine prostate cancer, the extent of overlap and degree of diversity across tumor metastases in individual patients has not been fully characterized. Here we perform combined DNA methylation, RNA-sequencing, H3K27ac, and H3K27me3 profiling across metastatic lesions from patients with CRPC/NEPC. Integrative analyses identify DNA methylation-driven gene links based on location (H3K27ac, H3K27me3, promoters, gene bodies) pointing to mechanisms underlying dysregulation of genes involved in tumor lineage (ASCL1, AR) and therapeutic targets (PSMA, DLL3, STEAP1, B7-H3). Overall, these data highlight how integration of DNA methylation with RNA-sequencing and histone marks can inform intraindividual epigenetic heterogeneity and identify putative mechanisms driving transcriptional reprogramming in castration-resistant prostate cancer.


Conflict of interest statement

Competing interests: T.K.C reports institutional and/or personal, paid and/or unpaid support for research, advisory boards, consultancy, and/or honoraria past 10 years, ongoing or not, from Alkermes, Arcus Bio, AstraZeneca, Aravive, Aveo, Bayer, Bristol Myers-Squibb, Bicycle Therapeutics, Calithera, Circle Pharma, Deciphera Pharmaceuticals, Eisai, EMD Serono, Exelixis, GlaxoSmithKline, Gilead, HiberCell, IQVA, Infinity, Institut Servier, Ipsen, Jansen, Kanaph, Lilly, Merck, Nikang, Neomorph, Nuscan/PrecedeBio, Novartis, Oncohost, Pfizer, Roche, Sanofi/Aventis, Scholar Rock, Surface Oncology, Takeda, Tempest, Up-To-Date, CME and non-CME events (Mashup Media Peerview, OncLive, MJH, CCO), for work unrelated to the present study. A.K.T. reports institutional research funding from Novartis for work unrelated to the present study. D.E. reports institutional research funding and honoraria from Bayer, Bristol-Myers Squibb, Cardiff Oncology, MiNK Therapeutics, Novartis, Puma Biotechnology, Sanofi, Nimbus Therapeutics, Foundation Medicine, for work unrelated to the present study. S.S. has served as a consultant advisor for Bristol Myers Squibb, Merck Sharp and Dohme, AstraZeneca, Novartis, Janssen and Merck Serono (funds go to the institution) and received research grants for investigator-initiated trials from Novartis, Genentech, Amgen, AstraZeneca, Merck Serono, Merck Sharp and Dohme, Pfizer and Senwha (funds go to the institution) for work unrelated to the present study. H.B. has served as consultant/advisory board member for Astra Zeneca, Merck, Pfizer, Amgen, Novartis, Bayer, Daiichi Sankyo, and has received research funding (to institution) from Janssen, Bristol Myers Squibb, Circle Pharma, Daiichi Sankyo, Novartis for work unrelated to the present study. The remaining authors declare no competing interests.

Figures

Fig. 1
Fig. 1. DNA methylation and transcriptional profiling of metastatic CRPC samples.
a Study design showing sample collection and multi-omic profiling strategy. Cases include 35 patients with metastatic CRPC (9 NEPC, 26 CRPC-Adeno), including 21 rapid autopsies with multiple anatomic sites assessed. Samples underwent DNA methylation profiling by RRBS/ERRBS, RNA sequencing, and H3K27ac/H3K27me3 ChIP-seq/CUT&Tag. NE, neuroendocrine. Figure 1/panel was partially created in BioRender. Mizuno, K. (2025) https://BioRender.com/hgg1f0e. b Correlation analysis of DNA methylation profiles. Panel A shows patients with multiple samples and panel B shows patients with single samples. Samples are grouped by patient and colored by patient ID. Color intensity represents Pearson correlation coefficients, demonstrating high correlation between samples from the same patient. c Pearson correlation coefficients of DNA methylation profiles between pairs of samples from the same patient (intra-patient, yellow, n = 156) versus different patients (inter-patient, blue, n = 4.597). Box plots show median, quartiles and whiskers extending to 1.5× the interquartile range. Data beyond the end of the whiskers are outliers and are plotted individually. ***, p-value  <  0.001, statistical analyses used Wilcoxon two-sided tests. Patients with intraindividual heterogeneity (WCM63, CA0090, WCM3672) are highlighted. d Correlation analysis of gene expression profiles organized as in (b), showing high correlation between samples from the same patient. e Pearson correlation coefficients of gene expression profiles between intra-patient (yellow, n = 156) versus inter-patient (blue, n = 4.597) sample pairs. Box plots show median, quartiles and whiskers extending to 1.5× the interquartile range. Data beyond the end of the whiskers are outliers and are plotted individually. ***, p-value  <  0.001, statistical analyses used Wilcoxon two-sided tests. Patients showing intraindividual heterogeneity in DNA methylation comparison (WCM63, CA0090, WCM3672) are highlighted.
Fig. 2
Fig. 2. Intraindividual heterogeneity in CRPC.
a Molecular subtype analysis (n = 98) reveals five cases with heterogeneous phenotypes across tumor sites (CA0090, DFCI24, DFCI53, WCM3672, WCM63). Heatmap shows the expression of genes associated with AR and NE program across samples. b DNA methylation clustering of samples from four cases showing intraindividual heterogeneity: CA0090 (n = 6), DFCI24 (n = 3), DFCI53 (n = 3), and WCM3672 (n = 8).
Fig. 3
Fig. 3. Integration of DNA methylation, gene expression and histone modification data.
a Analytical workflow for identifying methylation-driven gene regulation. Figure 3/panel a was created in BioRender. Mizuno, K. (https://BioRender.com/703sb5t). b Distribution of correlations between DNA methylation and gene expression by genomic context (H3K27ac regions, H3K27me3 regions, promoters, gene bodies). Blue text indicates negative correlation between DNA methylation and gene expression, while red text indicates positive correlation. SD, standard deviation. c Example loci showing differential regulation. Left panels: Genomic regions (highlighted in red boxes) showing significant correlation between histone modifications and gene expression. Upper track shows region with positive correlation between H3K27ac signal and ASCL1 expression; lower track shows region with negative correlation between H3K27me3 signal and SEZ6L expression. Right panels: Scatter plots demonstrating these correlations between histone modification signals and gene expression. Upper panel: Scatter plot showing correlation between H3K27ac signal and ASCL1 expression (AC: adenocarcinoma, pale pink, n = 16; NE: neuroendocrine, burgundy, n = 9). Lower panel: Scatter plot showing correlation between H3K27me3 signal and SEZ6L expression (AC, pale pink, n = 17; NE, burgundy, n = 8). Statistical significance was assessed using two-sided Pearson correlation tests. d Representative examples of methylation-expression relationships for key prostate cancer genes across samples (n = 98). Bar plots show sample-level gene expression values, with DNA methylation levels indicated by color. False discovery rate (FDR) values for correlations between gene expression and DNA methylation are shown.
Fig. 4
Fig. 4. BMP4 pathway and immune signatures define distinct double negative CRPC.
a DNA methylation-regulated genes identified in WCM63 AR − /NE− versus AR + /NE− samples. Red and blue dots indicate highly upregulated and downregulated genes, respectively, that show significant expression changes and substantial methylation differences in their associated regions. b Gene Ontology analysis of identified DNA methylation-upregulated genes in WCM63 double negative samples (n = 5) shows enrichment of GO terms with BMP4 and its downstream targets. Statistical analysis for GO enrichment was performed using one-sided Fisher’s exact test with Benjamini-Hochberg correction for multiple testing. c BMP4 signature scores across all sample subtypes: AR + /NE− (n = 33, red), AR-low/NE− (n = 15, orange), AR − /NE− (n = 8, light orange), AR − /NE+ (n = 38, green), and AR + /NE+ (n = 4, blue). The plot shows elevated pathway activity in most double negative samples, with low scores in double negative samples from WCM3672 and CA0090. Box plots show median, quartiles and whiskers extending to 1.5× the interquartile range. Individual data points are plotted as overlaid dots. d Schematic of BMP4 signaling and ALK inhibition using LDN-193189. Figure 4/panel d was created in BioRender. Venkadakrishnan, VB. (https://BioRender.com/my372kw). e DU145 cells treated with vehicle (–) or 2 μM LDN-193189 (LDN, ALK inhibitor) for 6 days and assessed using CellTiter-Glo® luminescent cell viability assay. Data represent mean values ± SEM from five independent biological replicates per condition (n = 5 independent experiments/condition). Gray columns, vehicle treatment; purple columns, LDN-193189 treatment. Statistical significance was determined using Wilcoxon two-sided tests; *, p < 0.05; RLU, Relative Light Units. f Heatmap showing expression of BMP4 and BMP4 signaling pathway-related genes across all samples (n = 98), with corresponding immune scores shown. Double negative samples (n = 8) exhibit either high BMP4 pathway activity or high immune scores in this cohort. g, h Gene Ontology analysis of DNA methylation-upregulated genes in double negative samples from WCM3672 (g) and CA0090 (h) reveals enrichment of immune-related processes. Statistical analysis for GO enrichment was performed using one-sided Fisher’s exact test with Benjamini-Hochberg correction for multiple testing.

Similar articles

References

    1. Wang, Z. A., Toivanen, R., Bergren, S. K., Chambon, P. & Shen, M. M. Luminal cells are favored as the cell of origin for prostate cancer. Cell Rep.8, 1339–1346 (2014). - PMC - PubMed
    1. Beltran, H. et al. Divergent clonal evolution of castration-resistant neuroendocrine prostate cancer. Nat. Med. 22, 298–305 (2016). - PMC - PubMed
    1. Bluemn, E. G. et al. Androgen receptor pathway-independent prostate cancer is sustained through FGF signaling. Cancer Cell32, 474–489.e6 (2017). - PMC - PubMed
    1. Aggarwal, R. et al. Clinical and genomic characterization of treatment-emergent small-cell neuroendocrine prostate cancer: a multi-institutional prospective study. J. Clin. Oncol.36, 2492–2503 (2018). - PMC - PubMed
    1. Zhao, S. G. et al. The DNA methylation landscape of advanced prostate cancer. Nat. Genet. 52, 778–789 (2020). - PMC - PubMed

MeSH terms