. 2025 Jul 1;16(1):5547.
doi: 10.1038/s41467-025-60509-7.

Host glutathione is required for Rickettsia parkeri cell division and intracellular survival

Affiliations

Host glutathione is required for Rickettsia parkeri cell division and intracellular survival

Han Sun et al. Nat Commun. .

Abstract

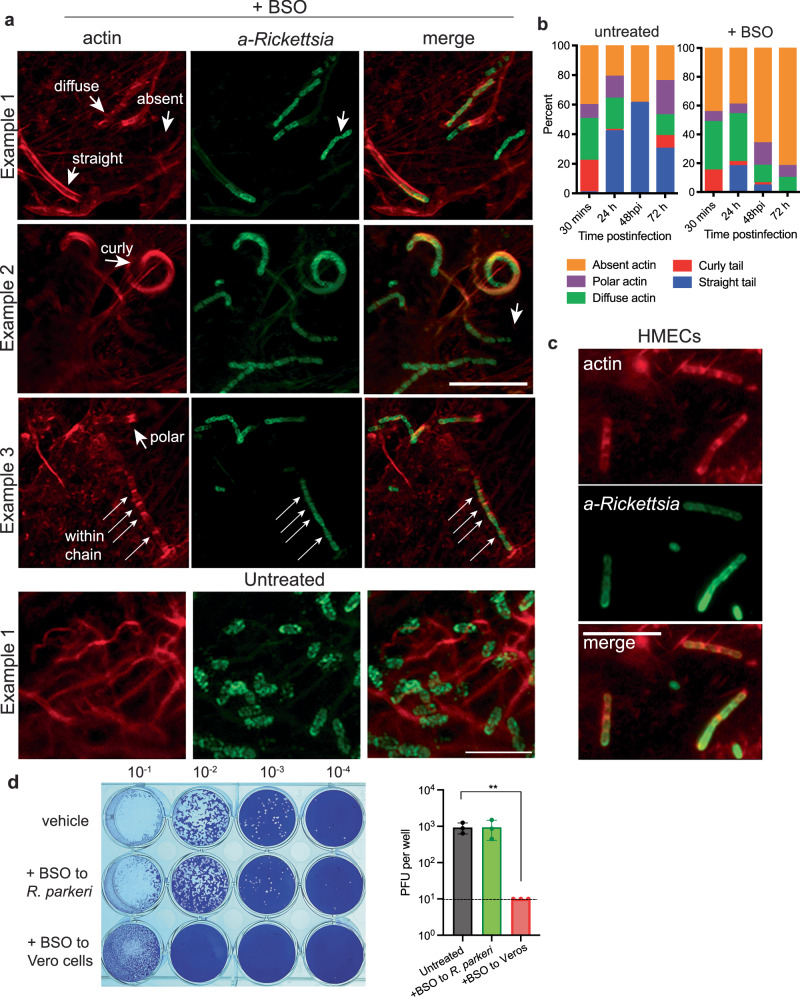
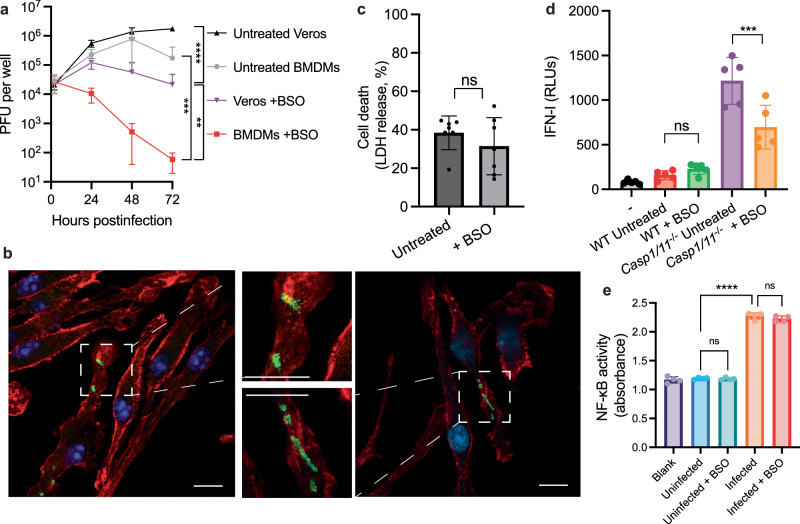
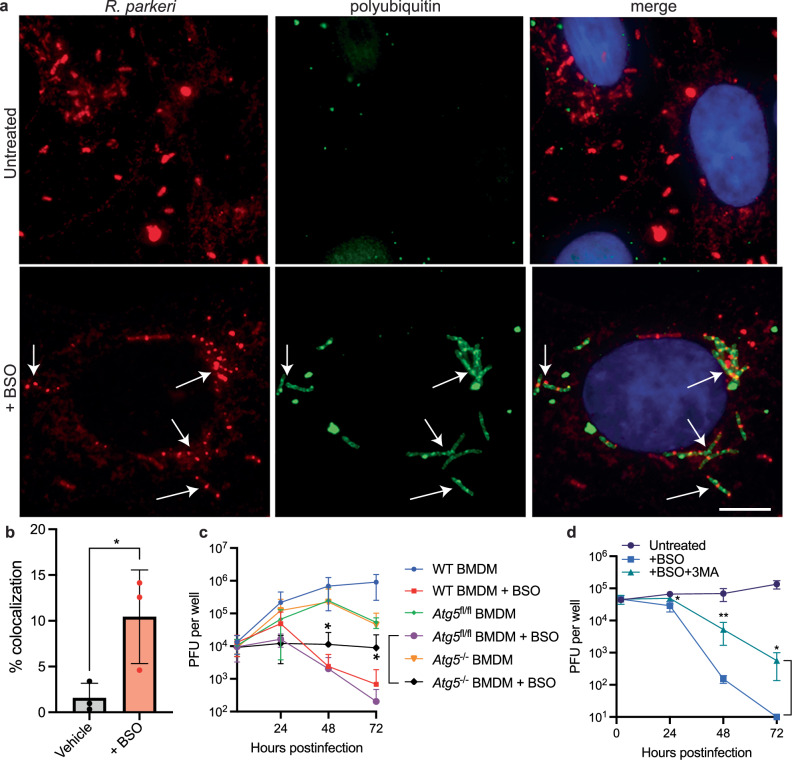
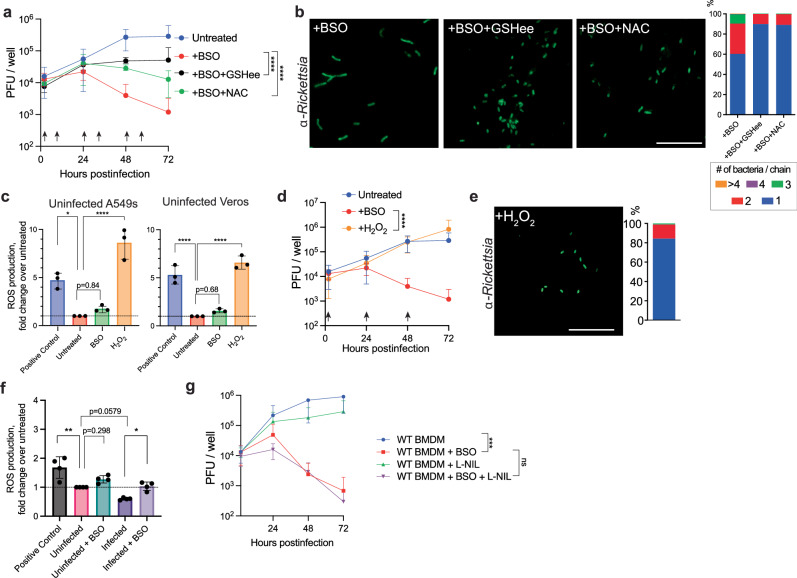
Intracellular bacteria rely on eukaryotic metabolites for their fitness and pathogenesis. Yet, the mechanisms of how host metabolites promote bacterial physiology and immune evasion are often unclear. Here, we employed obligate cytosolic Rickettsia parkeri, which parasitizes over fifty host metabolites, to investigate bacterial utilization of host glutathione (GSH). We observed that GSH depletion impaired R. parkeri intracellular survival. Super-resolution microscopy revealed that GSH depletion caused bacterial chaining in the host cytosol, prohibiting proper actin-based motility and cell-to-cell spread. GSH was especially critical for bacterial survival in primary macrophages, where it enabled R. parkeri to evade ubiquitylation and antibacterial autophagy. Cell division and survival defects were restored by supplementing N-acetylcysteine, suggesting that GSH serves as a cysteine source for R. parkeri. Together, these data suggest that Rickettsia requires GSH as a nutrient source to promote cell division, actin-based motility, evasion of antibacterial autophagy, and intracellular survival. This knowledge contributes to the expanding paradigm that GSH plays diverse roles in the pathogenesis of intracellular bacteria and represents a potential target for host-acting therapeutics.


Conflict of interest statement

Competing interests: The authors declare no competing interests.

Figures

Fig. 1
Fig. 1. GSH is required for cell division and growth of R. parkeri in epithelial cells.
a R. parkeri abundance in Vero cells infected at an MOI of 1, untreated or treated with 2 mM BSO overnight prior to infection. Infected cells were lysed at the indicated times and plated for PFU. Data are the compilation of four separate experiments and are expressed as means ± SD. Statistics used a two-way ANOVA. b Brightfield images (10x) of Vero cells treated with the indicated concentrations of BSO, 48 h after treatment. c Cell death assays using resazurin viability assay. Absorbance is 570/595 nm. Each point is an independent experiment. Statistics used a one-way ANOVA, ns not significant. d, e Representative images of 63x confocal super-resolution microscopy of Vero cells treated with 2 mM BSO and infected with R. parkeri, at 48 hpi. Coverslips were stained with phalloidin to label actin (red) and with an α-Rickettsia antibody (green). f Representative images of 63x confocal super-resolution microscopy of Vero cells treated with 2 mM BSO and infected with AausFP1-expressing R. parkeri (green), at 48 hpi. Coverslips were stained with α-Rickettsia antibody (red). Data are representative of at least three separate experiments. g Representative immunofluorescence microscopy images of Vero cells untreated or treated with 2 mM BSO and infected with R. parkeri. Coverslips were stained with phalloidin to label actin (red) and with an anti-Rickettsia antibody (green). h Quantification of images from untreated Vero cells (left) or Vero cells treated with 2 mM BSO overnight (right), from images in (g). i Quantification of bacterial length in Vero cells over time, from images in (g). BSO was added overnight at 2 mM. n = 170 for all data sets except +BSO treated at 72 hpi, n = 112. Data were compared with a two-way Student’s T-test. j Quantification of data from (g). Data are the compilation of 6 separate experiments and are expressed as means ± SD. Statistics were performed with a two-way ANOVA, ****p < 0.0001.
Fig. 2
Fig. 2. Host GSH is required for proper actin-based motility and cell-to-cell spread of R. parkeri.
a Representative images of Vero cells infected with R. parkeri at an MOI of 1 and imaged at 48 hpi. Coverslips were stained with phalloidin to label actin (red) and with an α-Rickettsia antibody (green). 2 mM BSO was added prior to infection overnight prior to infection. Scale bar = 10 μm in BSO treated images. Scale bar = 5 μm in untreated images. b Quantification of actin colocalization on R. parkeri. Each time point is an average of at least 4 separate experiments totaling > 400 bacteria. c Representative images of HMEC-1 cells treated with 2 mM BSO overnight and infected with R. parkeri, at 48 hpi. Coverslips were stained with phalloidin to label actin (red) and with an α-Rickettsia antibody (green). Scale bar = 5 μm. Images in (a) were captured with 63x confocal immunofluorescence microscopy. Images in (c) were captured with 100x confocal microscopy. Images represent 3 independent experiments. d Vero cells were infected with R. parkeri at the indicated dilutions. For treatment of Vero cells, 2 mM BSO was added 16 h prior to infection, removed prior to infection, and again added at 30 mpi. For treatment of R. parkeri with BSO, bacteria were incubated on ice with 2 mM BSO for 15 m prior to infection. Image is representative of three independent experiments, as shown on the right, in which the second dilutions are quantified. Data were compared with a two-way Student’s T-test. Data are expressed as means ± SD.
Fig. 3
Fig. 3. Host GSH is critical for R. parkeri survival in macrophages via a non-bacteriolytic restriction mechanism.
R. parkeri abundance WT murine BMDMs or Vero cells infected at an MOI of 1. Data are the compilation of six separate experiments for BMDMs and four separate experiments for Veros and are expressed as means ± SD. Statistics used a two-way ANOVA. b Representative images using 63x confocal microscopy of BMDMs treated with 2 mM BSO overnight, infected with R. parkeri at an MOI of 1 and imaged at 48 hpi. Green = α-Rickettsia antibody; red = phalloidin (actin), blue = DAPI. Scale bars = 10 μm. c Quantification of host cell death during R. parkeri infection of WT BMDMs. LDH release was measured at 24 hpi upon R. parkeri infection at an MOI of 1. Data are the compilation of seven separate experiments and are expressed as means ± SD. Statistics used a two-way Student’s T-test. d Measurement of IFN-I in supernatants of BMDMs infected with R. parkeri at an MOI of 1. Supernatants were harvested at 24 hpi and used to stimulate a luciferase-expressing cell line (ISRE) and relative light units (RLU) were measured and compared between treated and untreated cells. Data are the compilation of five separate experiments and are expressed as means ± SD. Statistics used a one-way ANOVA. e RAW-blue NF-κB reporter cells were infected with R. parkeri at an MOI of 1 for 48 h and supernatants were then incubated with Quantiblue for 2 h prior to measuring absorbance. Absorbance was read at 620 nm. Statistics used a one-way ANOVA. Data are the compilation of four separate experiments and are expressed as means ± SD. **p < 0.01, ***p < 0.001, ****p < 0.0001, ns not significant.
Fig. 4
Fig. 4. Host GSH is required for R. parkeri to avoid ubiquitylation and antibacterial autophagy in macrophages.
a Representative images of ubiquitin colocalization using 20x immunofluorescence microscopy of Vero cells infected with R. parkeri at an MOI of 1 and fixed at 48 hpi. Cells were stained with FK1 α-polyubiquitin (green), α-Rickettsia I7205 (red); and DAPI (blue). Scale bar = 10 μm. b Quantification of ubiquitin colocalization at 48 hpi in Vero cells. Each data point is an independent experiment where at least 3 images were analyzed, and each image contained at least 50 bacteria. Statistics used a two-way Student’s T-test, and data are expressed as means ± SD. R. parkeri abundance in BMDMs infected at an MOI of 1. Cells treated with 2 mM BSO were incubated overnight with BSO. Data are the compilation of six separate experiments and are expressed as means ± SD. Statistics used a two-way Student’s T-test. R. parkeri abundance in BMDMs that were untreated or treated with 3MA and infected at an MOI of 1. Cells treated with 2 mM BSO were incubated overnight and 3MA was used at 5 mM added at 1 hpi. Data are the compilation of six separate experiments and are expressed as means ± SD. Statistical analysis used a two-way Student’s T-test; *p < 0.05, **p < 0.01.
Fig. 5
Fig. 5. GSH serves as a cysteine source for R. parkeri cell division and survival.
a PFUs of R. parkeri in BMDMs upon addition of metabolites. 5 mM GSHee and 5 mM NAC were added when indicated by the black arrows. Data are combined from six separate experiments and are means ± SD. Statistics used a two-way Student’s T-test at 72 hpi. b Representative images and quantification (right) of R. parkeri in Vero cells at 48 hpi in the presence of the indicated metabolites. Coverslips were stained with α-Rickettsia antibody (green). Scale bar = 10 μm. 3 separate experiments were counted, using 3 images per experiment and > 200 bacteria total. c Measurements of ROS using DCFH-DA in the indicated cells. BSO (2 mM) was added overnight prior to measurements and H2O2 (20 μM) was added 4 h prior to measurement. ROS production fold change is compared to untreated. Data combined three separate experiments and are expressed as means ± SD. Statistics used a one-way ANOVA. d PFUs in BMDMs in the presence of 20 μM H2O2 added at times indicated by the black arrows. Data are the compilation of six separate experiments and are expressed as means ± SD. Statistics used a two-way Student’s T-test at 72 hpi. e Representative image and quantification (right) of R. parkeri in Vero cells at 48 hpi in the presence of 20 μM H2O2. Coverslips were stained with an α-Rickettsia antibody (green). Scale bar = 10 μm. 3 separate experiments were counted, using 3 images per experiment and > 200 bacteria total. f Measurements of ROS using DCFH-DA in the indicated cells. BSO (2 mM) was added overnight prior to measurements and H2O2 (20 μM) was added 4 h prior to measurement. ROS production fold change is compared to untreated. Data are the compilation of four separate experiments and are expressed as means ± SD. Statistics used a one-way ANOVA. R. parkeri PFUs in BMDMs in the presence of the indicated inhibitors; L-NIL (1 mM) was added 1 hpi; BSO (2 mM) was added overnight prior to infection. Data are the compilation of six separate experiments and are expressed as means ± SD. Statistics used a two-way ANOVA. *p < 0.05, **p < 0.01, ***p < 0.001, ****p < 0.0001.

Similar articles

References

    1. Biggs, H. M. et al. Diagnosis and management of tickborne rickettsial diseases: rocky mountain spotted fever and other spotted fever group rickettsioses, ehrlichioses, and anaplasmosis-United States. Mortal. Wkly. Rep.65, 1–44 (2016). - PubMed
    1. Dantas-Torres, F. Rocky Mountain spotted fever. Lancet Infect. Dis.7, 724–732 (2007). - PubMed
    1. Openshaw, J. J. et al. Rocky mountain spotted fever in the United States, 2000-2007: interpreting contemporary increases in incidence. Am. J. Trop. Med Hyg.83, 174–182 (2010). - PMC - PubMed
    1. Kirkland, K. B., Wilkinson, W. E. & Sexton, D. J. Therapeutic delay and mortality in cases of Rocky Mountain spotted fever. Clin. Infect. Dis.20, 1118–1121 (1995). - PubMed
    1. Ahyong, V., Berdan, C. A., Burke, T. P., Nomura, D. K. & Welch, M. D. A metabolic dependency for host isoprenoids in the obligate intracellular pathogen Rickettsia parkeri underlies a sensitivity to the statin class of host-targeted therapeutics. mSphere4, e00536-19 (2019). - PMC - PubMed