. 2025 Jul 1;16(1):5600.
doi: 10.1038/s41467-025-60727-z.

Single-cell signaling network profiling during redox stress reveals dynamic redox regulation in immune cells

Affiliations

Single-cell signaling network profiling during redox stress reveals dynamic redox regulation in immune cells

Yi-Chuan Wang et al. Nat Commun. .

Abstract

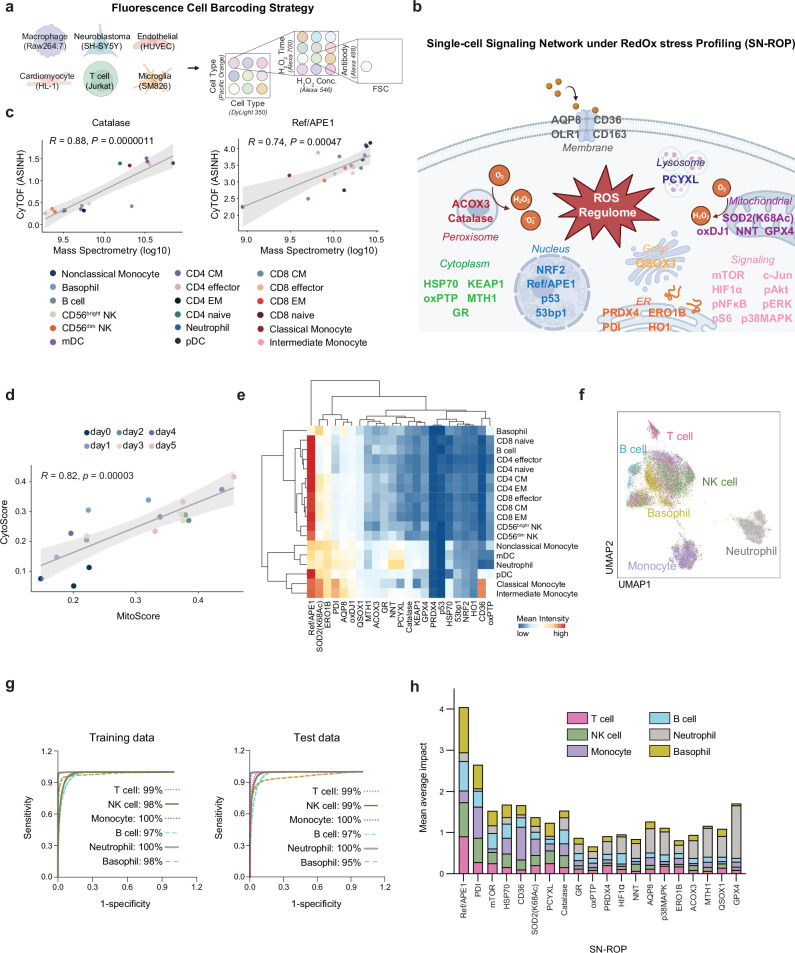
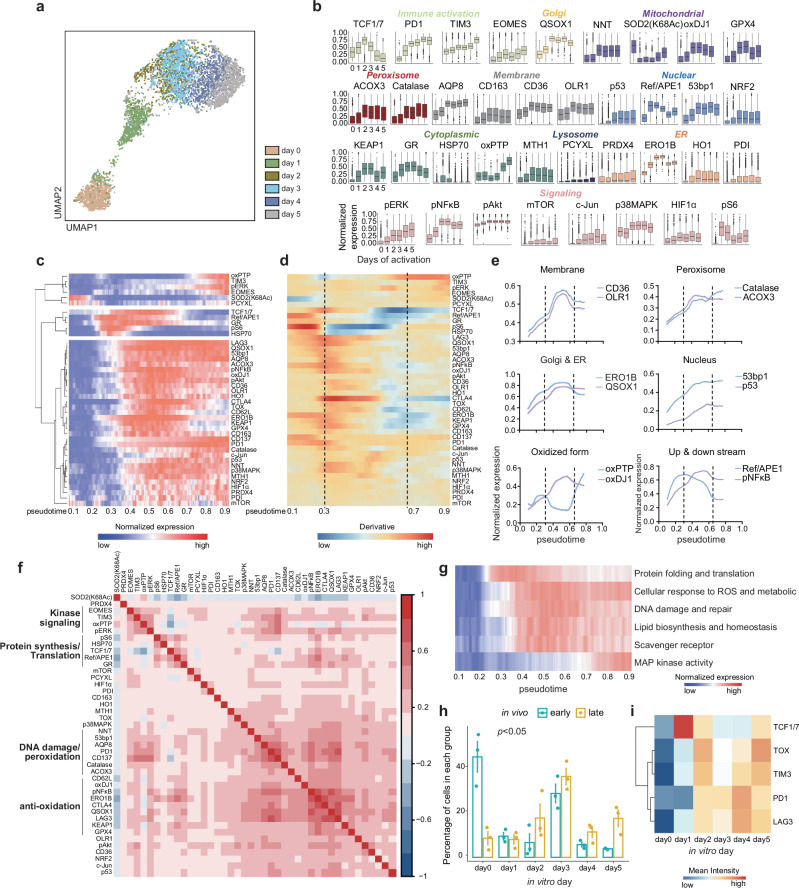
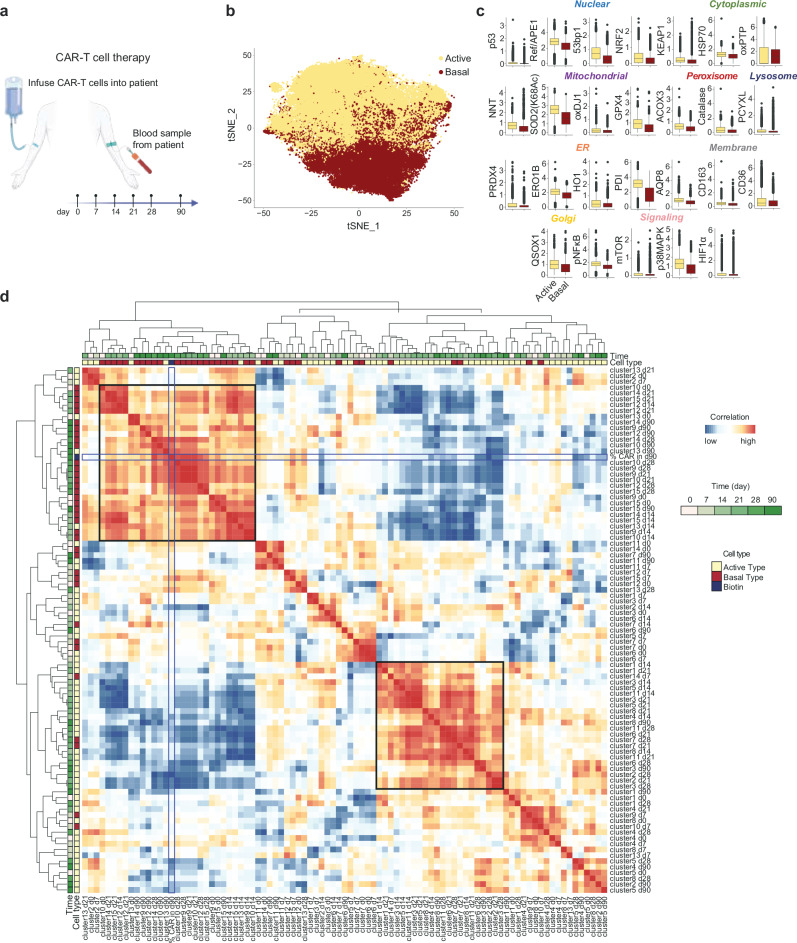
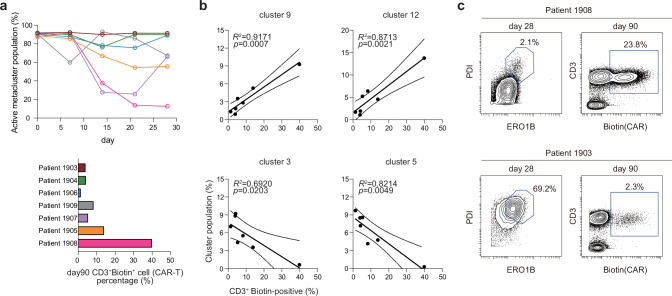
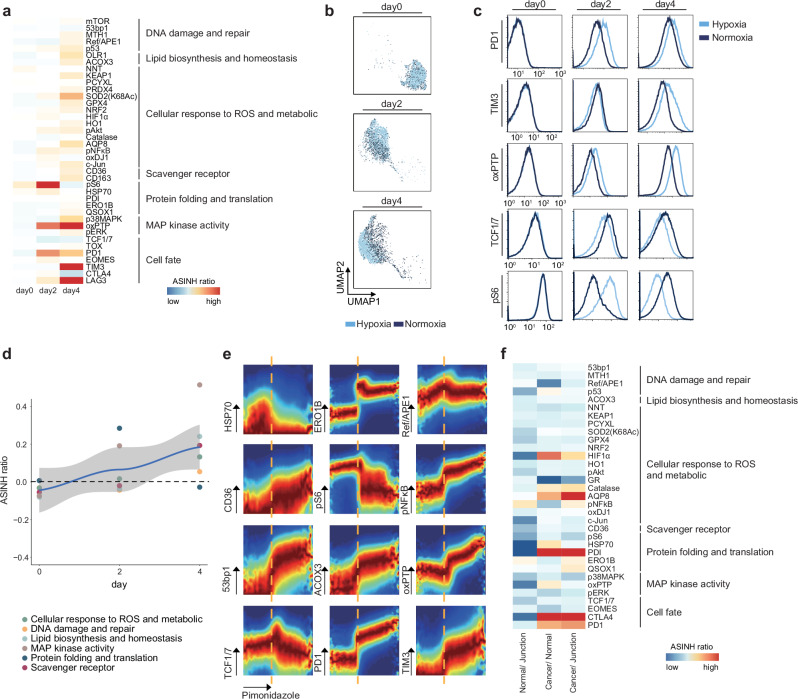
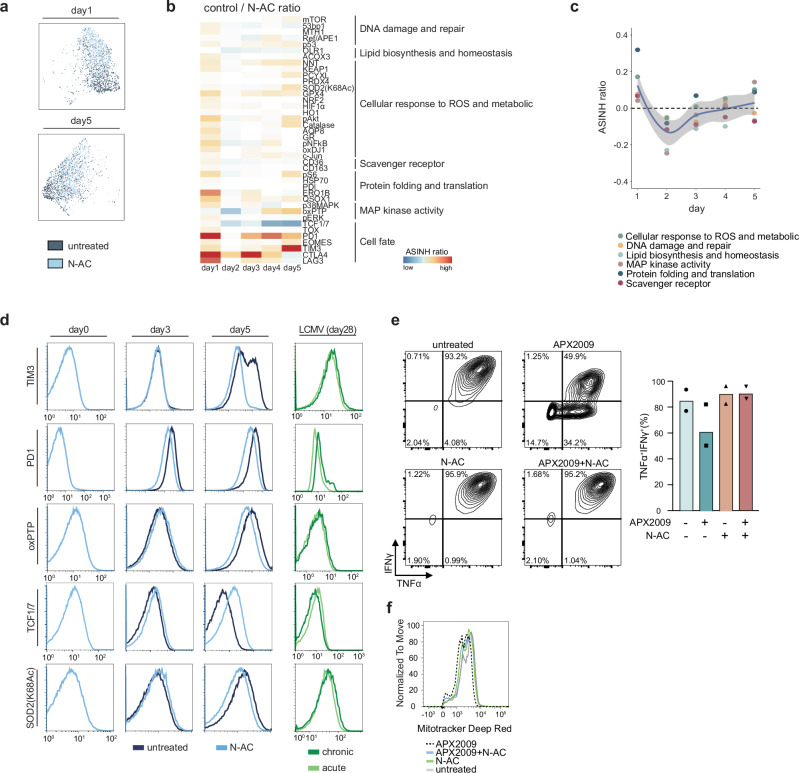
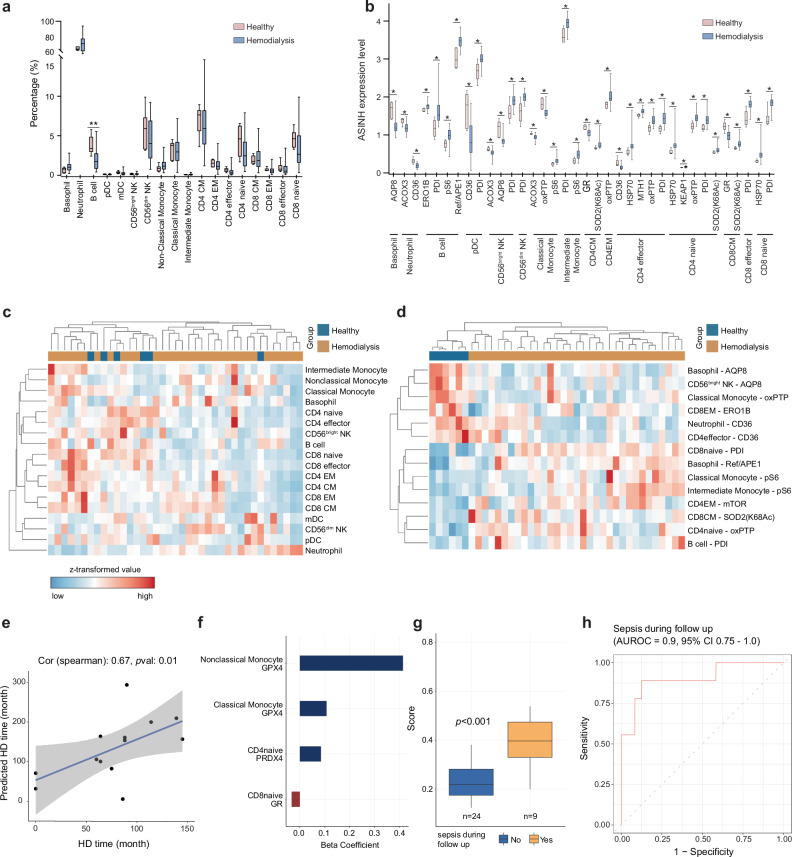
In eukaryotic cells, reactive oxygen species (ROS) serve as crucial signaling components. ROS are potentially toxic, so constant adjustments are needed to maintain cellular health. Here we describe a single-cell, mass cytometry-based method that we call signaling network under redox stress profiling (SN-ROP) to monitor dynamic changes in redox-related pathways during redox stress. SN-ROP quantifies ROS transporters, enzymes, oxidative stress products and associated signaling pathways to provide information on cellular redox regulation. Applied to diverse cell types and conditions, SN-ROP reveals unique redox patterns and dynamics including coordinated shifts in CD8+ T cells upon antigen stimulation as well as variations in CAR-T cell persistence. Furthermore, SN-ROP analysis uncovers environmental factors such as hypoxia and T cell exhaustion for influencing redox balance, and also reveals distinct features in patients on hemodialysis. Our findings thus support the use of SN-ROP to elucidate intricate redox networks and their implications in immune cell function and disease.


Conflict of interest statement

Competing interests: The authors declare no competing interests.

Figures

Fig. 1
Fig. 1. Development and validation of the SN-ROP platform.
a Overview of the fluorescence cell barcoding strategy. Created with BioRender.com and used with permission under an Academia Sinica institutional publication license. b Overview of the targets of 25 ROS-related antibodies and 8 signaling-related antibodies, collectively referred to as the SN-ROP panel. Antibodies were conjugated with heavy metal isotopes for CyTOF analysis. Created with BioRender.com and used with permission under an Academia Sinica institutional publication license. c Pearson correlation analysis comparing marker expression in immune populations from healthy human donors determined using SN-ROP to data from a mass spectrometry-based quantitative proteome dataset. Each circle represents the mean of one of the 18 immune cell subsets, distinguished by colors. CyTOF data (ASINH transformed) were collected from 10 donors, and mass spectrometry data (log10 transformed) were obtained from 4 samples. The solid line indicates the fitted linear regression; the shaded area represents the 95% confidence interval. The Pearson correlation coefficient (R) and exact two-sided P values are indicated. d Pearson correlation analysis comparing CytoScore and MitoScore, which represent the overall redox states of cytoplasmic and mitochondrial compartments, respectively. Circles represent mean population values for each activated CD8+ T cells from OT-1 mice, colored by experimental day. Each data point represents triplicate measurements from CyTOF data, with ASINH-transformed expression data analyzed exclusively by mass cytometry. The solid line indicates the fitted linear regression; the shaded area represents the 95% confidence interval. The Pearson correlation coefficient (R) and exact two-sided P values are indicated. e Heatmap of ASINH transformed mean expression levels of all evaluated SN-ROP markers across various immune cell lineages. f UMAP-based dimensionality reduction of SN-ROP data from 10 healthy donors. Colors indicate lineage identity defined by the surface markers. g Sensitivity versus specificity for training and test data. A subset of donors (n = 8) was used to train supervised machine learning algorithms to classify different immune cell types utilizing ROS markers as features. The trained models were subsequently tested on a separate set of donors (n = 2). h Mean average impacts of SN-ROP components in definition of immune cells, colored by immune cell types.
Fig. 2
Fig. 2. SN-ROP reveals remodeling of ROS signaling networks in CD8+ T cells.
a UMAP projection of SN-ROP from pooled CD8+ T cells from OT-I mice at days 0-5 of OVA stimulation colored to show the distribution of cells across different time points. b Box plots displaying 99th percentile normalized SN-ROP expression profiles for each CD8+ T cell activation time point (n = 3 independent samples). Each box represents the distribution of single-cell expression values. Box plots show the median (center line), interquartile range (IQR; box limits), and whiskers extending to 1.5×IQR; outliers beyond this range are shown as individual points. The plots are colored based on protein function or subcellular localization. No statistical comparisons were performed. c Pseudotime values calculated using the SCORPIUS package plotted in a heatmap along with the 99th percentile normalized data, which was smoothed using a window size of 100 (n = 3 independent samples, data from one representative sample shown). d Slope (first derivative) heatmap of protein expression across pseudotime. The vertical dashed lines indicate significant inflection points (n = 3 independent samples, data from one representative sample shown). e Examples of expression of SN-ROP markers in organelles as a function of pseudotime. Data shown are the 99th percentile normalized values for a representative sample (n = 3) smoothed using a window size of 1000. The vertical dashed lines indicate inflection times. f ASINH transformed data of CD8+ T cells from OT-I mice annotated with GO biological processes. Red represents a positive correlation, and blue represents a negative correlation (n = 3 independent samples, data from one representative sample shown). The features are grouped into four categories based on their functional roles: kinase signaling (EOMES, TIM3, oxPTP, pERK); protein synthesis/translation (HSP70, TCF1/7, REF/APE1, and GR); DNA damage/peroxidation (NNT, 53bp1, AQP8, PD1, CD137, Catalase, and ACOX3); and anti-oxidation (CD62L, oxDJ1, pNFκB, ERO1B, CTLA4, QSOX1, LAG3, KEAP1, and GPX4). g Pseudotime heat map with biological processes of the ROS functions divided into six pathways based on membership in one or more functional GO modules or pathways. h The percentage of CD8+ T cells from MC38 tumors at in vivo day 7 (early, blue) and day 14 (late, gold) distributed across in vitro time points (n = 3 biologically independent MC38 tumor-bearing mice per group). Bars represent the mean, and error bars indicate ± standard error of the mean (SEM). Statistical significance was assessed using a two-sided permutation t-test. i Mean expression levels of five late-stage activation markers in CD8+ T cells from MC38 tumors projected onto the in vitro timeline (n = 3).
Fig. 3
Fig. 3. Early SN-ROP-defined redox patterns distinguish CAR-T cell states across time.
a Diagram of the experimental protocol. Blood was sampled from leukemia patients (n = 7) undergoing CAR-T therapy on days 0, 7, 14, 21, 28, and 90 after CAR-T infusion. CD8+ T cells were subsequently isolated and analyzed using SN-ROP. Created with BioRender.com and used with permission under an Academia Sinica institutional publication license. b tSNE plot of CAR-positive T cells, clustered based on their redox profiles using FlowSOM. c ASINH-transformed expression levels of SN-ROP markers for active (yellow) and basal (red) clusters. Each box represents the distribution of single-cell expression values derived from 7 biologically independent CAR-T cell patient samples. Box plots display the median (center line), interquartile range (IQR; box limits), and whiskers extending to 1.5×IQR. Minima and maxima beyond the whiskers are shown as individual points (outliers). No statistical comparisons were performed. d Correlation heatmap of all clusters across all sample collection time points. Upper square marks the correlated basal type and the lower right square denotes the active type detected at the 90-day time point. Blue squares highlight biotin+ (i.e., CAR-T-positive) cells at 90 days post-infusion.
Fig. 4
Fig. 4. Persistent SN-ROP activation patterns correlate with long-term CAR-T cell persistence.
a Upper: Percentages of active-type T cell clusters as a function of time in individual patients. Lower: Percentages of biotin+ cells at 90 days post-infusion in each patient. b Correlations of the percentages of indicated cell clusters with CAR-T cell persistence at day 90 post-infusion. Each dot represents an individual CAR-T patient. The solid line represents the fitted linear regression. Pearson correlation coefficients (R2) and exact two-sided P values are shown in the plots. Results for additional clusters are provided in Supplementary Fig. 11. c Contour plots of PDI versus ERO1B expression at day 28 post-infusion (left) and CAR-T cells versus all T cells (right) in samples from patients 1908 and 1903 at day 90 post-infusion.
Fig. 5
Fig. 5. SN-ROP analysis of CD8+ T cells under normal and hypoxic conditions reveals correlations between redox patterns and T cell exhaustion.
a ASINH ratio heatmap of SN-ROP marker expression in CD8+ T cells from OT-1 mice cultured in hypoxic versus normoxic conditions. The markers are grouped by six GO pathway terms. Results show the average effect sizes across replicates (n = 3 per condition and time point). b UMAP of individual time points for CD8+ T cells under normoxic and hypoxic conditions. The input features used are from the SN-ROP markers only, and the plots are colored to distinguish different conditions. Plotted is a representative result of 2000 cells from one of the triplicate experiments. c Histograms of exhaustion and SN-ROP markers at days 0, 2, and 4. The histograms are colored to indicate normoxia or hypoxia and are from one of the triplicate experiments. d Loess scatter plot of ASINH ratios in hypoxia over normoxia conditions in a representative sample. Each point represents a different GO term. The black dashed line represents ASINH ratio of 0. The solid line represents a locally weighted regression (LOESS) fit; the shaded area indicates the 95% confidence interval around the fitted curve. e DREVI plot with the density estimate renormalized to visualize the abundance of the SN-ROP markers under hypoxia (as observed by pimonidazole). Each plot depicts the distribution of densities, with dark red indicating higher density within that specific slice. The orange dashed line indicates the coordinated transition hypoxic time point. f Heatmap of ratios of expression patterns of the SN-ROP markers in CD8+ T cells in normal versus junction regions, cancerous regions versus normal regions, and cancerous regions versus junction regions from two hepatocellular carcinoma patients. ASINH ratios are grouped by GO term.
Fig. 6
Fig. 6. SN-ROP analysis of N-AC-treated CD8+ T cells during activation reveal the immediate effects of anti-oxidation treatment in modulating redox pathways.
a UMAP plots of CD8+ T cells from OT-1 mice after 1 and 5 days with and without antioxidant N-AC treatment (n = 2, data for a representative sample shown) generated using SN-ROP data as input. b Heatmap of effect sizes of exhaustion levels in untreated versus N-AC-treated CD8+ T cells (n = 2). Markers are grouped by GO terms. c Loess scatter plot of the ASINH ratio of exhaustion levels in untreated versus N-AC-treated CD8+ T cells (n = 2). Each point represents a different GO term. The black dashed line represents ASINH ratio = 0. The solid line represents a locally weighted regression (LOESS) fit; the shaded area indicates the 95% confidence interval around the fitted curve. d Histogram of average intensities of immune checkpoint inhibitors and SN-ROP markers in CD8+ T cells from OT-1 mice cultured with (dark blue) and without (light blue) N-AC at days 0, 3, and 5 (n = 2, data from representative samples shown) and in T cells isolated at day 28 from acute (light green) and chronic (dark green) LCMV models (n = 3, data from representative samples shown). e Left: Biaxial plots of IFNγ versus TNFα after re-stimulation of T cells from OT-1 mice with PMA and ionomycin without or with APX2009, N-AC, or the combination of APX2009 and N-AC (n = 2, biologically independent mice; data for a representative sample shown). Right: Bar plots showing the percentage of TNFα+IFNγ+ CD8+ T cells from individual samples. No statistical comparisons were performed due to limited sample size (n = 2). f Histogram of MitoTracker Deep Red fluorescence intensity in T cells form OT-1 mice treated with APX2009 (black dashed line), APX2009 and N-AC (blue), N-AC (green), or untreated (gray).
Fig. 7
Fig. 7. SN-ROP identifies redox features that differ in hemodialysis patients and healthy controls.
a Quantification of the proportion of 18 immune cell types in healthy control individuals (n = 6) and hemodialysis patients (n = 33). Box plots show the median (center line), the interquartile range (IQR; box limits), and whiskers extending to 1.5 × IQR. Outliers beyond this range are shown as individual points. Statistical significance was assessed using a one-way ANOVA; *P < 0.05. b ASINH-transformed expression levels of 36 redox-related features across immune subsets in healthy and hemodialysis subjects. Each box represents the distribution of single-cell expression values across samples. Box plots show the median (center line), IQR (box limits), and whiskers extending to 1.5 × IQR; outliers are shown as individual dots. Statistical significance was calculated using two-sided tests with Benjamini–Hochberg correction; *adjusted P < 0.05. c Clustering diagram generated using only immunophenotyping features for healthy control individuals (blue) and hemodialysis patients (brown). d Clustering diagram generated using LASSO focusing on significant ROS features with a false discovery rate (FDR) < 0.2 for healthy control individuals (blue) and hemodialysis patients (brown). e Spearman correlation plot utilizing 18 immune cell types and SN-ROP markers to evaluate the predicted time on hemodialysis (HD) versus the actual time on hemodialysis. Data on two-thirds of the hemodialysis patients (20 patients) were used for training, and data on the remaining one-third (13 patients) constituted the test set. Each dot represents an individual in the test group. The solid line represents the fitted linear regression, and the shaded area indicates the 95% confidence interval. The Spearman correlation coefficient (ρ) and two-sided P value are shown in the plot. f Beta coefficients of the four ROS features significantly associated with coordinate 3 of the multidimensional scaling plot. g Predictive scores derived from elastic net models for hemodialysis patients who developed sepsis (n = 9) or did not (n = 24) during follow-up. Box plots show the median, interquartile range (IQR), and whiskers extending to 1.5 × IQR. Outliers beyond the whiskers are shown as individual points. Statistical significance was assessed using a two-sided Mann–Whitney U test; *P < 0.001. h AUROC assessment of the performance of the predictive score in evaluating the risk of sepsis.

Similar articles

References

    1. Muri, J. & Kopf, M. Redox regulation of immunometabolism. Nat. Rev. Immunol.21, 363–381 (2021). - PubMed
    1. Shadel, G. S. & Horvath, T. L. Mitochondrial ROS signaling in organismal homeostasis. Cell163, 560–569 (2015). - PMC - PubMed
    1. Wang, K. et al. Targeting metabolic–redox circuits for cancer therapy. Trends Biochem. Sci.44, 401–414 (2019). - PubMed
    1. Shields, H. J., Traa, A. & Van Raamsdonk, J. M. Beneficial and detrimental effects of reactive oxygen species on lifespan: a comprehensive review of comparative and experimental studies. Front Cell Dev. Biol.9, 628157 (2021). - PMC - PubMed
    1. Espinosa-Diez, C. et al. Antioxidant responses and cellular adjustments to oxidative stress. Redox Biol.6, 183–197 (2015). - PMC - PubMed

Substances

LinkOut - more resources