. 2025 Jul 1;16(1):5536.
doi: 10.1038/s41467-025-60819-w.

Lysosome-mediated aggregation of galactose-deficient IgA1 with transferrin receptor 1 links to IgA nephropathy

Affiliations

Lysosome-mediated aggregation of galactose-deficient IgA1 with transferrin receptor 1 links to IgA nephropathy

Meijun Si et al. Nat Commun. .

Abstract

The retention of galactose-deficient IgA1 (Gd-IgA1) in the mesangium is central to IgA nephropathy (IgAN), but its intracellular fate remains unclear. Here, we show that transferrin receptor 1 (TfR1) mediates Gd-IgA1 uptake into mesangial cell lysosomes, where it forms non-digestible aggregates, disrupts lysosomal function, and triggers inflammatory responses. In renal biopsies from IgAN patients, IgA1 aggregates co-localize with TfR1 within lysosomes. In male mice, TfR1 overexpression enhanced lysosomal accumulation of Gd-IgA1, whereas TfR1 knockdown reduced it. Mechanistically, acidic pH strengthens TfR1-Gd-IgA1 binding via the galactose-deficient hinge region and residue R276. While we acknowledge that sialylation commonly found in patient-derived IgA1 might influence TfR1 binding and that other receptors, such as ASGPR, were not evaluated, our findings nonetheless reveal a lysosome-centered mechanism in IgAN and highlight receptor-mediated retention of Gd-IgA1 as a potential therapeutic target.


Conflict of interest statement

Competing interests: All the authors declared no competing interests.

Figures

Fig. 1
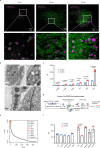
Fig. 1. IgA1 was accumulated in lysosomes of mesangial cells in patients with IgAN.
a High-resolution focused ion beam—scanning electron microscope (FIB-SEM) revealed the lysosomes in mesangial cells of patients with IgAN (left panel), and 3D reconstruction of lysosomes of mesangial cells of patients with IgAN (right panel). b Quantitative analysis of diameter of lysosomes within mesangial cells of patients with IgAN and non-tumor renal tissue from patients with kidney cancer (CTL). Statistical analysis was performed using a two-sided Student’s t-test, IgAN n = 28, CTL n = 15. The lysosome diameter measurements were analyzed from transmission electron microscopy (TEM) images of 28 IgAN patients and 15 non-tumor renal tissue from patients with kidney cancer. Quantitative analysis of the ratio of intensity of lysosomes to glomerular basement membrane (GBM) of patients with IgAN and CTL. Statistical analysis was performed using a two-sided Student’s t-test,IgAN n = 16, CTL n = 7. The grayscale measurements were analyzed from TEM images of 16 IgAN patients and 7 non-tumor renal tissue from patients with kidney cancer. The mean values were calculated from five mesangial cell lysosomes per patient/control sample. In the bar plots, bars represent mean values with standard deviation (SD) error bars, and individual data are shown as dots. c Representative transmission electron microscopy (TEM) and immunoelectron microscopy (immuno-EM) showed the accumulation of IgA1 in lysosomes of mesangial cells in renal tissues of patients with IgAN. A total of 5 patients with IgAN were examined. The experiment was repeated at 5 times independently with a similar result. d Representative immuno-EM showed the accumulation of IgA1 both in lysosomes of mesangial cells and in mesangium. Yellow arrow indicates IgA1-gold positive electron-dense deposits (EDD) within mesangial cell. White arrow denotes the single-layer membrane encapsulating IgA1. Red arrows denote IgA1-gold positive EDD in the extracellular space. A total of 5 patients with IgAN were examined. The experiment was repeated at 5 times independently with a similar result. e Immuno-EM image demonstrated LAMP1-gold positive vesicles, indicating the presence of lysosomes within mesangial cells. f Confocal microscopy images showed the colocalization of IgA1 (green) and LAMP1 (red) in renal tissues of patients with IgAN. DAPI was used for staining nuclei (blue). The experiment was repeated three times independently with a similar result. Source data are provided as a Source Data file.
Fig. 2
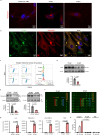
Fig. 2. Galactose-deficient IgA1 (Gd-IgA1) was endocytosed by mesangial cells and subsequently transported to lysosomes, a process in which TfR1 participates.
a Live-cell imaging was captured to track the location of Gd-IgA1 within mesangial cells at various time points after incubation with Gd-IgA1. Rab5a, Rab7a and LAMP1 was labeled with GFP, while Gd-IgA1 was labeled with AF647. The experiment was repeated three times independently with a similar result. b Transmission electron microscopy captures the mesangial cells following incubation with Gd-IgA1. c Flow cytometry was used to measure the median fluorescence intensity (MFI) of AF647 to evaluate the binding of HC-IgA1 and Gd-IgA1 to mesangial cells. Statistical analysis was performed using a two-sided Student’s t-test, n = 6 biological replicates; mean ± SD. d Flowchart of the CRISPR-Cas9 based screening strategy. e A list of candidate genes by sequencing sgRNAs from the population of mesangial cells with the lowest 10% binding affinity to Gd-IgA1. f Using siRNA to knock down the top 4 receptors in the candidate list, then the median fluorescence intensity (MFI) of HC-IgA1/Gd-IgA1 bound to mesangial cells was measured through flow cytometry. Statistical analysis was performed by one-way ANOVA followed by Dunnett’s post hoc test for multiple comparisons. n = 3 biological replicates; mean ± SD. Source data are provided as a Source Data file.
Fig. 3
Fig. 3. TfR1 mediated the binding and endocytosis of Gd-IgA1.
a Mesangial cells were transfected with Vector-GFP or TFRC-GFP, and incubated with Gd-IgA1 labeled with AF647. Live-cell imaging revealed the co-localization of Gd-IgA1 with TfR1 in mesangial cells. The experiment was repeated three times independently with a similar result. b Mesangial cells were stably knocked down or overexpressing for TfR1, the expression of TfR1 was tested using western blotting. Statistical analysis was performed by Student’s t-test, n = 3. c The median fluorescence intensity (MFI) of IgA-AF647 bound to these cells was measured using flow cytometry. Statistical analysis was performed using a two-sided Student’s t-test, n = 3 biological replicates; mean ± SD. d Mesangial cells were transfected with si-TFRC siRNA at concentrations of 0, 25, 50 nM. Dose-dependent decrease in TfR1 expression was validated by western blot. e The si-TFRC siRNA transfected mesangial cells were incubated with Gd-IgA1, and the binding intensity was measured by flow cytometry. Statistical analysis was performed by one-way ANOVA followed by Dunnett’s post hoc test for multiple comparisons, n = 6 biological replicates; mean ± SD. f Mesangial cells were transfected with TFRC-overexpressing plasmid at varying amounts (0, 1 and 1.5 µg). Dose-dependent increase in TfR1 expression was validated by western blot. g The TFRC-overexpressing plasmid transfected mesangial cells were incubated with Gd-IgA1, and the binding intensity was measured by flow cytometry. Statistical analysis was performed by one-way ANOVA followed by Dunnett’s post hoc test for multiple comparisons, n = 6 biological replicates; mean ± SD. h Ferristatin II (50 μM) significantly reduces TfR1 expression in mesangial cells as indicated by western blot. Statistical analysis was performed using a two-sided Student’s t-test, n = 3 biological replicates; mean ± SD. i Ferristatin II significantly reduces Gd-IgA1 binding intensity with mesangial cells. Statistical analysis was performed using a two-sided Student’s t-test, n = 3 biological replicates; mean ± SD. Source data are provided as a Source Data file.
Fig. 4
Fig. 4. Gd-IgA1 was accumulated in the lysosomes of mesangial cells.
a Live-cell imaging of mesangial cells 48 h post-incubation with Gd-IgA1. LAMP1 was labeled with GFP, while HC-IgA1 and Gd-IgA1 was labeled with AF647. b Quantitative analysis of the fluorescence intensity of AF647, indicative of HC-IgA1/Gd-IgA1 in mesangial cells. Statistical analysis was performed by Mann-Whitney test (two-tailed). The number of fluorescent-positive IgA vesicles identified in confocal images was used for analysis: HC-IgA1 n = 173, Gd-IgA1 n = 583. c ELISA detected the concentration of IgA1 in the lysate of mesangial cells at different times after incubation with the HC-IgA1 and Gd-IgA1. Statistical analysis was performed using a two-sided Student’s t-test, n = 3 biological replicates; mean ± SD. d Non-reducing western blots of IgA1 from the lysates of mesangial cells incubated with HC-IgA1 and Gd-IgA1 at 24 h, 48 h, and 72 h post-incubation. The experiment was repeated three times independently with a similar result. eTFRC knockdown mesangial cells were incubated with Gd-IgA1.Live-cell imaging of mesangial cells 48 h post-incubation with Gd-IgA1. LAMP1 was labeled with GFP, while Gd-IgA1 was labeled with AF647. f Quantitative analysis of the fluorescence intensity of AF647, indicative of Gd-IgA1 in mesangial cells. Statistical analysis was performed by Mann-Whitney test (two-tailed). The number of fluorescent-positive IgA vesicles identified in confocal images was used for analysis: si-CTL n= 25, si-TFRC Gd-IgA1 = 1576. g Quantitative analysis of concentration of IgA1 by ELISA in the lysate of mesangial cells after incubation with Gd-IgA1. Statistical analysis was performed using a two-sided Student’s t-test, n = 3 biological replicates; mean ± SD. h Ferristatin II(50 μM) treated mesangial cells were incubated with Gd-IgA1.Live-cell imaging of mesangial cells 48 h post-incubation with Gd-IgA1. LAMP1 was labeled with GFP, while Gd-IgA1 was labeled with AF647. i Quantitative analysis of the fluorescence intensity of AF647, indicative of Gd-IgA1 in mesangial cells. Statistical analysis was performed by Mann-Whitney test (two-tailed). The number of fluorescent-positive IgA vesicles identified in confocal images was used for analysis: CTL group n = 122, Ferristatin II group = 463. j Quantitative analysis of concentration of IgA1 by ELISA in the lysate of mesangial cells after incubation with Gd-IgA1. Statistical analysis was performed using a two-sided Student’s t-test, n = 3 biological replicates; mean ± SD. Source data are provided as a Source Data file.
Fig. 5
Fig. 5. Gd-IgA1 was accumulated in the lysosomes of mesangial cells and induced lysosomal dysfunction and mesangial cell inflammation.
a Confocal microscopy images of human mesangial cells stained with Proteostat dye. Aggregation was absent in cells in control group treated with PBS or HC-IgA1. Globular aggregation was presented in mesangial cells incubated with Gd-IgA1. The experiment was repeated three times independently with a similar result. b Gd-IgA1 was detected by anti-IgA1-AF488 antibody, and the colocalization with Proteostat-positive aggregated proteins with Gd-IgA1 was observed. c Lysosomal function assay was performed in mesangial cells treated with Cytochalasin D, HC-IgA1 and Gd-IgA1. d TFEB was found to be reduced in mesangial cells treated with Gd-IgA1, as shown by western blot analysis. Statistical analysis was performed using a two-sided Student’s t-test, n = 3 biological replicates; mean ± SD. e Western blot analysis revealed that Cathepsin B and Cathepsin D were decreased in mesangial cells treated with Gd-IgA1. Statistical analysis was performed using a two-sided Student’s t-test, n = 3 biological replicates; mean ± SD. f The medium of human mesangial cells stimulated with Gd-IgA1 and HC-IgA1 was tested with human cytokine array. The fluorescence of the chip in different treatments was demonstrated. g The fluorescent intensity of cytokines was quantified. Statistical analysis was performed using a two-sided Student’s t-test, n = 4 biological replicates; mean ± SD. h The medium of human mesangial cells stimulated with Gd-IgA1 and HC-IgA1 was tested with IL-6 ELISA. Statistical analysis was performed using a two-sided Student’s t-test, n = 3 biological replicates; mean ± SD. Source data are provided as a Source Data file.
Fig. 6
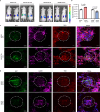
Fig. 6. TfR1 mediated Gd-IgA1 retention in lysosomes in mouse model.
a Real-time in vivo fluorescence imaging of dorsal side demonstrated the deposition of Gd-IgA1 in the kidneys of mice. b Region of interest analysis of Gd-IgA1 deposition in the kidney. Statistical analysis was performed using a two-sided Student’s t-test, n = 4 biological replicates; mean ± SD. AU, arbitrary unit(s). c Representative fluorescent microscope image showed the deposition of Gd-IgA1 in glomeruli of mice treated with AAV9-CTL or AAV9-Tfrc. Co-localization of Gd-IgA1, LAMP1 and TfR1 was examined by confocal microscopy. Scale bar = 20 μm. A total of 4 mice in each group were examined. d Representative fluorescent microscope images of deposition of Gd-IgA1 in glomeruli of mice treated with AAV9-shCTL or AAV9-shTfrc, along with the staining of LAMP1 and TfR1. Scale bar = 20 μm. A total of 4 mice in each group were examined. Source data are provided as a Source Data file.
Fig. 7
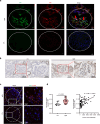
Fig. 7. IgA1 retention was found in lysosomes of mesangial cells in patients with IgAN.
a Confocal images showed the colocalization of IgA (green) and TfR1 (red) in renal tissues of patients with IgAN. DAPI was used for staining nuclei (blue). Scale bar = 20 μm. The experiment was repeated three times independently with a similar result. b Representative immunohistochemical staining showed the expression of TfR1 in renal tissues of patients with IgAN. n = 11 in each group were examined. c RNAscope images showed the co-localization of α-SMA (red) and TfR1 (green) in renal tissues of patients with IgAN. DAPI was used for staining nuclei (blue). d The immunohistochemical staining intensity of TfR1 in glomeruli was quantified, left panel, statistical analysis was performed by Mann-Whitney test (two-tailed), n = 11 in each group. Correlation analysis between 24 h urine protein and TfR1 expression in glomeruli of IgAN patients, right panel, analyzed by Spearman’s correlation test (two-tailed), n = 73, including 41 females and 32 males. For (a) to (d), non-tumor renal tissue from patients with kidney cancer was served as control (CTL). Source data are provided as a Source Data file.
Fig. 8
Fig. 8. Acidic conditions enhance binding of Gd-IgA1 to TfR1 receptor.
a The interaction of full-length Gd-IgA1 with TfR1 measured by surface plasmon resonance analysis under pH value of 5.5. b Size-exclusion chromatography of TfR1 and Gd-IgA1, respectively, showing a single peak eluting at 15 mL, validated by Coomassie blue staining. The experiment was repeated three times independently with a similar result. c Size-exclusion chromatography plot of the Gd-IgA1-TfR1 complex, followed by a dispersed peak corresponding to uncomplexed Gd-IgA1 and TfR1. d Negative staining transmission electron microscopy of the Gd-IgA1-TfR1 complex. The experiment was repeated five times independently with a similar result. Source data are provided as a Source Data file.
Fig. 9
Fig. 9. The galactose-deficient hinge peptide of Gd-IgA1 is crucial for binding with TfR1.
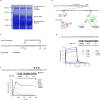
a Coomassie blue gel blotted with the Gd-IgA1-TfR1 complex samples, and yellow frame marks crosslinked bands (132 kDa) from IgA1 heavy chain (55 kDa) and extracellular domain of TfR1 (77 kDa). The experiment was repeated three times independently with a similar result. b Schematic diagram showing crosslinked hinge peptide of IgA1 and fragment of TfR1.Crosslinked binding sites were marked in the structures of IgA1 (PDB ID: 6XJA) and TfR1 (PDB ID: 1CX8). Residue numbering is based on the recombinant IgA1 construct containing an N-terminal FLAG tag (UniProt ID: P01876-1). c The amino acid sequence of the hinge peptides used in the affinity tests. d The interaction of long hinge peptide of IgA1 with TfR1 measured by surface plasmon resonance analysis under the pH value of 5.5. e The interaction of GalNAc-modified long hinge peptide of Gd-IgA1 with TfR1 measured by surface plasmon resonance analysis under the pH value of 5.5. Source data are provided as a Source Data file.

Similar articles

References

    1. Stamellou, E. et al. IgA nephropathy. Nat. Rev. Dis. Prim.9, 67 (2023). - PubMed
    1. Lai, K. N. et al. IgA nephropathy. Nat. Rev. Dis. Prim.2, 16001 (2016). - PubMed
    1. Suzuki, H. & Novak, J. IgA glycosylation and immune complex formation in IgAN. Semin. Immunopathol.43, 669–678 (2021). - PubMed
    1. Si, M. et al. Anomalous kinetics of galactose-deficient IgA incurring nephropathy revealed by cross-scale optical imaging. Kidney Int. 103, 320–330 (2023). - PubMed
    1. Sinniah, R. & Churg, J. Effect of IgA deposits on the glomerular mesangium in Berger’s disease. Ultrastruct. Pathol.4, 9–22 (1983). - PubMed

LinkOut - more resources