. 2025 Jul 1;16(1):5999.
doi: 10.1038/s41467-025-60717-1.

Several groups of LysM-RLKs are involved in symbiotic signal perception and arbuscular mycorrhiza establishment

Affiliations

Several groups of LysM-RLKs are involved in symbiotic signal perception and arbuscular mycorrhiza establishment

Yi Ding et al. Nat Commun. .

Abstract

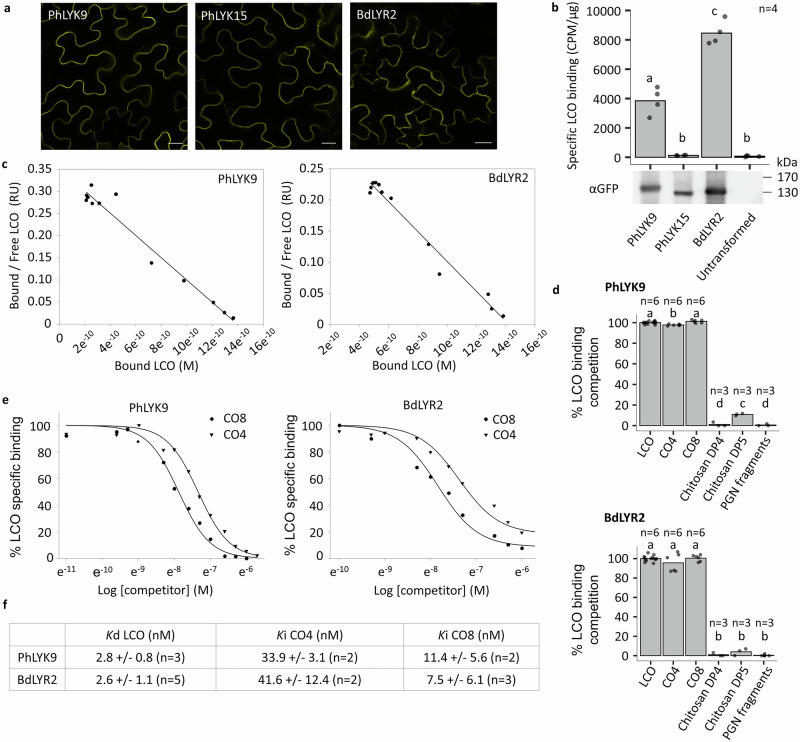
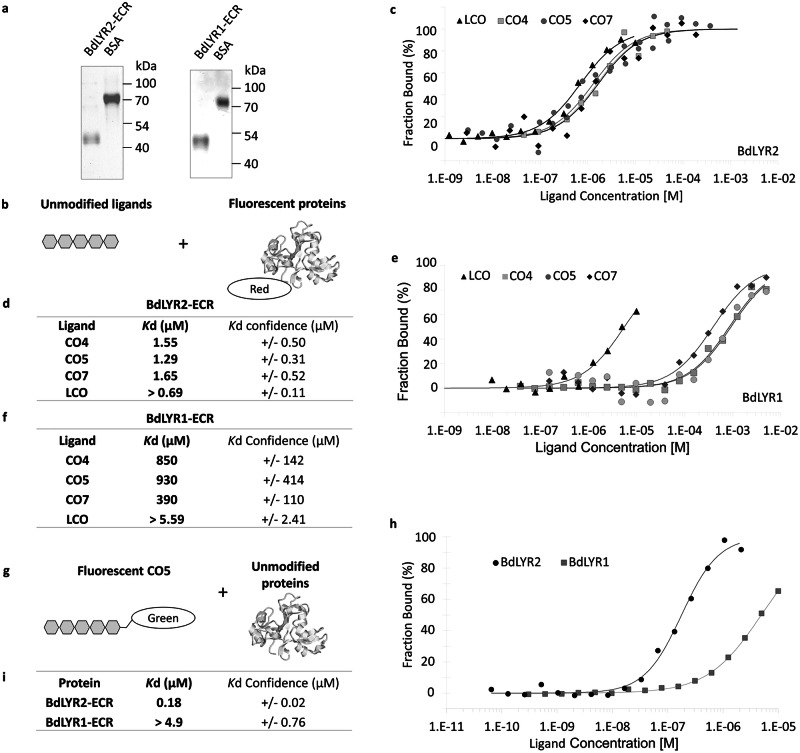
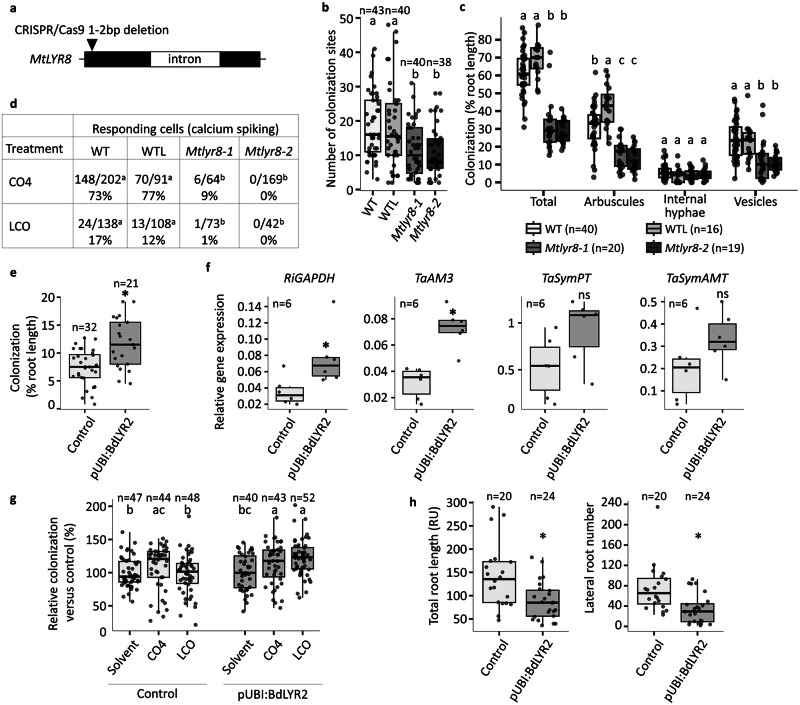
Lipo-chitooligosaccharides (LCO) and short-chain chitooligosaccharides (CO) are produced by arbuscular mycorrhizal fungi (AMF) and activate the plant symbiosis signalling pathway, which is essential for mycorrhiza formation. High-affinity LCO receptors belonging to the LysM receptor-like kinase (LysM-RLK) phylogenetic group LYR-IA play a role in AM establishment, but it is unclear which proteins are the plant high-affinity short-chain CO receptors. Here we studied members of the uncharacterized LYR-IB group, and found that they show high affinity for LCO, short- and long-chain CO, and play a complementary role with the LYR-IA receptors for AM establishment. While LYR-IB knock out mutants had a reduced AMF colonization in several species, constitutive/ectopic expression in wheat increased AMF colonization. LYR-IB function is conserved in all tested angiosperms, but in most japonica rice a deletion creates a frameshift in the gene, explaining differences in AM phenotypes between rice and other monocot single LYR-IA mutants. In conclusion, we identified a class of LysM-RLK receptors in angiosperms with unique biochemical properties and a role in both LCO and CO perception for AM establishment.


Conflict of interest statement

Competing interests: The authors declare no competing interests.

Figures

Fig. 1
Fig. 1. Equilibrium binding with a radiolabelled LCO shows high affinity LCO and CO binding to PhLYK9 and BdLYR2.
a Images of epidermal cells from N. benthamiana leaves expressing the indicated proteins tagged with YFP. Scale bars represent 20 µm. b Specific binding of LCO-V(C18:1,NMe,35S) to PhLYK9 and BdLYR2. Bars represent the mean specific LCO-binding/µg membrane proteins. n = two replicates on two independent batches of membrane fractions containing the indicated proteins or from untransformed leaves. Immunodetection with anti YFP antibodies in 10 µg of the indicated membrane fractions. c Affinity of PhLYK9 and BdLYR2 for LCO-V(C18:1,NMe,S). Scatchard plots of cold saturation experiments using membrane fractions containing the indicated proteins and a range of LCO-V(C18:1,NMe,S) concentrations as competitor. The plots are representative of experiments performed with two independent batches of membrane fractions. d Specificity of PhLYK9 and BdLYR2 LCO-binding sites for LCO versus other GlcNAc-containing molecules. Bars represent the mean percentage of specific LCO-V(C18:1,NMe,35S) binding competition in the presence of 2 μM of the indicated competitors, except for PGN fragments which were used at 10 mg/L. n = technical replicates. LCO is LCO-V(C18:1,NMe,S). e Affinity of PhLYK9 and BdLYR2 for CO4 and CO8. Competitive inhibition of the radiolabelled LCO-V(C18:1,NMe,S) binding to membrane fraction containing the indicated proteins, using a range of concentrations of unlabeled CO4 or CO8 as competitors. f Affinities of PhLYK9 and BdLYR2 LCO-binding sites for the indicated ligands, deduced from saturation and competitive inhibition experiments. Statistical differences (p < 0.05) were calculated using a pairwise two-sided Student’s t-test in b, d.
Fig. 2
Fig. 2. Crosslinking with a functionalized CO5 shows high affinity LCO and short-chain CO binding to PhLYK9 and BdLYR2.
a Schematic representation of the cross-linkable biotinylated CO5 (CO5-biot). The triazine group forms a covalent bound with adjacent proteins and the biotin-labeled protein can be detected by Western-blotting (WB). b CO5-biot binding to 10 µg of N. benthamiana membrane proteins containing PhLYK9-YFP or PhLYK15-YFP. Membrane fractions were incubated with or without 10 nM CO5-biot and WB performed using sequentially anti-GFP antibodies and streptavidin on the same membrane. The arrowhead indicates the position of PhLYK9-YFP, whereas * indicates an N. benthamiana endogenously biotinylated protein. c, d CO5-biot binding to immunopurified PhLYK9, PhLYK15 or BdLYR2. 250 µg of membrane proteins containing the indicated proteins were incubated with or without 1 µM CO5-biot, before protein solubilization and purification using anti-GFP beads. Note that the endogenously biotinylated protein detected in membrane fractions (b) was not detected anymore after protein purification. Affinity of PhLYK9 (e) and BdLYR2 (f) for short-chain CO. Saturation experiments on 10 µg of membrane proteins using a range of concentrations of CO5-biot. Specificity of the PhLYK9 (g) and BdLYR2 (h) CO-binding sites for CO versus LCO. Ten µg of membrane proteins were incubated with or without 10 nM CO5-biot and a range of unlabeled LCO-V(C18:1,NMe,S). i, j CO5-biot binding to membrane proteins containing equivalent amounts of the indicated proteins. Membrane fractions were incubated with or without 10 nM CO5-biot. The blots represent data obtained four times in (e, f) and twice in (g, h).
Fig. 3
Fig. 3. Microscale thermophoresis confirms the absence of selectivity of BdLYR2 between LCO and CO.
a SDS-PAGE and coomassie blue staining of purified BdLYR2-ECR or BdLYR1-ECR and 400 ng or 200 ng of BSA respectively. b Schematic representation molecules used for MST: Unlabeled ligands and ECR labeled with a red fluorophore. c Curves of LCO and CO binding to BdLYR2-ECR. 20 nM of BdLYR2-ECR were incubated with a range of LCO-V(C18:1,NMe,S), CO4, CO5 or CO7. The plots show the fraction bound (mean ΔFnorm values divided by the curve amplitude), from 2 independent experiments. Plots showing the binding amplitudes (ΔFnorm) are in Supplementary Fig. 5. d Affinity of BdLYR2-ECR for LCO and CO, deduced from the binding curves. e Curves of LCO and CO binding to BdLYR1-ECR. 20 nM of BdLYR1-ECR were incubated with a range of LCO-V(C18:1,NMe,S), CO4, CO5 or CO7. Plots with binding amplitudes are shown in Supplementary Fig. 5. f Affinity of BdLYR1-ECR for LCO and CO, deduced from the binding curves. Note that since the curves of LCO binding are not saturated, the Kd might be overestimated. g Schematic representation molecules used for MST: fluorescent CO5-BODIPY and unlabeled ECR. h Curves of BdLYR1-ECR and BdLYR2-ECR binding to CO5. 100 nM of CO5-BODIPY were incubated with a range of BdLYR1-ECR or BdLYR2-ECR. Because CO5-BODIPY fluorescence changed upon binding to ECRs, fluorescence intensity rather than thermophoresis was analysed. The plots show the fraction bound (fluorescence intensity values divided by the curve amplitude), (f). Affinity of BdLYR1-ECR and BdLYR2-ECR for CO5, deduced from the binding curves. Note that since the curves for BdLYR1-ECR in (h) are not saturated, the Kd might be overestimated.
Fig. 4
Fig. 4. PhLYK9 and BdLYR2 are involved in AM establishment.
a Position of the dTPh1 transposon insertion in Phlyk9-1. b Number of AMF colonization sites per root system at 3 wpi in segregating plants bearing homozygous Phlyk9-1 or WT PhLYK9 (control) alleles. n = biologically independent plants examined over two independent experiments. c Detailed analysis of AMF structures at 6 wpi in segregating plants bearing homozygous Phlyk9-1 or WT PhLYK9 alleles. n = biologically independent plants examined over two independent experiments. d Root-length colonization at 4 wpi in segregating plants bearing homozygous Phlyk9-1 and Phlyk10-1, Phlyk9-1 and WT PhLYK10 (Phlyk9-1) or WT PhLYK9 and PhLYK10 (control) alleles after the cross of Phlyk9-1 and Phlyk10-1 lines. n = biologically independent plants examined over three independent experiments. e Positions of the nonsense mutations in Bdlyr1-1 and Bdlyr2-1. f Detailed analysis of AMF structures at 4 wpi in segregating plants bearing homozygous Bdlyr1-1 or WT BdLYR1 (BdLYR1 Seg WT), Bdlyr2-1 or WT BdLYR2 (BdLYR2 Seg WT), or Bdlyr1-1 and Bdlyr2-1 (Bdlyr1-1*Bdlyr2-1). n = biologically independent plants examined over two independent experiments. g Number of AMF colonization sites per root system at 3 wpi in segregating plants bearing homozygous Bdlyr2-1 and Bdlyr1-1 (Bdlyr1-1*Bdlyr2-1) or WT BdLYR2 and BdLYR1 (Seg WT) alleles. n = number of biologically independent plants examined over two independent experiments. The box edges represent the 0.25 and 0.75 quantiles, the center line indicates the median value, and the whiskers show the range from the minimum to the maximum values, excluding the outliers in (b–d, f, g). Statistical differences (p < 0.05) were calculated using a Wilcoxon test in (b, g), a pairwise two-sided Student’s t-test in (c, d) and a Van der Waerden test in (f) (for each structure category).
Fig. 5
Fig. 5. MtLYR8 controls LCO and short-chain CO responses and AMF colonization in M. truncatula and strong expression of BdLYR2 in wheat affects AMF colonization and root architecture.
a Position of the frameshift deletions in Mtlyr8-1 and Mtlyr8-2. Details are shown in Supplementary Fig. 9b. b Number of AMF colonization sites per root system at 3 wpi in Mtlyr8-1, Mtlyr8-2, 2HA (WT) or a 2HA line transformed with an empty vector (WTL) alleles. n = biologically independent plants examined over two independent experiments. c Detailed analysis of AMF structures at 4 wpi in Mtlyr8-1, Mtlyr8-2, WT or WTL. n = biologically independent plants examined over two independent experiments. d Number and proportion of root atrichoblast cell nuclei showing calcium spiking to all fluorescent nuclei analysed following treatment with 10-7 M CO4 or LCO-V (C18:1,NMe,S). Data are the sum from at least 3 independent plants. Only nuclei with two or more spikes in 20 min were considered as responding cells. e Root-length colonization at 32 dpi in wheat plants expressing BdLYR2 under the control of a strong promoter (pUbi:BdLYR2) or containing the empty vector (Control). n = biologically independent plants from two independent transgenic lines for each construct. f Relative expression of the R. irregularis gene RiGAPDH (reflecting the amount of fungus in the roots), the early AM stage marker genes TaAM3 and the ammonium and phosphate transporters specifically expressed in arbuscule-containing cells (SymAMT2 and symPT respectively) in pUbi:BdLYR2 and control plants at 6 wpi. n = 3 pools of roots from two independent transgenic lines for each construct. g Effect of LCO and CO on root-length colonization in wheat plants expressing BdLYR2 under the control of a strong promoter (pUbi:BdLYR2) or containing the empty vector (Control). Plants were treated with 10-7 M CO4 or LCO-V(C18:1,NMe,S). n = biologically independent plants from two independent transgenic lines for each construct examined over two independent experiments (harvested at 5 or 6 wpi). Relative colonization levels to mean colonization in non-treated control plants in each experiment. h Effect of pUbi:BdLYR2 on root architecture. n = biologically independent plants from two independent transgenic lines for each construct. The box edges represent the 0.25 and 0.75 quantiles, the center line indicates the median value, and the whiskers show the range from the minimum to the maximum values, excluding the outliers in b-c and e-h. Statistical differences (p < 0.05) were calculated using a Van der Waerden test in (b, c) (for each structure category), a Chi-square test in (d), a two-sided Student’s t-test in (e, f) a Kruskal Wallis test in (g) and a Wilcoxon test in (h).
Fig. 6
Fig. 6. OsLYK11 is conserved in indica but not in japonica rice.
a Partial sequence alignment of OsLYK11 from the indica rice cultivar Xihui18 and the japonica rice cultivars Nipponbare and Kitaake, showing the natural 1 bp deletion in the japonica cultivars. b Image of epidermal cells from a N. benthamiana leaf expressing Xihui18 OsLYK11-YFP (OsLYK11). Scale bar represents 20 µm. c Affinity of OsLYK11 for LCO-V(C18:1,NMe,S). Scatchard plot of a cold saturation experiment using membrane fractions containing OsLYK11 and a range of LCO-V(C18:1,NMe,S) concentrations as competitor. The plot is representative of experiments performed with two independent batches of membrane fractions. d Affinity of OsLYK11 for short-chain CO. Saturation experiments on 10 µg of membrane proteins containing OsLYK11 using a range of concentrations of CO5-biot. WB performed using sequentially anti-GFP antibodies and streptavidin on the same membrane. The arrowhead indicates the position of OsLYK11-YFP, whereas * indicates an N. benthamiana endogenously biotinylated protein. e CO5-biot binding to 10 µg of N. benthamiana membrane proteins containing OsLYK11 or OSNFR5/OsMYR1. f Position of the frameshift insertion in Xihui18 Oslyk11-1. Details are shown in Supplementary Fig. 13b. g Detailed analysis of AMF structures at 5 wpi in Oslyk11-1 or WT Xihui18 plants. n = biologically independent plants examined over two independent experiments. h Detailed analysis of AMF structures at 5 wpi in Nipponbare or Kitaake plants WT, containing the empty vector (WTL) or containing Xihui18 OsLYK11. n = biologically independent plants from two independent transgenic lines and one WT line from one experiment. A second replicate is shown in Supplementary Fig. 13c. The box edges represent the 0.25 and 0.75 quantiles, the center line indicates the median value, and the whiskers show the range from the minimum to the maximum values, excluding the outliers in (g, h). Statistical differences (p < 0.05) were calculated using a Van der Waerden test in (g, h) (for each structure category).

References

    1. Rich, M. K., Nouri, E., Courty, P. E. & Reinhardt, D. Diet of arbuscular mycorrhizal fungi: bread and butter?. Trends Plant Sci.22, 652–660 (2017). - PubMed
    1. Delaux, P. et al. Comparative phylogenomics uncovers the impact of symbiotic associations on host genome evolution. Plos Genet.10, e1004487 (2014). - PMC - PubMed
    1. Maillet, F. et al. Fungal lipochitooligosaccharide symbiotic signals in arbuscular mycorrhiza. Nature469, 58–63 (2011). - PubMed
    1. Genre, A. et al. Short-chain chitin oligomers from arbuscular mycorrhizal fungi trigger nuclear Ca2+ spiking in Medicago truncatula roots and their production is enhanced by strigolactone. N. Phytol.198, 179–189 (2013). - PubMed
    1. Feng, F. et al. A combination of chitooligosaccharide and lipochitooligosaccharide recognition promotes arbuscular mycorrhizal associations in Medicago truncatula. Nat. Commun.10, 5047 (2019). - PMC - PubMed

LinkOut - more resources