. 2025 Jul 1;16(1):5481.
doi: 10.1038/s41467-025-60653-0.

Single-cell analysis reveals a longitudinal trajectory of meningioma evolution and heterogeneity

Affiliations

Single-cell analysis reveals a longitudinal trajectory of meningioma evolution and heterogeneity

Ji Yoon Lee et al. Nat Commun. .

Abstract

Meningioma is the most prevalent primary brain tumor with extensive intra-tumoral heterogeneity and high recurrence rates, particularly in high-grade meningiomas. Despite advancements in understanding the molecular underpinnings of meningiomas, the longitudinal evolutionary trajectory and cellular diversity of recurrent tumors remain elusive. In this study, we perform single-nuclei sequencing of matched primary and recurrent meningiomas to explore the dynamic transcriptional heterogeneity and evolutionary trajectory of meningioma tumor cells, as well as their molecular interactions with tumor-associated immune cells that shape the complex milieu of the meningioma microenvironment. Our findings reveal that both primary and recurrent meningiomas constitute diverse cellular compositions and hierarchies, where recurrent tumor cells are characterized by enrichments of cell cycle activities and proliferative kinetics. Integrative RNA velocity and latent time uncover divergent transcriptional trajectories in recurrent tumors, demonstrating multidirectional transitions with the dominance of COL6A3, which confers higher risk vulnerability and treatment resistance. Tumor microenvironment analysis further reveals enrichments of COL6A3-mediated interactions between immunosuppressive macrophages and tumor cells in recurrent meningiomas. Collectively, these results provide profound insights into the complex evolutionary process of meningiomas and suggest potential therapeutic strategies for the treatment of recurrent tumors.


Conflict of interest statement

Competing interests: The authors declare no competing interests. Ethics approval and consent to participate: The research conformed to the principles of the Declaration of Helsinki.

Figures

Fig. 1
Fig. 1. A single-cell atlas of longitudinal meningioma.
a Workflow for sample collection, sequencing and analysis of 14 meningioma. Created in BioRender. Lab, S. (2025) https://BioRender.com/pzifbd8b tSNE visualization of all 74,979 cells from 14 meningioma samples with cells colored according to the corresponding cell types. c Heatmap for expression of marker genes in all cell types of meningioma (left) and tSNE visualization of each marker genes (right). d tSNE visualization from 14 meningioma with cells colored according to the group, grade, patient, and sample. e CNV plot that classifies tumor cells using immune cells as a reference through inferCNV (MEN01-R sample). f Cell type proportion of meningioma samples on a per-sample basis. Source data are provided as a Source Data file.
Fig. 2
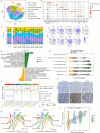
Fig. 2. Transcriptional heterogeneity and trajectory of primary and recurrent meningioma tumor cells.
a tSNE visualization of all 37,460 tumor cells from 14 meningioma samples colored according to the primary or recurrence status. b Differential gene expression analysis between primary and recurrent tumor cells (19,112 primary tumor cells and 18,348 recurrent tumor cells from 14 meningioma samples). p-values are from the two-sided Wald test. Source data are provided as a Source Data file. c Pathway enrichment analysis based on differentially expressed genes in primary and recurrent tumor cells (19,112 primary tumor cells and 18,348 recurrent tumor cells from 14 meningioma samples). p-values are from two-sided Fisher’s exact test. d Copy number alteration analysis of primary and recurrent tumor cells from the inferCNV results (19,112 primary tumor cells and 18,348 recurrent tumor cells from 14 meningioma samples). e RNA velocity, latent time and RNA phase portraits (unspliced versus spliced) colored by cluster in primary tumor cells (n = 19,112) (top) and recurrent tumor cells (n = 18,348) (bottom). f Cell type proportion of tumor cells based on molecular subtypes between primary (n = 19,112) and recurrent (n = 18,348) tumor cells. Detailed cell counts are available in the Source Data file. g Cell type proportion of cell cycle states based on molecular subtypes between primary (n = 19,112) and recurrent (n = 18,348) tumor cells. Source data are provided as a Source Data file. h Pathway enrichment score across four molecular subtypes in tumor cells (19,112 primary tumor cells and 18,348 recurrent tumor cells from 14 meningioma samples). The colors represent the statistical significance (p-value), and the size of the node represents the number of genes in the corresponding pathways. i, j Two-dimensional representation of cellular subgroup of tumor cells (n = 37,460). Yellow dots represent primary tumor cells (n = 19,112), and green dots represent recurrent tumor cells (n = 18,348). Each quadrant corresponds to one of the molecular subtypes. The position of tumor cells (dots) reflects their relative meta-modules scores, which were derived from ssGSEA analysis of the four molecular subtypes and their colors reflect the latent time. Pie chart show proportion of latent time group (early, intermediate, and late) in each subgroup. Source data are provided as a Source Data file.
Fig. 3
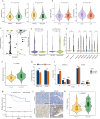
Fig. 3. Risk signature analysis of primary and recurrent tumor cells identified COL6A3 as a driver of risk vulnerability.
a Risk score (“high-risk” and “low-risk”) comparison between primary and recurrent meningioma tumor cells (n = 37,460). Box plots show the median, interquartile range, and 1.5 × IQR whiskers; outliers are shown as individual points. Statistical significance was assessed using the two-sided Wilcoxon rank-sum test. Source data are provided as a Source Data file. b Comparison of higher risk score (left) and lower risk score (right) in primary tumor cells categorized by early and late latent time groups (n = 5,733). Box plots show the median, interquartile range, and 1.5 × IQR whiskers; outliers are shown as individual points. Statistical significance was assessed using the two-sided Wilcoxon rank-sum test. Source data are provided as a Source Data file. c Top genes associated with latent time identified through the elastic-net regression model. The x-axis indicates the correlation between gene expression and latent time across individual cells, and the y-axis shows the frequency of selection across 100 bootstrap iterations of the elastic-net model. p-values were calculated by Spearman correlation tests. Source data are provided as a Source Data file. d Expression level of COL6A3 gene according to risk score groups. Each group of tumor cells were selected based on “high-risk” (top) or “low-risk” (bottom) signatures and termed “top 25% tumors” and “bottom 25% tumors” based on their risk signature activities. e Log2 normalized gene expression level of COL6A3 between primary and recurrent tumor cells based on molecular subtype (two-sided Wilcoxon rank-sum test). Asterisks indicate statistical significance: p < 0.0001 (****). f Violin plot showing the comparison of COL6A3 expression levels between primary and recurrent samples in the validation cohort (n = 112 samples). Box plots show the median, interquartile range, and 1.5× IQR whiskers; outliers are shown as individual points. Statistical significance was assessed using the two-sided Wilcoxon rank-sum test. g RFS (Relapse-Free Survival) according to COL6A3 expression level in the validation cohort (n = 110). The “high” group represents patients with COL6A3 expression that’s higher than the threshold determined by the maxstat algorithm, and the “low” group depicts patients with COL6A3 expression lower than the threshold. Source data are provided as a Source Data file. h Bar plot comparing cell proliferation between siRNA-COL6A3 and control in IOMM-Lee and SF3061 meningioma cell lines. Each bar represents the mean of n = 4 biological replicates, and the error bars indicate the standard deviation (SD). Source data are provided as a Source Data file. i Bar plot comparing the cell cycle proportion between siRNA-COL6A3 and control in IOMM-Lee and SF3061 cell lines. Each bar represents the mean of n = 6 biological replicates, and the error bars indicate the standard deviation (SD). Source data are provided as a Source Data file. j IHC staining images of COL6A3 in matched primary (MEN08, MEN09) and recurrent (MEN08, MEN09) meningiomas. Scale bar, 300 μm. k Violin plot showing the paired comparison of COL6A3 protein expression levels between matched primary and recurrent samples through IHC staining. Box plots show the median, interquartile range, and 1.5 × IQR whiskers; outliers are shown as individual points. Statistical significance was assessed using the two-sided Wilcoxon rank-sum test. A total of 18 primary and 18 recurrent samples were analyzed, including 12 matched pairs. Source data are provided as a Source Data file.
Fig. 4
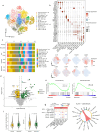
Fig. 4. TME analysis reveals cell-cell interaction between tumor cells and myeloid cells in longitudinal meningioma.
a tSNE visualization of 21,800 cells from macrophages and monocytes colored according to corresponding cell types. Detailed cell counts are available in the Source Data file. b Heatmap for expression of representative marker genes in myeloid cell types of meningioma (n = 21,800 cells)(top) and tSNE visualization of each marker genes (bottom). c Cell type proportion of myeloid cell (n = 21,800) by per-sample basis. Detailed cell counts are available in the Source Data file. d The pathway enrichment analysis between primary (n = 10,776) and recurrent (n = 11,024) myeloid cells. p-values are from two-sided Fisher’s exact test. e Beeswarm plot showing the distribution of log2 fold change in abundance between conditions in neighborhoods from different cell type clusters (n = 21,341 cells). Each dot represents a neighborhood, a group of cells clustered based on shared gene expression profiles. f Comparison of integral signal with input and output signals between myeloid (n = 21,800) and tumor cells (n = 37,460). Statistical significance was assessed by permutation in CellChat. g Circle plots showing the interactions and strengths among different cell types in primary (left) (n = 10,776) and recurrent (n = 11,024) myeloid cells (right). h IHC staining images of COL6A3, C1QA, and CD163 in matched primary (MEN10) and recurrent (MEN10) meningiomas. Representative images are shown; IHC performed on 36 tumor samples (18 primary meningioma and 18 recurrent meningioma samples). Scale bar, 300 μm. i Scatter plot showing correlation between COL6A3 and C1QA expression scores in primary (n = 18) and recurrent (n = 18) meningiomas. p-values were calculated by Spearman correlation tests. Source data are provided as a Source Data file.
Fig. 5
Fig. 5. Distinctive characteristics of T cells and NK cells between primary and recurrent meningiomas.
a tSNE visualization of 10,491cells from T cells and NK cells colored according to corresponding cell types. Detailed cell counts are available in the Source Data file. b Dot plot for expression of marker genes in T cell and NK cell types of meningioma (n = 10,491cells) (top) and tSNE visualization of each marker gene (bottom). c Cell type proportion of T cell (n = 9395) and NK cell (n = 1096) by patient and grade. Detailed cell counts are available in the Source Data file. d Differential gene expression comparing cells from NK/T cells between primary and recurrent meningiomas (3434 primary cells and 7057 recurrent cells). P-values are from the two-sided Wald test. Source data are provided as a Source Data file. e The pathway enrichment score of NK/T cells from primary (n = 3434) and recurrent (n = 7057) tumors. p-values are from two-sided Fisher’s exact test. f Violin plots of ssGSEA-based pathway scores across NK/T cells (n = 10,491). Box plots show the median, interquartile range, and 1.5 × IQR whiskers; outliers are shown as individual points. Statistical significance was assessed using the two-sided Wilcoxon rank-sum test. Source data are provided as a Source Data file. g Comparison of Integral signal with input and output signals between NK/T cells (n = 10,491) and recurrent MG1 tumor cells (n = 3176) (left) and chord diagram showing the network of HLA signaling pathways mediated only by HLA-E – CD94:NKG2A in different cell types(right). Dot color reflects communication probabilities, and dot size represents computed p-values. Statistical significance was assessed by permutation test implemented in CellChat.

References

    1. Ostrom, Q. T. et al. CBTRUS Statistical Report: Primary brain and other central nervous system tumors diagnosed in the United States in 2013-2017. Neuro Oncol.22, iv1–iv96 (2020). - PMC - PubMed
    1. Zhao, L. et al. An overview of management in meningiomas. Front. Oncol.10, 1523 (2020). - PMC - PubMed
    1. Choudhury, A. et al. Hypermitotic meningiomas harbor DNA methylation subgroups with distinct biological and clinical features. Neuro Oncol.25, 520–530 (2023). - PMC - PubMed
    1. Choudhury, A. et al. Meningioma DNA methylation groups identify biological drivers and therapeutic vulnerabilities. Nat. Genet.54, 649–659 (2022). - PMC - PubMed
    1. Olar, A. et al. Global epigenetic profiling identifies methylation subgroups associated with recurrence-free survival in meningioma. Acta Neuropathol.133, 431–444 (2017). - PMC - PubMed

LinkOut - more resources