. 2025 Jul 1;16(1):5728.
doi: 10.1038/s41467-025-60750-0.

HDL-bound S1P affects the subventricular niche and early neuropathological features of Alzheimer's disease

Affiliations

HDL-bound S1P affects the subventricular niche and early neuropathological features of Alzheimer's disease

Byung Jo Choi et al. Nat Commun. .

Abstract

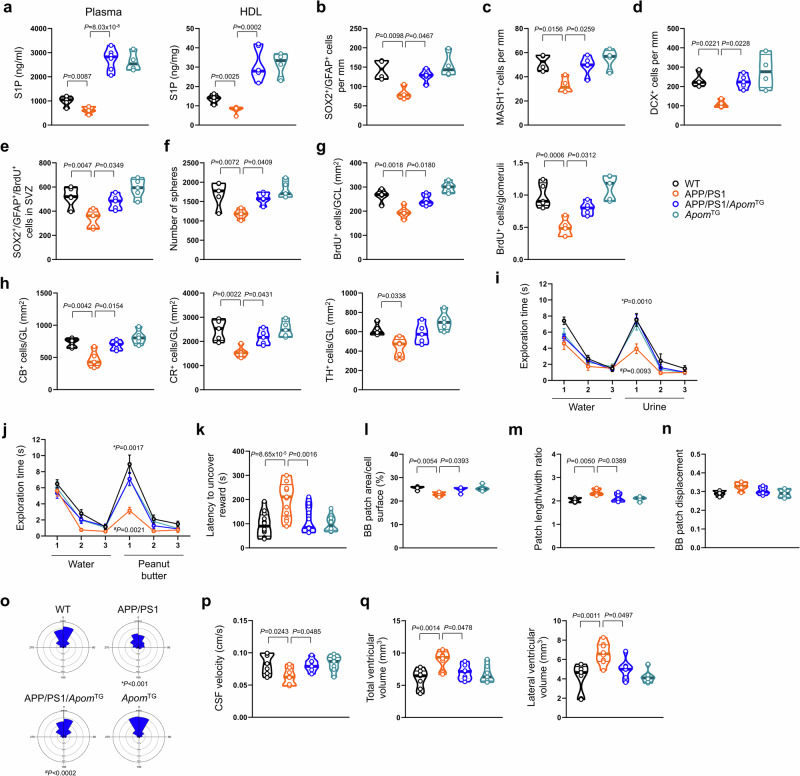
Circulating blood factors are critical for homeostasis of the adult ventricular-subventricular (V-SVZ) and subgranular zones, which contain neural stem cells (NSCs) crucial for sustained neurogenesis. Circulating sphingosine-1-phosphate (S1P) bound to apolipoprotein M (ApoM), a principal component of high-density lipoproteins, is involved in various biological processes, but its role in neurogenic niches is poorly understood. Herein, using Apom-/- mice, we show that blood ApoM-S1P deficiency impairs the SVZ-NSC pool, neurogenesis, ependymal cell polarity, and cerebrospinal fluid flow, leading to olfactory dysfunction and ventricular enlargement, early neuropathological features of Alzheimer's disease (AD). Enhancing the complex significantly rescues these defects by activating S1P1 receptor signaling in SVZ-NSCs. Consistently, blood ApoM-S1P levels are reduced in early AD patients and correlate with olfactory deficits and ventricular enlargement. Similar abnormalities are recapitulated in young APP/PS1 mice and reversed by restoring blood ApoM-S1P levels. Thus, these data reveal pathogenic mechanisms underlying early neuropathological features of AD and identify the blood ApoM-S1P complex as a potential diagnostic and therapeutic target.


Conflict of interest statement

Competing interests: The authors declare no competing interests.

Figures

Fig. 1
Fig. 1. Depletion of blood ApoM-S1P complex causes abnormality of the NSC pool in the SVZ.
a S1P concentration (n  =  5/group). b–d Representative immunofluorescence images and quantification of SOX2+GFAP+ cells (b), MASH1+ cells (c), and DCX+ cells (d) in the SVZ (n  =  6/group). Scale bars, 30 μm (enlarged, 15 μm) e Representative immunofluorescence images of SOX2+GFAP+BrdU+ cells (left) and quantification of SOX2+GFAP+BrdU+ cells and GFAP+BrdU+Ki67+ cells (right) in the SVZ (n  =  5/group). Scale bars, 10 μm. f Representative images (left), number (middle), and diameter (right) of primary neurospheres (n  =  7/group). Scale bars, 300 μm. g Representative immunofluorescence images and quantification of cleaved caspase-3+ and TUNEL+ cells in the SVZ (n  =  5/group). Scale bars, 50 μm. h mRNA levels of pro- and anti-apoptotic genes in the SVZ (WT, n = 6; Apom-/-, n = 5). a–f Two-tailed student’s t test. All error bars indicate s.e.m. All data analysis was done at 4-month-old mice. Source data are provided as a Source Data file.
Fig. 2
Fig. 2. Depletion of blood ApoM-S1P complex impairs SVZ neurogenesis and olfaction.
a Representative immunofluorescence images (left) and quantification of BrdU+ newly formed neurons in the GCL (right upper) and GL (right lower) in the OB (n  =  6/group). Scale bars, 30 μm. b Representative immunofluorescence images and quantification of CB+ cells, CR+ cells, TH+ cells in GL (n  =  6/group). Scale bars, 30 μm. c, d The results of olfactory habituation–dishabituation test for both urine (c) and peanut butter (d) scents (WT, n = 16; Apom-/-, n = 19). e The results of olfactory avoidance test (WT, n = 18; Apom-/-, n = 19). f–i The results of the olfactory discrimination test 1 (f), test 2 (g), test 3 (h), and calculated a discrimination index of the data points shown in f (i) (n  =  18/group). j The latency to locate a buried food reward (WT, n = 14; Apom-/-, n = 13). a, b, i, j Two-tailed student’s t test. c–h Two-way ANOVA for repeated measures. All error bars indicate s.e.m. All data analysis was done at 4-month-old mice. Source data are provided as a Source Data file.
Fig. 3
Fig. 3. Depletion of blood ApoM-S1P complex induces loss of polarity in ependymal cells, leading to LV enlargement.
a Representative immunofluorescence images and quantification of cilium bundles in LV (n = 5/group). Scale bars, 15 μm. b Representative scanning electron microscopy images and angular distribution of vectors representing the orientation of ciliary tufts (WT, n = 104; Apom-/-, n = 100; five animals/group). Scale bars, 30 μm. c Representative confocal images of wholemount staining of β-catenin (β-cat; green) and γ-tubulin (γ-tub; red) in the walls of LVs (upper) and traces of the apical surfaces and BB patches (lower). Scale bars, 10 μm. d Quantification of BB patch area in the walls of LVs (n = 5/group). e Distribution of the percentage of cells with different length/width ratios of the BB patches (WT, n = 442; Apom-/-, n = 414; five animals/group). f Quantification of BB patch displacement (WT, n = 441; Apom-/-, n = 413). g Histogram of the distribution (left) and angular distribution (right) of BB patch angles in ependymal cells (WT, n = 441; Apom-/-, n = 413; five animals/group). h Representative MRI images and quantification of CSF flow in the cerebral aqueduct (n  =  7/group). Scale bars, 2 mm. i Representative images overlaid with microbead movement paths captured through motion tracking (lines) and quantification of velocity of microbeads propelled by cilia at the surface (n = 5/group). Scale bar: 30 μm. j Quantification of LV areas (n  =  5/group). k Quantification of LV volume (n  =  6/group). l Representative MRI images of the rostral and caudal brain. Scale bars, 3 mm. m–o Quantification of total ventricle volume (m), LV volume (n), and 3rd venticular volume (o) from the 2-month-old (WT, n = 4; Apom-/-, n = 6), 4-month-old (WT, n = 6; Apom-/-, n = 8), and 8-month-old (WT, n = 6; Apom-/-, n = 6) mice. a, d, f, h–k, m–o Two-tailed student’s t test. b, g Two-sided Watson U2 test. e Contingency table test. All data analysis was done at 4-month-old mice, with the exception of l-o. Source data are provided as a Source Data file.
Fig. 4
Fig. 4. S1PR1 in the SVZ-NSCs is essential for maintaining neurogenesis and ependymal planar polarity.
a Immunofluorescence images for S1PR1 (green), GFAP (cyan), SOX2 (red) and DAPI (blue) in the SVZ of control and S1pr1ΔNestin mice (left) with mRNA (middle; n  =  5/group) and protein levels (right; n  =  4/group) of S1PR1 in NSCs from control and S1pr1ΔNestin mice. Scale bars, 10 μm (enlarged, 5 μm). b–d Representative immunofluorescence images and quantification of SOX2+GFAP+ cells (b), MASH1+ cells (c), and DCX+ cells (d) in the SVZ (n  =  5/group). Scale bars, 30 μm (enlarged, 15 μm). e Representative immunofluorescence images of SOX2+GFAP+BrdU+ cells (left) and quantification of SOX2+GFAP+BrdU+ cells and GFAP+BrdU+Ki67+ cells (right) in the SVZ (n  =  5/group). Scale bars, 10 μm. f Representative images (left), number (middle), and diameter (right) of primary neurospheres (n  =  5/group). Scale bars, 300 μm. g Representative immunofluorescence images and quantification of BrdU+ newly formed neurons in the GCL and GL in the OB (n  =  5/group). Scale bars, 30 μm. h Quantification of CB+ cells, CR+ cells, TH+ cells in GL (n  =  5/group). i, j The results of olfactory habituation–dishabituation test for both urine (i) and peanut butter (j) scents (Control, n = 9; S1pr1Nestin, n = 10). k The latency to locate a buried food reward (Control, n = 9; S1pr1Nestin, n = 10). l Quantification of BB patch area in the walls of LV (n = 5/group). m Quantification of length/width ratios of the BB patches (n = 5/group). n Quantification of BB patch displacement (n = 5/group). o Angular distribution of BB patch angles in ependymal cells (Control, n = 296; S1pr1Nestin, n = 291; five animals/group). p Quantification of CSF flow in the cerebral aqueduct (Control, n = 7; S1pr1Nestin, n = 8). q Quantification of velocity of microbeads propelled by cilia at the surface (n = 4/group). r Quantification of total ventricle (left) and LV (right) volume (Control, n = 7; S1pr1Nestin, n = 8). a–h, k–n, p-r Two-tailed student’s t test. i, j Two-way ANOVA for repeated measures. o Two-sided Watson U2 test. All error bars indicate s.e.m. All data analysis was done at 4-month-old mice. Source data are provided as a Source Data file.
Fig. 5
Fig. 5. ApoM-S1P-S1PR1 signaling promotes SVZ-NSCs self-renewal via ERK pathway and inhibits BMP2 expression.
a Quantification of the number and diameter of neurospheres after treatment with ApoM-HDL and ApoM+HDL in NSCs derived from wild-type SVZ (left to right, n  = 9, 4, 4, 4). b A Venn diagram illustrating the DEGs of SVZ-NSCs in a comparison as indicated. c Heatmap of expression values for DEGs. d GO term enrichment analysis of biological process using DAVID Bioinformatics Resources 6.8. e Western blot analysis of p-ERK, p-p38, p-JNK, and p-AKT levels in SVZ-NSCs treated with ApoM+HDL, including comparisons of pretreatment with or without W146, and PTX (n  =  4/group). f Quantification of the number of neurospheres following treatment with ApoM+HDL, with additional comparisons for pretreatment with or without W146, PTX, and U0126 (n  =  8/group). g GO term enrichment analysis of cellular component using DAVID Bioinformatics Resources 6.8. h Hub genes identified from the PPI network using the Cytohubba plug in Cytosacpe. i mRNA levels of BMP2 in SVZ-NSCs after treatment with ApoM-HDL and ApoM+HDL (n  =  5/group). j Representative immunofluorescence images and quantification of BMP2 immunoreactivity in the SVZ of WT, Apom-/- and Apom-/- mice transplanted with Apom-/- or ApomTG serum (n  =  5/group). Scale bars, 30 μm. k Quantification of BMP2 immunoreactivity in the SVZ of WT, S1pr1ΔGFAP; Apom-/- mice and S1pr1ΔGFAP; Apom-/- mice transplanted with Apom-/- or ApomTG serum (n  =  5/group). a, e, f, j, k One-way analysis of variance, Tukey’s post hoc test. d, e One-sided Fisher’s exact test with Benjamini-Hochberg correction for multiple testing. i Two-tailed student’s t test. All error bars indicate s.e.m. Source data are provided as a Source Data file.
Fig. 6
Fig. 6. Decrease of blood ApoM-S1P complex correlates with olfactory dysfunction and LV enlargement in early AD patients.
a, b Levels of ApoM (a) and S1P (b) within HDL from PD patients (Normal, n = 21; PD, n = 20). c, d Levels of ApoM (c) and S1P (d) within HDL from AD patients (Normal, n = 27; MCI due to AD, n = 30; Early AD, n = 25). e Correlation between S1P levels within HDL and CC-SIT scores (Normal, n = 25; Early AD, n = 21). Intercepts and 95 % confidence intervals are indicated in the graphs. f Correlation between S1P levels within HDL and ventricular scores (Normal, n = 25; Early AD, n = 25). Intercepts and 95 % confidence intervals are indicated in the graphs. a, b Two-tailed student’s t test. c, d One-way analysis of variance, Tukey’s post hoc test. e, f two-tailed simple linear regression; r, Pearson correlation coefficient. Source data are provided as a Source Data file.
Fig. 7
Fig. 7. Enhancement of blood ApoM-S1P complex ameliorates early events in APP/PS1 mice.
a S1P concentration (WT, n = 5; APP/PS1, n = 5; APP/PS1/ApomTG, n = 6; ApomTG, n = 4). b–d Quantification of SOX2+GFAP+ cells (b), MASH1+ cells (c), and DCX+ cells (d) in the SVZ (WT, n = 4; APP/PS1, n = 4; APP/PS1/ApomTG, n = 5; ApomTG, n = 4). e Quantification of SOX2+GFAP+BrdU+ cells in the SVZ (n  =  5/group). f The number of primary neurospheres (n  =  5/group). g Quantification of BrdU+ newly formed neurons in the GCL (left) and GL (right) in the OB (n  =  5/group). h Quantification of CB+ cells, CR+ cells, TH+ cells in GL (n  =  5/group). i, j The results of olfactory habituation–dishabituation test for both urine (i) and peanut butter (j) scents (WT, n = 11; APP/PS1, n = 13; APP/PS1/ApomTG, n = 12; ApomTG, n = 10). #P: WT vs APP/PS1, *P: APP/PS1 vs APP/PS1/ApomTG. k The latency to locate a buried food reward (WT, n = 12; APP/PS1, n = 13; APP/PS1/ApomTG, n = 11; ApomTG, n = 10). l Quantification of BB patch area in the walls of LV (n = 5/group). m Quantification of BB patch length/width ratios (n  =  5/group). n Quantification of BB patch displacement (n  =  5/group). o Analysis of angular distribution of BB patch angles in ependymal cells (WT, n = 289; APP/PS1, n = 314; APP/PS1/ApomTG, n = 311; ApomTG, n = 296; five animals/group). #P: WT vs APP/PS1, *P: APP/PS1 vs APP/PS1/ApomTG. p Quantification of CSF flow in the cerebral aqueduct (WT, n = 7; APP/PS1, n = 8; APP/PS1/ApomTG, n = 7; ApomTG n = 7). q Quantification of total ventricle volume (m), LV volume (WT, n = 7; APP/PS1, n = 8; APP/PS1/ApomTG, n = 7; ApomTG, n = 7). a Two-tailed student’s t test. b–h, k, l, n, p, q One-way analysis of variance, Tukey’s post hoc test. i, j Two-way ANOVA for repeated measures. m Contingency table test. o Two-sided Watson U2 test. All error bars indicate s.e.m. All data analysis was done at 4-month-old mice. Source data are provided as a Source Data file.

Similar articles

References

    1. Skoura, A. & Hla, T. Lysophospholipid receptors in vertebrate development, physiology, and pathology. J. Lipid Res50, S293–S298 (2009). - PMC - PubMed
    1. Liu, Z. et al. Sphingosine 1-phosphate stimulates insulin secretion and improves cell survival by blocking voltage-dependent K(+) Channels in β Cells. Front Pharm.12, 683674 (2021). - PMC - PubMed
    1. Czubowicz, K., Jęśko, H., Wencel, P., Lukiw, W. J. & Strosznajder, R. P. The role of ceramide and sphingosine-1-phosphate in Alzheimer’s disease and other neurodegenerative disorders. Mol. Neurobiol.56, 5436–5455 (2019). - PMC - PubMed
    1. Aoki, S. et al. Sphingosine 1-phosphate-related metabolism in the blood vessel. J. Biochem138, 47–55 (2005). - PubMed
    1. Xu, N. & Dahlbäck, B. A novel human apolipoprotein (apoM). J. Biol. Chem.274, 31286–31290 (1999). - PubMed

MeSH terms

LinkOut - more resources