. 2025 Jul 1;16(1):5606.
doi: 10.1038/s41467-025-60751-z.

MORC2 is a phosphorylation-dependent DNA compaction machine

Affiliations

MORC2 is a phosphorylation-dependent DNA compaction machine

Winnie Tan et al. Nat Commun. .

Abstract

The Microrchidia (MORC) family of chromatin-remodelling ATPases is pivotal in forming higher-order chromatin structures that suppress transcription. The exact mechanisms of MORC-induced chromatin remodelling have been elusive. Here, we report an in vitro reconstitution of full-length MORC2, the most commonly mutated MORC member, linked to various cancers and neurological disorders. MORC2 possesses multiple DNA-binding sites that undergo structural rearrangement upon DNA binding. MORC2 locks onto the DNA using its C-terminal domain (CTD) and acts as a clamp. A conserved phosphate-interacting motif within the CTD was found to regulate ATP hydrolysis and cooperative DNA binding. Importantly, MORC2 mediates chromatin remodelling via ATP hydrolysis-dependent DNA compaction in vitro, regulated by the phosphorylation state of its CTD. These findings position MORC2 CTD phosphorylation as a critical regulator of chromatin remodelling and a promising therapeutic target.


Conflict of interest statement

Competing interests: The authors declare no competing interests.

Figures
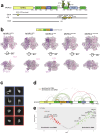
Fig. 1
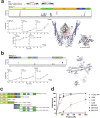
Fig. 1. DNA binding triggers structural changes in full-length MORC2.
a Domain diagram of MORC2 constructs used in this study. The GHKL indicates Gyrase, Hsp90, Histidine Kinase, MutL domain, CC1-4 indicates coiled coil domains, Trans indicates Transducer-like domain, CW indicates CW-type zinc finger domain and TCD indicates Tudor-chromodomain. Phosphorylation sites studied in this work are marked as ‘P’ with the residue number indicated. b The domain diagram on top shows the extent of the model built in MORC2 cryoEM maps. The cryoEM structures of MORC2 S87A (MORC2S87A) mutant, phosphodead (MORC2PD) mutant, MORC2 ATPase (MORC21-603), phosphodead MORC2 with DNA (MORC2PD-DNA), and MORC2 ATPase with DNA (MORC21-603-DNA). Coiled coil 1 is marked as CC1, which is only seen in DNA-free samples. Pink and purple colour models fitted in the cryoEM maps indicate one protomer each of the MORC2 homodimer. c Selected 2D reference-free class averages of MORC2PD-DNA. The blue box shows the 2D classes where DNA (marked by white arrowhead in one of the classes) is seen bound to fuzzy MORC2 density. The red box indicates high-resolution 2D classes where secondary structure elements are clearly visible. d Map of quantified crosslinks in MS analysis of MORC2 DNA and non-DNA bound samples. Crosslinks with a similar abundance in DNA and non-DNA (grey lines), crosslinks considered significantly enriched (adjusted p-value ≤ 0.05) in DNA (green lines) and in non-DNA (red lines) are shown. e Volcano plot of quantified crosslinks, where the log2 DNA/non-DNA fold changes are plotted against the -log10 p-value. Crosslinks that were considered significantly enriched (adjusted p-value ≤ 0.05) in DNA (green) and in non-DNA (red) are highlighted; some of the top hits have the peptide residue numbers indicated. We adjusted for multiple comparisons with Benjamini–Hochberg (BH) correction and the statistical test was two-sided moderated t-test. The full list of all enriched crosslinks is in Supplementary Data 1.
Fig. 2
Fig. 2. There are multiple DNA binding sites, with different affinities, across MORC2.
a Heatmap showing the difference in deuterium uptake between MORC21-603 alone and with three-fold excess 60 bp dsDNA (top). Deuterium uptake plots for example peptides (left). The MORC2 ATPase crystal structure (PDB: 5OF9) coloured by difference after 102 min exchange based on DynamX residue-level scripts without statistical filters (right). Residues without coverage are grey. b Heatmap showing the difference in deuterium uptake between MORC2496-1032 alone and with three-fold excess 60 bp dsDNA (top). Deuterium uptake plots for example peptides (left). The MORC2496-1032 Alphafold Model 1 coloured by difference after 102 min exchange based on DynamX residue-level scripts without statistical filters (left). Residues without coverage are grey. For the model, only residues with >40 confidence are shown. For a and b, blue/red heatmap colouring indicates a difference ≥5% with a p-value ≤ 0.01 in Welch’s one-sided t-test (number of replicates (n) =3). Plots show deuterium uptake for representative peptides for MORC2 alone (black) or with DNA (grey). Error bars are mean ± 2 standard deviation (SD, n = 3) and the y-axis is 80% of the maximum theoretical deuterium uptake, assuming the complete back exchange of the N-terminal residue. Source data are provided as a Source Data file. c Schematic for MORC2 constructs used in DNA binding EMSA. d Quantification of percentage of 60 bp dsDNA bound to MORC2 WT (1-1032), ATPase (1-603), GHKL (1-265), GHKL + CC1 (1-495), CW domain (496-603), CW + CC1 + CTD (496-1032) and CCW + CTD (604-1032). The points are shown as mean +/− standard deviation; number of independent experiments (n) = 3. Source data are provided as a Source Data file.
Fig. 3
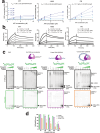
Fig. 3. MORC2 acts as a DNA clamp with phosphorylation-dependent ATPase activity.
a In vitro Fluorescence Polarisation ATPase activity of MORC2 WT, ATPase (1-603) and PD mutant. Individual measurements (n = 3) are shown as points, and the solid line represents the non-linear fit of the data. The indicated kcat values are mean ± standard error of mean (SEM) representative of three experiments. b Surface plasmon resonance analysis of MORC2 WT, ATPase (1-603) and PD mutant with protein concentrations of 4, 8, 16, 33, 63, 125, 250 and 500 nM. Values for KD (equilibrium dissociation constant), ka (association rate constant) and kd (dissociation rate constant) are shown as mean ± SEM, representative of three experiments. c Schematic of competition EMSA with input IRDye800dsDNA (column 1), pre-incubated with no DNA (column 2), 101 bp linear (column 3) and 101 bp circular DNA (column 4) is shown on top. The 100 nM MORC2 WT protein was pre-incubated with no DNA, 200 nM 101 bp linear or 200 nM 101 bp circular DNA for 30 min, followed by 10 min incubation with 50, 100, 200, 400 or 800 nM 90 bp IRDye800-labelled dsDNA. The protein to IRDye800-labelled DNA concentration (nM) in controls (lane 2 in Column 2, Column 3 and 4) is 100:800. The reaction is resolved on 6% PAGE gel. SYBR gold (top) and IRDye800 (bottom) channel images are shown. *indicates background circular DNA bands. The MORC2 protein and linear and circular DNA cartoons were created in BioRender. Tan, W. (2025) https://BioRender.com/xfcicda. d Quantification of the IRDye800-labelled DNA bound to MORC2, calculated as described in Supplementary Fig 10a. The points are shown as mean ± standard deviation (SD) from three independent experiments; number of independent experiments (n) = 3. For Fig. 3a-d, source data are provided as a Source Data file.
Fig. 4
Fig. 4. MORC2 occupies open chromatin regions.
a Heatmaps showing H3K9me3 and MORC2 ChIP-seq coverage of promoter-overlapping MORC2 WT peaks (total number of peaks = 8317), sorted by MORC2 intensity. b Mean coverage of H3K9me3 and MORC2 ChIP-seq and ATAC-seq signals from 5 kb upstream of promoter-overlapping MORC2 WT peaks (total number of peaks = 8317) to 5 kb downstream. c Representative Integrative Genomics Viewer (IGV) image of H3K9me3 and MORC2 ChIP-seq and ATAC-seq tracks in HEK293T cells showing chr3:56,710,637-56,733,116. For (ac), two biological replicates from ChIP- and ATAC-seq assays were used for visualization purposes. d Upset plot of MORC2 WT peaks showing the number of peaks overlapping H3K9me3 peaks, promoter regions and ATAC-seq peaks. The number of peaks without any overlap is also presented. e FLIM-FRET analysis of HEK293T co-expressing H2B-eGFP and H2B-mCh, with MORC2 and H3K9me3 immunofluorescence labelled with Alexa Fluor dye 647 (AF647). f The corresponding pseudo-coloured maps show chromatin compaction, where red colour represents compact chromatin region. g Masks based on MORC2 or H32K9me3 intensity image mapped to H2B FRET map. h The ratio of the histone FRET fraction (indicative of compact chromatin) inside versus outside regions of high-intensity MORC2 or H3K9me3, as illustrated in panel g are plotted. For (eh), Number of cells (N) = 24 cells for MORC2 and N = 17 cells for H3K9me3, two biological replicates. The box and whisker plot in panel h shows the minimum, maximum, and sample median where **** indicates P < 0.0001, unpaired two-sided t-test. Source data are provided as a Source Data file.
Fig. 5
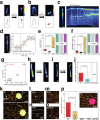
Fig. 5. MORC2 compacts DNA in a manner dependent on ATP-hydrolysis and phosphorylation.
a Snapshots and schematics of doubly tethered SxO-labelled DNA, before reaction with MORC2 (left) and after (right). b Snapshot of a side-flow experiment, at the beginning of flow (left) and after compaction (right). c Snapshot and kymograph of DNA compaction. d Representative trace of DNA compaction mediated by MORC2. Intensity of DNA cluster (red circle) was fitted to a single exponential. e Lag time of WT, PD, S87A, 1–603 and 604–1032 (mean ± SD, number of technical replicates (n) = 23, 25, 31, 100 and 100 DNA molecules for WT, PD, S87A, 1–603 and 604–1032, respectively). f Compaction time of MORC2WT, MORC2PD, MORC2S87A, MORC21–603 and MORC2604–1032 (mean ± SD, number of technical replicates (n) = 23, 25, 31, 100 and 100 DNA clusters for MORC2WT, MORC2PD, MORC2S87A, MORC21–603 and MORC2604–1032, respectively). g Scatter plot of MORC2’s ATP-turnover rate and DNA-compaction kinetics. h, i Snapshot images of DNA before and after applying LPP-treated MORC2 and PAK1-treated MORC2. LPP-treated MORC2 induced clear DNA compaction while PAK1-treated MORC2 could not induce DNA compaction. j Compaction time (sec) of WT (in same reaction conditions as LPP and PAK1-treated MORC2 samples), LPP- treated MORC2, and PAK1-treated MORC2 (mean ± SD, n = 14, 13, and 100 images for WT, LPP-MORC2, and PAK1-MORC2, respectively). ko Dry AFM images of MORC2WT (k), MORC2S87A (l), MORC2N39A (m), MORC21–603 (n), and MORC2604-1032 (o). Experiments were repeated independently 7, 3, 3, 3, and 3 times for (k)–(o), respectively. p Cluster volume with various conditions (n = 19 clusters for MORC2WT and MORC2S87A). No clusters were observed for MORC2N39A, MORC21–603 and MORC2604–1032. For (e), (f), (g), and (p), the centre line and bounds of the box represent the mean and SD, respectively. The p-values for these panels were obtained by the two-tailed unpaired t-test, with no adjustments for multiple comparisons. For eg, j, and p, source data are provided as a Source Data file.
Fig. 6
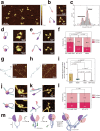
Fig. 6. MORC2 changes conformation upon ATP binding via heads dimerization.
a Representative dry-AFM image of MORC2 in the absence of ATP. b Representative images of the monomer (top) and dimer (bottom) forms of MORC2. Experiments were repeated independently three times for (a) and (b). c Distributions of MORC2 volume, showing two distinct peaks, indicating two populations of monomers and dimers. Two gaussian fitting was used. Cartoons and representative images illustrating various O-shape of the MORC2 dimer (d) and V-shape of MORC2 dimer (e) in absence of DNA. f Relative occurrence of O-shaped and V-shaped conformations (number of technical replicates (n) = 252, 1001, and 68 individual proteins with AMP-PNP, AMP and the N39A mutant, respectively). Error bars represent counting errors. Cartoons and representative image of the S87A (g) and N39A mutants bound to DNA (h). i Number of DNA-bound MORC2 proteins per unit DNA length under various conditions: the S87A mutant (n = 21), N39A mutant (n = 13), the 1–603 fragment (n = 5), and the 604–1032 fragment (n = 5). The centre line and bounds of the box represent the mean and SD, respectively. Cartoons and representative images of O-shaped WT ( j) and V-shaped WT (k) bound to DNA. l. Relative occurrence of O-shaped and V-shaped conformations bound to DNA (n = 119 molecules from 11 independent experiments and n = 35 molecules from 13 independent experiments with AMP-PNP and ATP, respectively). Error bars represent the counting errors for each protein shape. For (f), (i) and (l), the p-values were obtained by the one-tailed unpaired t-test. For (c), (f), (i) and (l), source data are provided as a Source Data file. m Model of DNA compaction mediated by MORC2 phosphorylation and ATP hydrolysis. A MORC2 molecule dimerised at CTD is shown, which subsequently gets dimerised at it NTD upon phosphorylation, DNA binding and ATP hydrolysis. Upon dephosphorylation, the DNA is clamped by MORC2 strongly. Eventually, another MORC2 molecule is recruited bringing in more DNA, thus leading to DNA compaction. For (an) the experiments were performed with two biological replicates. The panel m was created in BioRender. Tan, W. (2025) https://BioRender.com/11811kf.

Similar articles

References

    1. Udugama, M., Sabri, A. & Bartholomew, B. The INO80 ATP-dependent chromatin remodeling complex is a nucleosome spacing factor. Mol. Cell. Biol.31, 662–673 (2011). - PMC - PubMed
    1. Marfella, C. G. & Imbalzano, A. N. The Chd family of chromatin remodelers. Mutat. Res. 618, 30–40 (2007). - PMC - PubMed
    1. Mittal, P. & Roberts, C. W. M. The SWI/SNF complex in cancer - biology, biomarkers and therapy. Nat. Rev. Clin. Oncol.17, 435–448 (2020). - PMC - PubMed
    1. Li, Y. A. et al. The emerging role of ISWI chromatin remodeling complexes in cancer. J. Exp. Clin. Canc Res. 40, 346 (2021). - PMC - PubMed
    1. Li, D. Q., Nair, S. S. & Kumar, R. The MORC family: new epigenetic regulators of transcription and DNA damage response. Epigenetics8, 685–693 (2013). - PMC - PubMed

LinkOut - more resources