. 2025 Jul 1;16(1):5927.
doi: 10.1038/s41467-025-61028-1.

Cardiomyocyte-derived USP13 protects hearts from hypertrophy via deubiquitinating and stabilizing STAT1 in male mice

Affiliations

Cardiomyocyte-derived USP13 protects hearts from hypertrophy via deubiquitinating and stabilizing STAT1 in male mice

Jibo Han et al. Nat Commun. .

Abstract

Cardiac hypertrophy leads to ventricular dysfunction and heart failure. Deubiquitinating enzymes are responsible for preserving the substrate protein stability and are essential to myocardial hypertrophy. In this study, we aimed to explore the role and regulatory mechanism of a cardiomyocyte-derived deubiquitinating enzyme, USP13, in cardiac hypertrophy. Here we show that USP13 was increased in hypertrophic myocardium and was mainly distributed in cardiomyocytes. Cardiomyocyte-specific Usp13 knockout aggravated TAC or Ang II-induced myocardial hypertrophy and dysfunction in male mice. Correspondingly, USP13 overexpression by AAV9 in hearts exerted a therapeutic impact on cardiac hypertrophy in male mice. Mechanistically, we identified STAT1 as a substrate of USP13 through interactome analysis. USP13 deubiquitinated STAT1, thereby reducing its degradation. Subsequently, USP13 promoted the STAT1-targeted Nppb gene transcription and enhanced mitochondrial function in cardiomyocytes. This study illustrated a beneficial effect of USP13 in hypertrophic cardiomyocytes and identified a cardiomyocyte-specific USP13-STAT1 axis in regulating cardiac hypertrophy.


Conflict of interest statement

Competing interests: The authors declare no competing interests.

Figures

Fig. 1
Fig. 1. Identification of cardiomyocyte-derived USP13 as a vital factor in cardiac hypertrophy.
a The mRNA profile of DUBs in Ang II-induced mouse hypertrophic myocardium was showed from a published transcriptome data (n = 3; GSE221396; P values were determined by Wald test from DESeq2 software with Benjamini-Hochberg’s correction). b RT-qPCR analysis of Usp13 mRNA level in Ang II- and TAC- induced mouse hypertrophic myocardium (n = 6) as well as human hypertrophic myocardium (n = 4; NCH non-cardiac hypertrophy, CH cardiac hypertrophy) (P values were determined by two-tailed unpaired t test). c Representative western blot of USP13 in Ang II- and TAC- induced mouse heart tissues (upper) and corresponding quantitative analysis (below, n = 6, P values were determined by two-tailed unpaired t test). dg A single-cell mRNA sequencing was performed in hearts from TAC-treated mice (For each group, single-cell suspensions from 3 to 4 hearts were pooled as 1 sample). d tSNE plot showing 5 main cell types, including cardiomyocytes (CM), fibroblasts (FB), macrophages (MP), endothelial cells (EC) and pericytes (PC). e Biaxial scatter plot showing the expression pattern of Usp13 in these cell types. f UMAP distribution of clustering revealed 3 functional cardiomyocyte clusters. g Dot plot indicated the relative expression of Usp13 in the different functional cardiomyocyte clusters. h The cellular origin of USP13 in Ang II- (left) and TAC- (right) induced heart sections was revealed by immunofluorescence staining (Red: USP13; Green: α-actinin). For b-c, data are presented as mean ± s.e.m.
Fig. 2
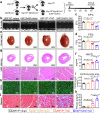
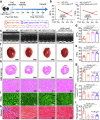
Fig. 2. Cardiomyocyte-specific Usp13 knockout aggravates cardiac hypertrophy challenged by pressure overload.
a Schematic diagram of the strategy for the generation of cardiomyocyte-specific USP13 knockout mice (USP13cKO) and the experimental timeline of TAC model (USP13cKO mice and USP13f/f mice were subjected to TAC or sham operations for 4 weeks). Myh6-Cre+/- indicates Myh6-Cre heterozygous. b Representative M-mode echocardiographic images of left ventricle were assessed by non-invasive transthoracic echocardiography. c, d M-mode echocardiographic analysis of Ejection fraction (EF) and fractional shortening (FS). e Representative images of gross-heart from each group. f The ratio of heart weight (HW) to tibial length (TL). g Representative images of heart sections stained with H&E. h, i Representative images of heart sections stained with WGA and corresponding quantitative analysis. j, k Representative Masson’s trichrome stained images of heart sections and corresponding quantitative analysis. n = 7 for each group; For (c, d, f, i, k, adjusted P values were determined by one-way ANOVA with Bonferroni’s correction and data are presented as mean ± s.e.m.
Fig. 3
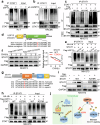
Fig. 3. USP13 directly binds STAT1 and maintains the stability of STAT1.
a Schematic illustration of the interactomes for USP13 substrate screening. HL-1 (Dataset I) and NRCMs (Dataset II) were transfected with Flag-vector or Flag-USP13 plasmids, followed by Ang II stimulation (1 μM, 24 h). Anti-Flag and protein G-Sepharose beads were added to the cell samples for co-IP. Flag-vector plasmid was used as a negative control to exclude non-specific proteins bound to Flag, anti-Flag and protein G-Sepharose beads. The binding proteins were extracted, digested to peptide, and then subjected to LC-MS/MS analysis. The following table showed the candidate substrates of USP13 screened by interactomes. b, c 2D plots with the log10 signal intensity of the quantified proteins on the y axis (revealing the enrichment in Flag-USP13-IP) and the molecular weight (MW) of proteins on the x axis were identified from Dataset I (b) and II (c). d Co-IP of endogenous USP13 and STAT1 in lysates of Ang II- stimulated HL-1 (1 μM, 24 h). e Co-IP of endogenous USP13 and STAT1 in lysates of Ang II- treated heart tissues (1000 ng/kg/min, 4 weeks). f Co-IP of exogenous Flag-USP13 and STAT1 in lysates from NIH/3T3 expressing Flag-USP13 and STAT1. g Representative western blot of Flag-USP13, P-STAT1 and STAT1 in HL-1 expressing Flag-USP13. h, i Representative western blot of STAT1 and Flag-USP13 in HL-1 expressing Flag-USP13 or Flag-vector with CHX (25 μg/mL) pulse-chase stimulation (h) and the quantitative analysis of STAT1 (i; n = 3 independent experiments, adjusted P values were determined by two-way ANOVA with Bonferroni’s correction). j The mRNA levels of Usp13 and Stat1 in HL-1 expressing Flag-USP13 or Flag-vector (n = 6 independent experiments, P values were determined by two-tailed unpaired t test). For i, j, data are presented as mean ± s.e.m.
Fig. 4
Fig. 4. USP13 regulates the stability and deubiquitination of STAT1 at residue K379 via its active site C343.
a HL-1 cells were transfected with Flag-USP13 and then subjected to Ang II (1 μM, 24 h) and MG132 (20 μM, 2 h). Lysates were subjected to Co-IP with anti- STAT1, which was followed by western blot of Ub, Flag-USP13 and STAT1. b NRCMs were transfected with siUSP13 and then subjected to Ang II (1 μM, 24 h) and MG132 (20 μM, 2 h). Lysates were subjected to Co-IP with anti- STAT1, which was followed by western blot of Ub, USP13 and STAT1. c STAT1, HA-Ub, or its mutant reserving only K48 (HA-K48) or K63 (HA-K63) were transfected into NIH/3T3 with or without Flag-USP13 and then subjected to 20 μM MG132 for 2 h. Co-IP assays were performed with anti-STAT1 and followed by western blot of HA, Flag-USP13 and STAT1. d Schematic illustration of USP13 active site (C343). e STAT1 and HA-Ub were transfected into NIH/3T3 with or without Flag-USP13 (WT or C343A) followed by MG132. Co-IP assays were performed with anti-STAT1 and followed by western blot of HA, Flag and STAT1. f Representative western blot of STAT1 and Flag-USP13 in NIH/3T3 expressing Flag-USP13 (WT or C343A) with CHX (25 μg/mL) pulse-chase stimulation and the quantitative analysis of STAT1 (n = 3 independent experiments, adjusted P values were determined by two-way ANOVA with Bonferroni’s correction and data are presented as mean ± s.e.m). g Schematic illustration of the STAT1 ubiquitinated-lysine residue (K379). h STAT1 (WT or K379R) and HA-Ub were transfected into NIH/3T3 with or without Flag-USP13 and followed by MG132. Ubiquitinated STAT1 was enriched with anti-STAT1 and then was detected with HA, Flag and STAT1. i Representative western blot of Flag-USP13 and STAT1 in NIH/3T3 expressing Flag-USP13 and STAT1 (WT or K379R). j Scheme for the mechanism of USP13 deubiquitinates STAT1.
Fig. 5
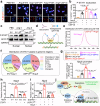
Fig. 5. USP13 promotes the nuclear translocation of STAT1 to up-regulate anti-hypertrophic gene transcription in cardiomyocytes.
ag HL-1 were transfected with plasmids of empty vector (EV) or USP13 (USP13OE) followed by Ang II stimulation (1 μM, 24 h). HL-1 were pretreated with Spautin-1 (USP13i, 10 μM, 1 h) followed by Ang II stimulation. a, b The P-STAT1 nuclear translocation was detected by immunofluorescence and the corresponding quantitative analysis (n = 6 independent experiments, adjusted P values were determined by one-way ANOVA with Bonferroni’s correction; black column: Ang II + EV, purple column: Ang II+Veh). c Levels of P-STAT1 in nuclear were detected by western blot. Lamin B was used as loading control. d Schematic of CUT&Tag to map the genomic occupancy of STAT1. e Distribution of STAT1 binding peaks around the gene transcriptional start site (TSS, within 3 kb (kb=1000 bp)) from CUT&Tag-sequence of Ang II-induced HL-1 cells with or without USP13OE. f Genome distribution of STAT1‑binding peaks from CUT&Tag-sequence of Ang II-induced HL-1 cells with or without USP13OE. g CUT&Tag-qPCR assay of the binding of STAT1 at Nppb promoter regions (n = 6 independent experiments, adjusted P values were determined by one-way ANOVA with Bonferroni’s correction). h HL-1 cells were co-transfected with the luciferases and pcDNA3.1-STAT1 plasmid for 48 h. Dual luciferase reporter assay detected the luciferase activation driven by the wild type (WT) or mutant (Mut) of Nppb promoter after normalization to Renilla luciferase (n = 6 independent experiments, adjusted P values were determined by one-way ANOVA with Bonferroni’s correction). i STAT1 knockdown HL-1 cells achieved by short hairpin RNA (shSTAT1) were transfected with plasmids of EV or USP13OE followed by Ang II. RT-qPCR analysis the mRNA level of Nppb (n = 6 independent experiments, adjusted P values were determined by one-way ANOVA with Bonferroni’s correction). j The schematic shows that USP13 promotes the nuclear translocation and promoter regions (e.g. Nppb) binding of STAT1, and then transcriptionally regulates gene expression via STAT1 in cardiomyocytes. For b and g-i, data are presented as mean ± s.e.m.
Fig. 6
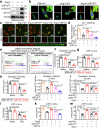
Fig. 6. USP13 promotes the mitochondria translocation of STAT1 and improves mitochondrial complex I activity and ATP synthesis.
ad, j, k HL-1 were transfected with plasmids of empty vector (EV) or USP13 (USP13OE) followed by Ang II stimulation (1 μM, 24 h). HL-1 were pretreated with Spautin-1 (USP13i, 10 μM, 1 h) followed by Ang II stimulation. a Levels of P-STAT1 and STAT1 in mitochondria was detected by western blot. Tom 20 was used as loading control. b The P-STAT1 mitochondria translocation was detected by immunofluorescence. c, d Representative images of JC-1 staining (c; green: JC-1 monomers meaning decreased MMP; red: JC-1 aggregates meaning increased MMP) and the quantitative analysis (d; n = 6 independent experiments, adjusted P values were determined by one-way ANOVA with Bonferroni’s correction; black column: Ang II + EV, purple column: Ang II+Veh). e GSEA enrichment analysis of transcriptome of heart tissues from Ang II- induced USP13cKO mice and USP13f/f mice (NES: normalized enrichment score; FDR: false discovery rate). fi Complex I activity and ATP levels were detected in heart tissues from Ang II- (f, g) or TAC- (h, i) induced USP13f/f mice and USP13cKO mice (n = 6, adjusted P values were determined by one-way ANOVA with Bonferroni’s correction). j, k Complex I activity (j) and ATP levels (k) were detected in HL-1 (n = 6 independent experiments, adjusted P values were determined by one-way ANOVA with Bonferroni’s correction; black column: Ang II + EV, purple column: Ang II+Veh). l, m STAT1 knockdown HL-1 cells were transfected with plasmids of EV or USP13OE followed by Ang II. Complex I activity (l) and ATP levels (m) were detected (n = 6 independent experiments, adjusted P values were determined by one-way ANOVA with Bonferroni’s correction). For (d, fm), data are presented as mean ± s.e.m.
Fig. 7
Fig. 7. Cardiomyocyte-specific overexpression of USP13 ameliorates established cardiac dysfunction, and STAT1 suppresses myocardial dysfunction regardless of the presence or absence of USP13.
a Wildtype (WT) and USP13cKO mice were subjected to TAC for 6 weeks. AAV9 cardiomyocyte-specific overexpressing USP13 (USP13OE), STAT1 (STAT1OE), or vehicle (EV) were injected at the end of 2nd week after TAC (2E + 11 v.g.). Echocardiography was performed at different stages (0, 4, and 6 weeks) after TAC. Mice were harvested 6 weeks after TAC. b Ejection fraction (EF) and fractional shortening (FS) at TAC 0, 4, 6 weeks. ce M-mode echocardiographic images of left ventricle, EF and FS at TAC 6 week. f Representative images of gross-heart at TAC 6 week. g The ratio of heart weight (HW) to tibial length (TL). h Representative images of heart sections stained with H&E at TAC 6 week. i, j Representative images of heart sections stained with WGA and corresponding quantitative analysis at TAC 6 week. k, l Representative Masson’s trichrome stained images of heart sections and corresponding quantitative analysis at TAC 6 week. n = 7 for each group; For (d, e, g, j, l), adjusted P values were determined by one-way ANOVA with Bonferroni’s correction and data are presented as mean ± s.e.m.

Similar articles

References

    1. Nakamura, M. & Sadoshima, J. Mechanisms of physiological and pathological cardiac hypertrophy. Nat. Rev. Cardiol.15, 387–407 (2018). - PubMed
    1. Mishra, S. & Kass, D. A. Cellular and molecular pathobiology of heart failure with preserved ejection fraction. Nat. Rev. Cardiol.18, 400–423 (2021). - PMC - PubMed
    1. McKinsey, T. A. & Kass, D. A. Small-molecule therapies for cardiac hypertrophy: moving beneath the cell surface. Nat. Rev. Drug Discov.6, 617–635 (2007). - PubMed
    1. Karbassi, E. et al. Cardiomyocyte maturation: advances in knowledge and implications for regenerative medicine. Nat. Rev. Cardiol.17, 341–359 (2020). - PMC - PubMed
    1. Popovic, D., Vucic, D. & Dikic, I. Ubiquitination in disease pathogenesis and treatment. Nat. Med.20, 1242–1253 (2014). - PubMed

Substances

LinkOut - more resources