. 2025 Jul 1;16(1):6011.
doi: 10.1038/s41467-025-61088-3.

Adipocyte-specific Zeb1 downregulation remodels the tumor-associated adipose microenvironment to facilitate female breast cancer progression

Affiliations

Adipocyte-specific Zeb1 downregulation remodels the tumor-associated adipose microenvironment to facilitate female breast cancer progression

Lixia Cao et al. Nat Commun. .

Abstract

Upon penetrating the basement membrane, breast cancer cells directly interact with their surrounding adipose tissue, which forms a unique tumor-associated adipose microenvironment (TAME). However, the underlying mechanism of lipid metabolic remodeling in the TAME remains elusive. Herein, we report a Zeb1-orchestrated bidirectional communication between breast cancer cells and their adjacent cancer-associated adipocytes (CAAs). At the molecular level, breast cancer cells, through the secretion of adrenomedullin (AM), induce downregulation of Zeb1 expression to activate the Atgl/Hsl/Scd-dependent lipolysis in CAAs, resulting in the release of palmitoleic acid (POA) into the TAME. In turn, the increased POA in breast cancer competes with arachidonic acid (ARA) for the phospholipid synthesis, leaving more ARA is utilized for PDG2 production to trigger the malignant progression of breast cancer and AM production. Importantly, disruption of Zeb1-dependent lipolytic activity and/or membrane phospholipid remodeling within the TAME dramatically diminishes the aggressiveness of breast cancer in vitro and in vivo.


Conflict of interest statement

Competing interests: The authors declare no competing interests.

Figures
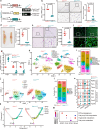
Fig. 1
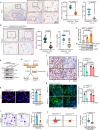
Fig. 1. Adipocyte-specific depletion of Zeb1 impairs adipocyte differentiation in vivo.
a Genotypic identification of the genetic mouse model with adipocyte-specific Zeb1 knock-out (n = 5 Zeb1fl/fl, 5 Zeb1adiKO). b Relative mRNA levels of Zeb1 (n = 5 Zeb1fl/fl, 5 Zeb1adiKO). c Immunohistochemistry staining for Zeb1 (n = 5 Zeb1fl/fl, 5 Zeb1adiKO; scale bars, 50 μm). d Fat pad weight (n = 5 Zeb1fl/fl, 5 Zeb1adiKO). e HE staining for adipocyte size analysis (n = 5 Zeb1fl/fl, 5 Zeb1adiKO; Scale Bars, 50 μm). f Immunofluorescence staining for perilipin-1 (n = 5 Zeb1fl/fl, 5 Zeb1adiKO; Scale Bars, 50 μm). g Relative mRNA levels of Pref1, Ppar-γ and C/ebpα (n = 5 Zeb1fl/fl, 5 Zeb1adiKO). h TSNE visualization showing seven major clusters of mammary cells by single nucleus RNA-sequencing (n = 3 Zeb1fl/fl, 3316 cells, 3 Zeb1adiKO, 6937 cells). i Relative ratio of the indicated cell cluster by single nucleus RNA-sequencing (n = 3 Zeb1fl/fl, 3 Zeb1adiKO). j TSNE visualization showing five adipocyte subtypes by single nucleus RNA-sequencing (n = 3 Zeb1fl/fl, 1548 cells, 3 Zeb1adiKO, 4048 cells). k Pseudo-time trajectory for the adipocyte subpopulations by single nucleus RNA-sequencing (n = 3 Zeb1fl/fl, 3 Zeb1adiKO). l Relative ratio of the indicated adipocyte subpopulation by single nucleus RNA-sequencing (n = 3 Zeb1fl/fl, 3 Zeb1adiKO). m Dot plot showing the pathway enrichment of the indicated adipocyte subpopulation by single nucleus RNA-sequencing (n = 3 Zeb1fl/fl, 3 Zeb1adiKO). n Violin plots of the lipid metabolism-related genes for the indicated adipocyte clusters by single nucleus RNA-sequencing (n = 3 Zeb1fl/fl, 3 Zeb1adiKO). Data were expressed as means ± SEM. be, g were assessed via two-tailed unpaired Student’s t-test. m were assessed via hypergeometric test. Source data are provided as a Source Data file.
Fig. 2
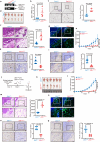
Fig. 2. Elevated expression of adipocyte-specific Zeb1 inhibits breast cancer development in vitro.
a Immunohistochemical staining for Zeb1 in normal mammary adipocytes and CAAs in breast tumors from MMTV-PyMT mice (n = 12 PyMT mice) (A: adipose, T: tumor; scale bars, 50 μm). b Immunohistochemical staining for ZEB1 in normal breast adipocytes and CAAs in human breast cancer samples (n = 40 patients; scale bars, 50 μm). c, d Relative mRNA (c) and protein (d) levels of Zeb1 in 3T3Ctrl-Tet and 3T3Zeb1-Tet cells in response to different concentrations of doxycycline (DOX) (n = 3 independent experiments). e Scheme of cancer cell coculture with 3T3Ctrl-Tet (CAAZeb1-off) and 3T3Zeb1-Tet (CAAZeb1-on) upon DOX-induced Tet-on expression of Zeb1 for 6 days. f, g Oil Red O (f) and Bodipy-C16 fluorescence (g) staining in CAAZeb1-off and CAAZeb1-on co-culture with EO771 cells (n = 3 independent experiments; scale bars, 50 μm). hj EdU proliferation (h), transwell invasion (i), and high-content migration (j) assays in EO771 cells pretreated with supernatant from CAAZeb1-off and CAAZeb1-on cells (n = 3 independent experiments; scale bars, 50 μm). k Protein levels of Snail and Vimentin in EO771 cells pretreated with supernatant from CAAZeb1-off and CAAZeb1-on cells (n = 3 independent experiments). Data were expressed as means ± SEM. Indicated P-values were calculated using two-tailed unpaired Student’s t-test. Source data are provided as a Source Data file.
Fig. 3
Fig. 3. Elevated expression of adipocyte-specific Zeb1 inhibits breast cancer development in vivo.
a Genotypic identification of the genetic mouse model with adipocyte specific-Zeb1 knock-in (n = 5 Zeb1TG, 5 Zeb1adiTG). b Relative mRNA levels of Zeb1 (n = 5 Zeb1TG, 5 Zeb1adiTG). c Immunohistochemical staining for Zeb1 (n = 5 Zeb1TG, 5 Zeb1adiTG; scale bars, 50 μm). d EO771 breast cancer allograft in Zeb1TG and Zeb1adiTG mice. e Tumor volume (n = 6 Zeb1TG, 6 Zeb1adiTG). f, g HE (f) and immunofluorescence (g) staining for Perilipin-1 (A: adipose, T: tumor; n = 6 Zeb1TG, 6 Zeb1adiTG; scale bars, 50 μm). h, i, Immunohistochemical staining for Ki-67 (h) and Vimentin (i) (n = 6 Zeb1TG, 6 Zeb1adiTG; scale bars, 50 μm). j Scheme of PyMT breast cancer allograft tumor model. k PyMT breast cancer allograft in Zeb1TG and Zeb1adiTG mice. l Tumor volume (n = 6 Zeb1TG, 6 Zeb1adiTG). m, n HE (m) and immunofluorescence (n) staining for Perilipin-1 (A adipose, T tumor; n = 6 Zeb1TG, 6 Zeb1adiTG; scale bars, 50 μm). o, p Immunohistochemical staining for Ki-67 (o) and Vimentin (p) (n = 6 Zeb1TG, 6 Zeb1adiTG; scale bars, 50 μm). Data were expressed as means ± SEM. e, l was analyzed via two-way ANOVA with Sidak correction for multiple comparisons; b, c, f, h, i, m, o, p were assessed via two-tailed unpaired Student’s t-test. Source data are provided as a Source Data file.
Fig. 4
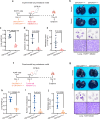
Fig. 4. Elevated expression of adipocyte-specific Zeb1 inhibits lung metastasis in breast cancer.
a Scheme of establishing the experimental lung metastasis of EO771 cells (Some elements by figdraw.com). b Representative images of lung metastases at 30 days (n = 5 mice; scale bars, 50 μm). ce Lung weight (c), number of metastatic lesions (d) and metastatic area (e) (n = 5 mice). f Scheme of establishing the experimental lung metastasis of PyMT cells (Some elements by figdraw.com). g Representative images of lung metastases at 30 days (n = 5 mice; scale bars, 50 μm). hj Lung weight (h), number of metastatic lesions (i), and metastatic area (j) (n = 5 mice). Data were expressed as means ± SEM. ce, hj were assessed via two-tailed unpaired Student’s t-test. Source data are provided as a Source Data file.
Fig. 5
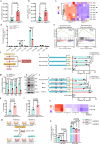
Fig. 5. Ectopic Zeb1 triggers lipid remodeling by regulating MUFA production in CAAs.
a Triglyceride content by non-targeted lipidomics analysis in CAAZeb1-off and CAAZeb1-on cells (n = 5 independent experiments). b Content of monounsaturated fatty acid (MUFA) in Triglyceride (n = 5 independent experiments). c, d Targeted metabolomics analysis of medium- and long-chain fatty acids (c) and their differential contents (d) in the supernatant from CAAZeb1-off and CAAZeb1-on cells (n = 6 independent experiments). e, f RNA-sequencing combined with GSEA for gene sets related to triglyceride and fatty acid metabolisms in CAAZeb1-off and CAAZeb1-on cells (NES, normalized enrichment score) (n = 3 independent experiments). g, h Relative mRNA (g) and protein (h) levels of Atgl, Hsl, Mgl, and Scd in CAAZeb1-off and CAAZeb1-on cells (n = 3 independent experiments). i Luciferase assay for the wild-type promoters of Atgl (−2960/ + 99), Hsl (−3000/ + 8) and Mgl (−2997/ + 103) in Ctrl/3T3-L1 and Zeb1/3T3-L1 cells (n = 3 independent experiments). j Luciferase assay for the wild-type (−2746/ + 300) and E2-box-mutated promoters of Scd in Ctrl/3T3-L1 and Zeb1/3T3-L1 cells (n = 3 independent experiments). k, l ChIP assay for recruitment of Zeb1 to the endogenous Scd promoter in Ctrl/3T3-L1 and Zeb1/3T3-L1 cells (n = 3 independent experiments). m Scheme of CAAZeb1-off and CAAZeb1-on co-culture with EO771 cells in the presence or absence of A939572 (100 nM) for 6 days. n, o Targeted metabolomics analysis of medium- and long-chain fatty acids (n) and their differential contents (o) in the supernatant from CAAZeb1-off and CAAZeb1-on cells in the presence or absence of A939572 (n = 3 independent experiments). Data were expressed as means ± SEM. Indicated P-values were calculated using two-tailed unpaired Student’s t-test. Source data are provided as a Source Data file.
Fig. 6
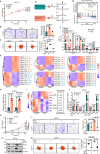
Fig. 6. POA-mediated ARA/PGD2 replacement regulates the dynamic remodeling of membrane phospholipids in breast cancer cells.
ac CCK8 cell viability (a), transwell invasion (b) and high-content migration (c) assays in EO771 cells treated with POA (5 μM) and OA (15 μM) for 48 h, respectively. POA: palmitoleic acid; OA: oleic acid (n = 3 independent experiments; scale bars, 50 μm). d Structure of membrane phospholipids. e Heat map of membrane phospholipids containing either 16:1 or 20:4 fatty acids in EO771 cells in the presence or absence of POA (n = 3 independent experiments). f Contents of the indicated membrane phospholipids containing either 16:1 or 20:4 fatty acids in EO771 cells in the presence or absence of POA (n = 3 independent experiments). g RNA-sequencing combined with GSEA for gene sets related to arachidonic acid metabolism in EO771 cells in the presence or absence of POA (n = 3 independent experiments). h Relative mRNA levels of Pla2g4a and Ptgds in EO771 cells in the presence or absence of POA (n = 3 independent experiments). i, j Targeted metabolomics analysis of arachidonic acids (i) and their differential contents (j) in EO771 cells in the presence or absence of POA. PGD2: prostaglandin D2; 15S-HETE: 15-hydroxyeicosatetraenoic acid; PGF: prostaglandin F; LTB4: leukotriene B4; ARA: arachidonic acid; 12S-HETE: 12-hydroxyeicosatetraenoic acid; 13S-HETE: 13-hydroxyeicosatetraenoic acid; DHA docosahexaenoic Acid (n = 3 independent experiments). km, CCK8 cell viability (k), transwell invasion (l), and high-content migration (m) assays in EO771 cells treated with AT-56 (50 μM) and/or POA (5 μM) for 48 h (n = 3 independent experiments; scale bars, 50 μm). n Protein levels of Snail and Vimentin in EO771 cells treated with AT-56 and/or POA (n = 3 independent experiments). Data were expressed as means ± SEM. a, k was analyzed via two-way ANOVA with Sidak correction for multiple comparisons; b, c, f, h, j, l, m were assessed via two-tailed unpaired Student’s t-test. Source data are provided as a Source Data file.
Fig. 7
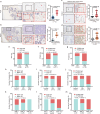
Fig. 7. Relationship of Zeb1, Scd and Ptgds in PyMT tumors and human breast cancer samples.
a, b Immunohistochemical staining for Scd and Ptgds in normal mammary adipocytes and CAAs in tumors from MMTV-PyMT spontaneous breast cancer mice (n = 12 PyMT mice; A: adipose; T: tumor; I: intra-tumor; B: tumor boundary; scale bars, 50 μm). c, d Immunohistochemical staining for SCD (c) and PTGDS (d) in normal breast adipocytes and CAAs in human breast cancer tissue (n = 40 patients; scale bars, 50 μm). eg A direct association between the expression of ZEB1, SCD, and PTGDS in 40 human breast cancer samples (n = 40 patients). hj A direct association between the expression of ZEB1, SCD, and PTGDS with the molecular typing of breast cancer (n = 40 patients). km A direct association between the expression of ZEB1, SCD, and PTGDS with the advanced TNM stages (n = 40 patients). Data were expressed as means ± SEM. ad were assessed via two-tailed unpaired Student’s t-test. em were assessed via Spearman’s rank correction test. Source data are provided as a Source Data file.
Fig. 8
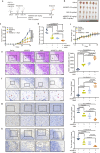
Fig. 8. AMA combined with A939572 targets TAME to inhibit breast cancer progression.
a Scheme showing combinational treatment of A939572 with AMA in mice. b EO771 allograft tumors in the mammary fat pads. c, d Tumor volume (c) and weight (d) (n = 6 mice). e HE staining (n = 6 mice; A adipose, T tumor; scale bars, 50 μm). fh Immunohistochemical staining for Zeb1 (f), Ki-67 (g) and Vimentin (h) (n = 6 mice; scale bars, 50 μm). i Body weight of mice (n = 6 mice). Data were expressed as means ± SEM. c, i were analyzed via two-way ANOVA with Sidak correction for multiple comparisons. dh were assessed via two-tailed unpaired Student’s t-test. Source data are provided as a Source Data file.
Fig. 9
Fig. 9. Schematic of Zeb1-mediated remodeling of the TAME.
Through Zeb1-deployed lipid metabolic reprogramming, CAAs at the invasive front might prime a maladaptive TAME that reciprocally confers breast cancer with aggressive and lethal properties, providing promising therapeutic approaches to limit local tumor growth and aggressive progression by eliminating this pro-tumorigenic interplay in the TAME (Some elements by figdraw.com).

References

    1. Finley, L. W. S. What is cancer metabolism?. Cell186, 1670–1688 (2023). - PMC - PubMed
    1. Brown, K. A. & Scherer, P. E. Update on adipose tissue and cancer. Endocr. Rev.44, 961–974 (2023). - PMC - PubMed
    1. Kong, L. R. et al. A glycolytic metabolite bypasses “two-hit” tumor suppression by BRCA2. Cell187, 2269–2287.e16 (2024). - PubMed
    1. Zhang, Y. et al. Metabolic switch regulates lineage plasticity and induces synthetic lethality in triple-negative breast cancer. Cell Metab.36, 193–208.e8 (2024). - PubMed
    1. Bartman, C. R. et al. Slow TCA flux and ATP production in primary solid tumours but not metastases. Nature614, 349–357 (2023). - PMC - PubMed

MeSH terms

LinkOut - more resources