. 2025 Jul 1;16(1):6035.
doi: 10.1038/s41467-025-60909-9.

Analysis of the Rehmannia chingii geneome identifies RcCYP72H7 as an epoxidase in iridoid glycoside biosynthesis

Affiliations

Analysis of the Rehmannia chingii geneome identifies RcCYP72H7 as an epoxidase in iridoid glycoside biosynthesis

Fengqing Wang et al. Nat Commun. .

Abstract

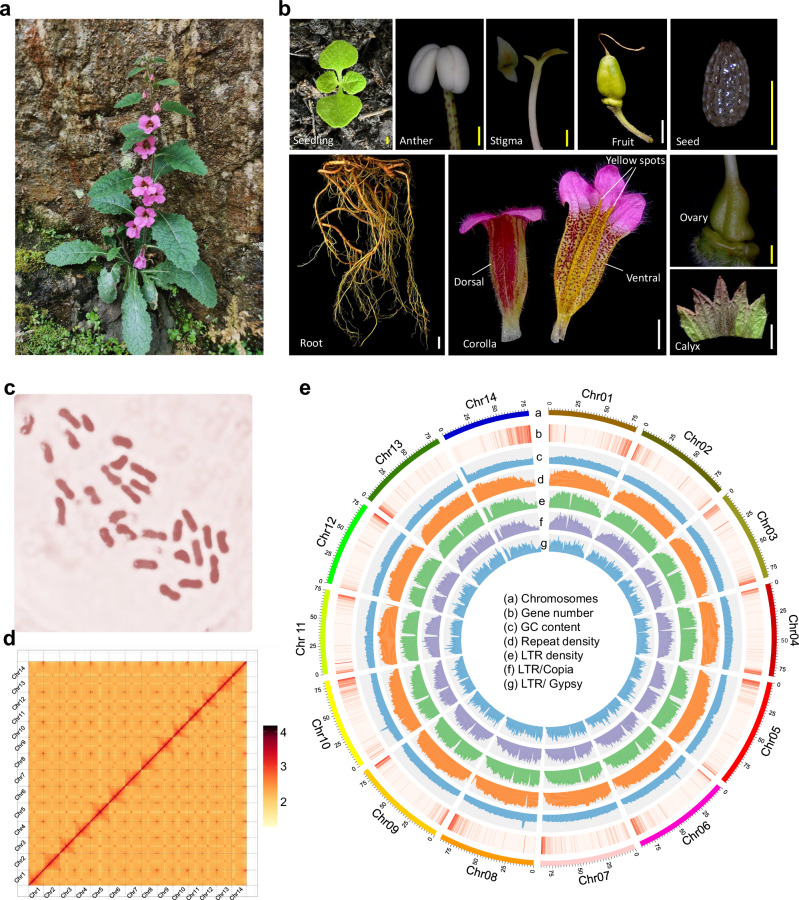
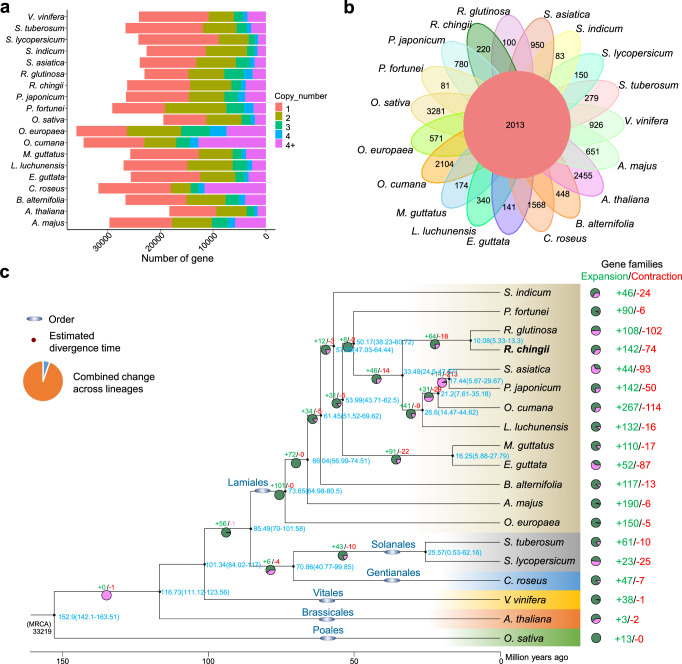
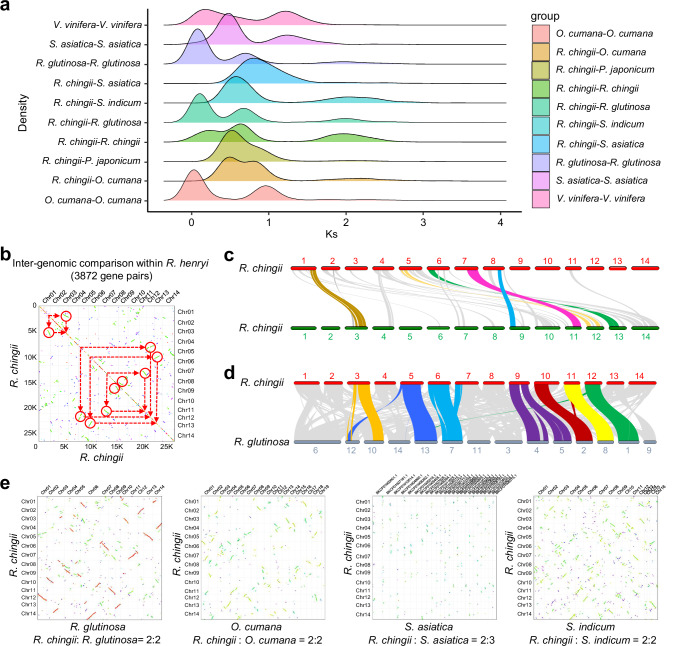
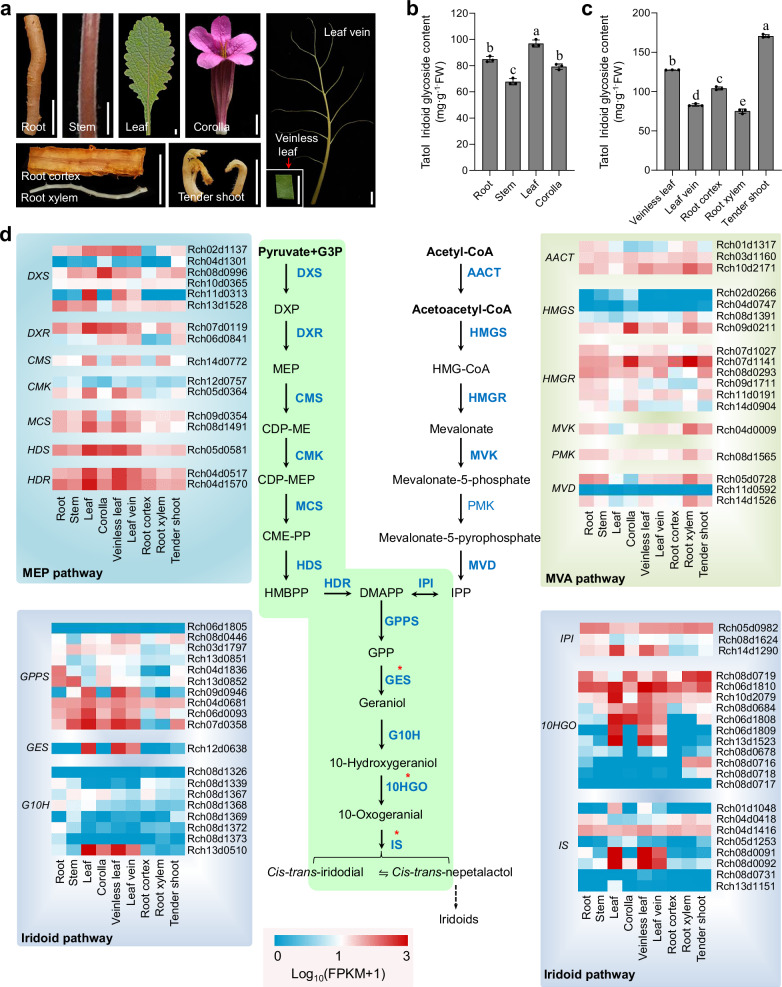
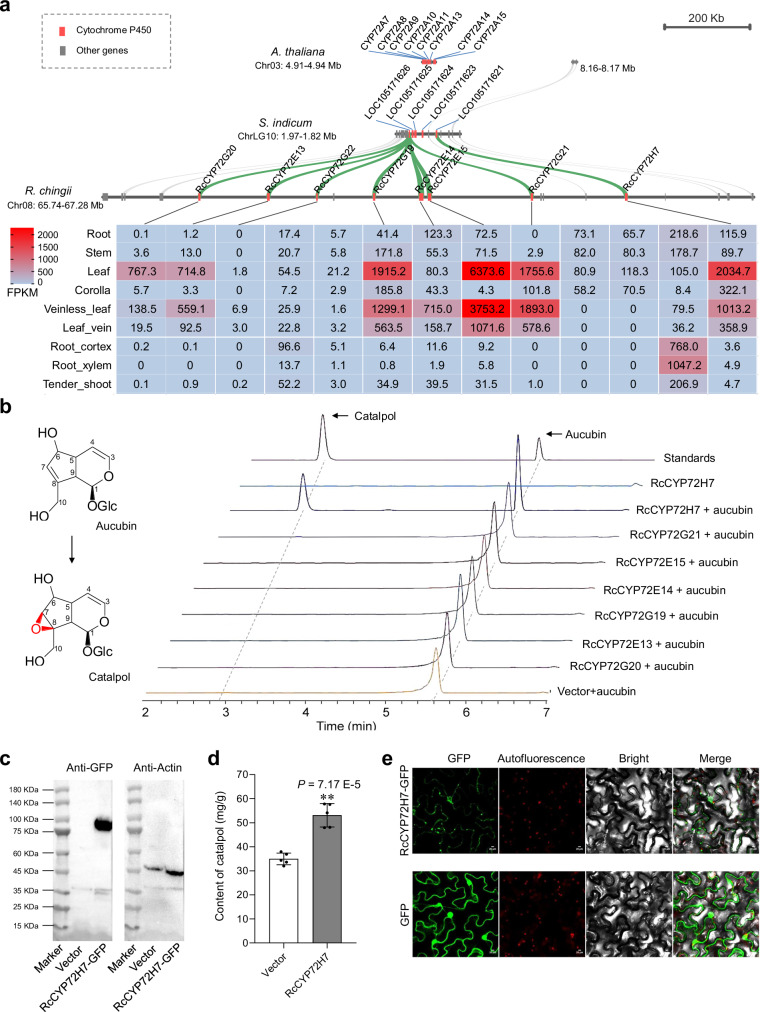
Rehmannia chingii (2n = 2x = 28) is an important folk medicinal plant with high therapeutic value, particularly due to its richness in iridoid glycosides. However, research on its evolution and gene functional identification has been hindered by the lack of a high-quality genome. Here, we present the 1.169 Gb telomere-to-telomere (T2T) genome sequence of R. chingii. Phylogenetic analysis confirms that Rehmannia belongs to the Orobanchaceae family. We find that structural genes of the 2-C-methyl-d-erythritol-4-phosphate (MEP) pathway and the iridoid pathway are predominantly expressed in R. chingii leaves. Further analyses reveal a cytochrome P450 gene cluster localized on chromosome 8, and identify RcCYP72H7 within this cluster as an aucubin epoxidase, capable of catalyzing aucubin epoxidation to form catalpol. The genome offers valuable resources for studying iridoid glycoside biosynthesis and the evolutionary history of Rehmannia, and will help to faciliate genetic improvement of R. chingii for pharmaceutical and health-related applications.


Conflict of interest statement

Competing interests: The authors declare no competing interests.

Figures

Fig. 1
Fig. 1. Morphology, chromosome spread, Hi-C contact map, and genome features of R. chingii.
a Plant morphology of R. chingii. b Morphology of the anther, stigma, fruit, seed, seedling, root, corolla, ovary, and calyx of R. chingii. Scaled bars: white, 1 cm; yellow, 1 mm. c Chromosome number determined from root tip cell of R. chingii. d Hi-C interaction map of R. chingii, with blue boxes representing individual chromosomes. The x- and y-axes indicate the ordered positions of the chromosomes of the genome. e Circos plot of the R. chingii genome. Tracks from a to g represent chromosomes, gene number, GC content, repeat density, LTR density, LTR/Copia density, and LTR/Gypsy density, respectively. Source data are provided as a Source Data file.
Fig. 2
Fig. 2. Comparative genomic and evolutionary analysis of R. chingii.
a Copy number distribution of all gene families in 19 selected angiosperm species. b Gene family cluster petal diagram, with the central circle representing common gene families and the outer petals depicting species-specific gene families. c Phylogenetic analysis, divergence times, and gene family expansions and contractions among 19 plant species. The phylogenetic tree was constructed based on 104 single-copy orthologous genes, with O. sativa as the outgroup. Divergence times (MYA) are shown in blue numbers next to branch nodes. Gene family expansions and contractions are represented by green and red numbers, respectively. Source data are provided as a Source Data file.
Fig. 3
Fig. 3. WGD and synteny analysis of the R. chingii genome.
a Ks distribution analysis. b Dot plots of paralogous gene pairs in the R. chingii genome (3872 gene pairs). c Schematic representation of synteny between different chromosomes, with lines connecting orthologous genes. d Syntenic comparison of the homologous chromosomes between R. chingii and R. glutinosa genomes. e Dot plots of syntenic blocks comparing R. chingii vs. R. glutinosa, R. chingii vs. O. cumana, R. chingii vs S. asiatica, and R. chingii vs. S. indicum. In (c, d), Gray lines show collinear blocks between species. Color lines highlight the major syntenic blocks spanning the genomes. Source data are provided as a Source Data file.
Fig. 4
Fig. 4. Tissue expression profiles of key enzyme genes in the predicted iridoids biosynthetic pathway of R. chingii.
a Phenotype of the selected tissues used for transcriptome analysis. b Total iridoid contents in roots, stems, leaves, and corollas. Values are means ± SD of three biological replicates. c Total iridoid contents in veinless leaves, leaf veins, root cortices, root xylems, and tender shoots. Values are means ± SD of three biological replicates. d Expression patterns of enzyme genes involved in the iridoids biosynthetic pathway, identified via BLAST alignment with C. roseus amino acid sequences. Transcript levels from RNA-seq data are visualized as heatmaps and normalized with log10(FPKM + 1). DXR 1-deoxy-D-xylulose 5-phosphate reductoisomerase, DXS 1-deoxy-D-xylulose-5-phosphate synthase, CMS 2-C-methyl-D-erythritol 4-phosphate cytidylyltransferase, CMK 4-(cytidine 5′-diphospho)-2-C-methyl-D-erythritol kinase, MCS 2-C-methyl-D-erythritol 2,4-cyclodiphosphate synthase, HDS (E)−4-hydroxy-3-methylbut-2-enyl-diphosphate synthase, HDR 4-hydroxy-3-methylbut-2-en-1-yl diphosphate reductase, AACT acetyl-CoA C-acetyltransferase, HMGS hydroxymethylglutaryl-CoA synthase, HMGR hydroxymethylglutaryl-CoA reductase, MVK mevalonate kinase, PMK phosphomevalonate kinase, MVD diphosphomevalonate decarboxylase, IPI isopentenyl-diphosphate Delta-isomerase, GPPS geranyl diphosphate synthase, GES geraniol synthase, G10H geraniol 10-hydroxylase, 10HGO 10-hydroxygeraniol dehydrogenase, IS iridoid synthase, IO iridoid oxidase. In (b, c), Different letters above the bars indicate significant differences (P < 0.05) as determined by one-way ANOVA with Tukey’s tests. Source data are provided as a Source Data file.
Fig. 5
Fig. 5. Identification of cytochrome P450 genes in the catalpol biosynthetic pathway in R. chingii.
a Proposed biosynthetic pathway of catalpol in R. chingii. G10H geraniol 10-hydroxylase, 10HGO 10-hydroxygeraniol dehydrogenase, IS iridoid synthase, IO iridoid oxidase, 7DLGT 7-deoxyloganetic acid glucosyl transferase, AS aucubin synthase. b Expression patterns of the 15 cytochrome P450 genes in Group I are shown in Supplementary Fig. 18. c Phylogenetic tree of cytochrome P450 proteins in Group I of R. chingii and their homologous proteins from other plants. Species abbreviations: Rc Rehmannia chingii, At Arabidopsis thaliana, Cr Catharanthus roseus, Ca Callicarpa americana, Caa Camptotheca acuminate, Va Vitex agnus-castus, Pt Paulownia tomentosa. d GC-MS analysis of products in S. cerevisiae expressing RcG10H. Extracted ion chromatograms show geraniol (m/z [M + H]+ = 154.14) and 10-hydroxygeraniol (m/z [M + H]+ = 170.13). Source data are provided as a Source Data file.
Fig. 6
Fig. 6. RcCYP72H7 is responsible for catalpol formation in R. chingii.
a Genomic organization and syntenic relationships of cytochrome P450 gene clusters in R. chingii and their orthologs in S. indicum and A. thaliana. Green lines indicate the evolutionary trajectory of P450 homologs, and the red-blue gradient represents expression levels (FPKM values). b Screening of aucubin 7,8-epoxidase activity in selected P450 candidates via Agrobacterium-mediated transient expression in N. benthamiana leaves. MRM chromatograph showing aucubin (m/z 364 → 167/149) and catalpol (m/z 380 → 183/165). c Western blot analysis of N. benthamiana leaves transiently expressing RcCYP72H7-GFP, with Actin used as a loading control. d Catapol content in R. chingii leaves transiently expressing RcCYP72H7. Data are shown as mean ± SD (n = 5 biological replicates). **p < 0.01; Student’s t-test. e RcCYP72H-GFP expression in N. benthamiana leaf cells. Bar = 20 μm. Source data are provided as a Source Data file.

Similar articles

References

    1. Liu, Y. F. et al. Bioactive iridoid glycosides from the whole plants of Rehmannia chingii. J. Nat. Prod.79, 428–433 (2016). - PubMed
    1. Yang, M. Q. et al. Rehmannia chrysantha (Rehmanniaceae), a new species from Inner Mongolia, northern China. Phytotaxa265, 177 (2016).
    1. Miao, C. et al. De novo transcriptome analysis identifies RpMYB1 as an activator of anthocyanin biosynthesis in Rehmannia piasezkii. Plant Physiol. Biochem.215, 108964 (2024). - PubMed
    1. Xia, Z. et al. Identification of DNA barcoding in plants of Rehmannia Libosch. ex Fisch. et Mey. and origin of cultivated Rehmannia glutinosa (in Chinese). Chin. Tradit. Herb. Drugs47, 648–654 (2016).
    1. Liu, Y. F. et al. Four new iridoid glycosides from the roots of Rehmannia glutinosa. J. Asian Nat. Prod. Res.10, 1–9 (2023). - PubMed

LinkOut - more resources