. 2025 Jul 1;16(1):5911.
doi: 10.1038/s41467-025-61020-9.

Noncanonical short-latency auditory pathway directly activates deep cortical layers

Affiliations

Noncanonical short-latency auditory pathway directly activates deep cortical layers

Michellee M Garcia et al. Nat Commun. .

Abstract

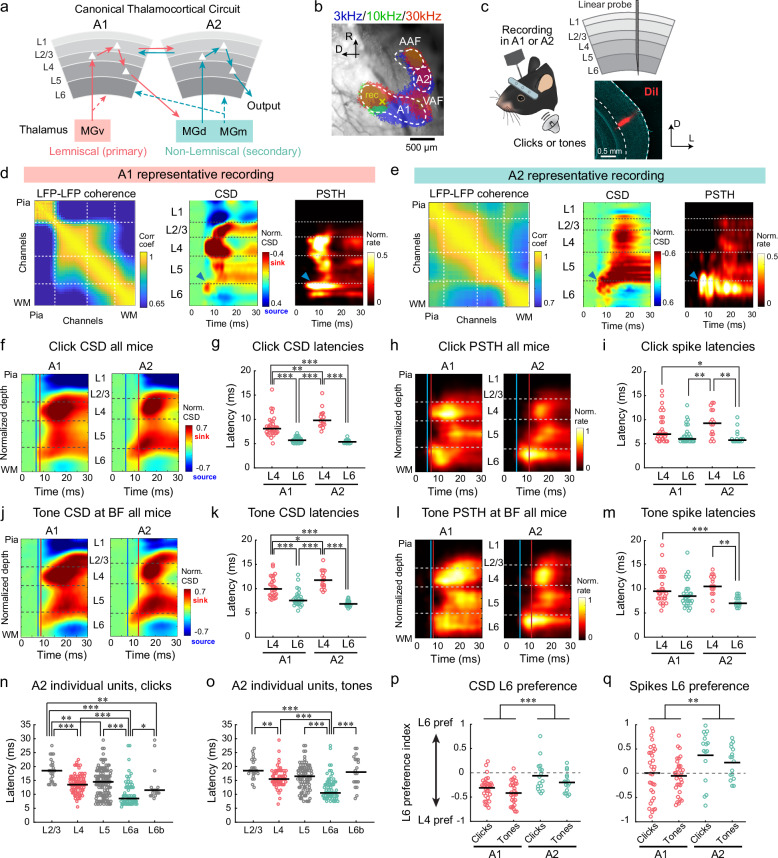
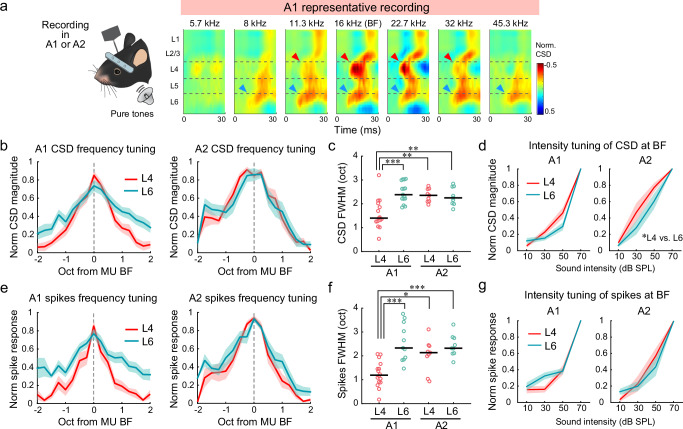
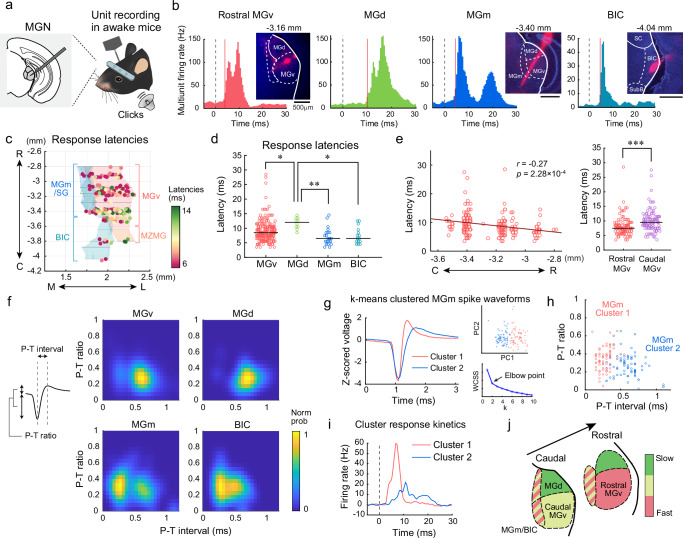
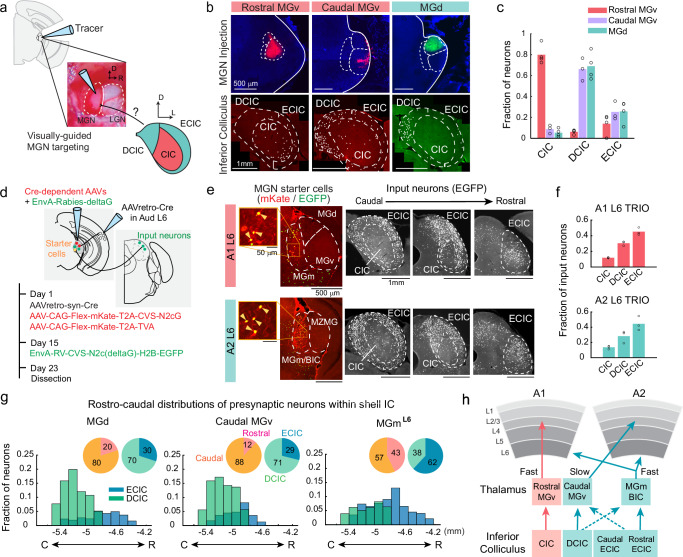
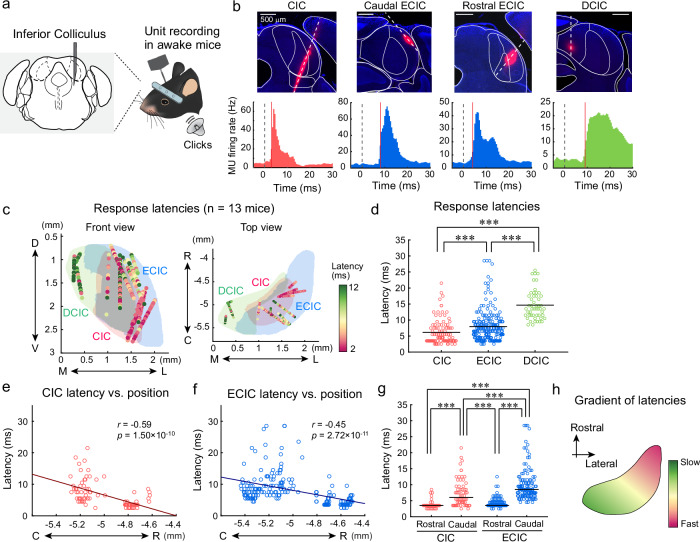
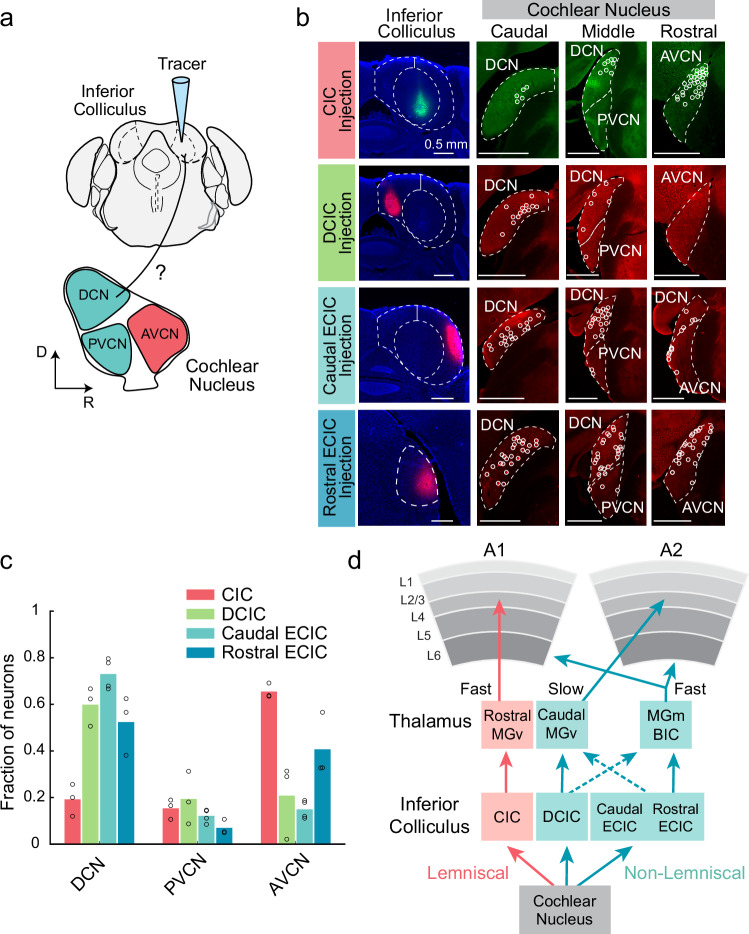
Auditory processing in the cerebral cortex is considered to begin with thalamocortical inputs to layer 4 (L4) of the primary auditory cortex (A1). In this canonical model, A1 L4 inputs initiate a hierarchical cascade that propagates to higher-order cortices for slower integration of complex sounds. Here, we identify parallel ascending pathways in mice that bypass A1 and directly reach the secondary auditory cortex (A2), alongside the canonical hierarchical route. We found that layer 6 (L6) of both A1 and A2 receive short-latency (<10 ms) sound inputs via higher-order thalamic nuclei. Additionally, A2 L4 is innervated by a caudal subdivision of the traditionally defined primary thalamus, which we now re-classify as non-primary. Notably, both identified thalamic regions receive projections from distinct subdivisions of the higher-order inferior colliculus, which in turn receive direct projections from cochlear nucleus neurons. Thus, higher-order auditory cortex integrates both slower, pre-processed information and rapid, direct sensory inputs, enabling parallel processing of fast sensory information across cortical areas.


Conflict of interest statement

Competing interests: The authors declare no competing interests.

Figures

Fig. 1
Fig. 1. L6 in both A1 and A2 receives short-latency sound inputs.
a Schematic of the canonical thalamocortical circuit. b Intrinsic signal imaging of pure tone responses superimposed on the cortical surface imaged through the skull. Dotted lines: auto-sorted area borders. Yellow cross: recording site. c Illustration of linear probe recording across the cortical column. Bottom right: representative probe track in A1 marked by DiI. d Representative A1 recording data with laminar boundaries. Left: pairwise LFP coherence between channels. Middle: click-triggered current source density (CSD) signals. Right: peri-stimulus time histogram (PSTH). Blue arrowhead: short-latency L6a response. e Same as (d), but for A2 recording. f Click-triggered CSD signals normalized and averaged across all A1 (left) and A2 (right) recordings. Red and blue lines: response onsets in L4 and L6, respectively. g Summary of CSD response latencies (A1: n = 31 mice; A2: n = 16 mice; two-way ANOVA followed by Tukey’s HSD test). Black bars: median. h Same as (f), but for click-triggered PSTHs. i Summary of multi-unit spike response latencies, analyzed by individual layers (A1: n = 31 mice; A2: n = 16 mice; two-way ANOVA followed by Tukey’s HSD test). j–m Same as (fi), but for BF tone-triggered responses (A1: n = 31 mice; A2: n = 16 mice). n First-spike latencies of A2 click responses in multi-units, analyzed by individual channels (n = 23, 86, 140, 74, 16 responsive units for L2/3, L4, L5, L6a, L6b; two-sided Wilcoxon rank sum test with Bonferroni correction). o First-spike latencies of A2 BF tone responses in responsive multi-units, analyzed by individual channels (n = 24, 59, 85, 62, 21 responsive units for L2/3, L4, L5, L6a, L6b; two-sided Wilcoxon rank sum test with Bonferroni correction). p L6 preference index of CSD signals for each mouse-area-sound combination (A1: n = 31 mice; A2: n = 16 mice; A1 vs. A2: ***p = 1.95 × 10−5; click vs. tone: p* = 0.0213; two-way ANOVA). The index is calculated as (L6 response−L4 response) / (L6 response + L4 response). q Same as (p) but for spike responses (A1: n = 31 mice; A2: n = 16 mice; A1 vs. A2: **p = 0.0011; click vs. tone: p = 0.360). *p < 0.05, **p < 0.01, ***p < 0.001. Source data are provided as a Source Data file. See Source data for all p values.
Fig. 2
Fig. 2. L6 input shows broader frequency tuning than L4 input.
a Representative A1 recording showing CSD signals across tone frequencies. Red and blue arrowheads: responses in L4 and L6, respectively. b Normalized frequency tuning curves of L4 and L6 CSD sinks in A1 (left) and A2 (right), centered at the BF of the recording site (A1: n = 20 mice; A2: n = 9 mice). Lines: mean. Shading: SEM. c Summary of full-width half-maximum (FWHM) of tuning curves (A1: n = 20 mice; A2: n = 9 mice; A1 L4 vs. A1 L6: p = 3.73 × 10−5; A1 L4 vs. A2 L4: p = 0.0021; A1 L4 vs. A2 L6: p = 0.0035; two-way ANOVA followed by Tukey’s HSD test). Black bars: median. d L4 and L6 CSD sink magnitudes at BF, normalized to those at 70 dB SPL in A1 (left) and A2 (right) (*p = 0.039, A2 L4 vs. A2 L6, two-way ANOVA). Lines: mean. Shading: SEM. e–g Same as (b, c) but for multi-unit spike responses, analyzed by individual layers (A1: n = 20 mice; A2: n = 9 mice; A1 L4 vs. A1 L6: p = 1.83 × 10−5; A1 L4 vs. A2 L4: p = 0.0020; A1 L4 vs. A2 L6: p = 2.47 × 10−4). *p < 0.05, **p < 0.01, ***p < 0.001. Source data are provided as a Source Data file.
Fig. 3
Fig. 3. Distinct thalamic origins for parallel ascending pathways to cortical layers.
a Top: intrinsic signal imaging of pure tone responses superimposed on the cortical surface imaged through the skull. Yellow cross: injection site. Bottom: diagram of layer-targeted retrograde tracing. b Representative tracing results of CTB488 injections in A1 L4 (top) and L6 (bottom). White circles: presynaptic neurons shown in coronal sections at rostral MGN, caudal MGN, and BIC levels. Note that diffuse MGv signals in L6 injections represent anterogradely labeled L6 axons. MZMG: marginal zone of the medial geniculate. c Same as (b), but for A2 injections. d Fraction of presynaptic neurons across MGN divisions for A1 L4 and L6 injections (L4: n = 4 mice; L6: n = 5 mice). For each injection, the fraction of labeled neurons in each input region was calculated relative to the total MGN input. Bar heights: mean. e Same as (d), but for A2 injections (L4: n = 4 mice; L6: n = 5 mice). f Rostrocaudal distribution of MGv presynaptic neurons to L4 in A1 (red) and A2 (purple). g Rostrocaudal distribution of MGm/SG/BIC presynaptic neurons to L6 in A1 (blue) and A2 (green). h Revised thalamocortical connectivity schematic. Source data are provided as a Source Data file.
Fig. 4
Fig. 4. Neural subpopulations in MGm and BIC transmit short-latency sound information.
a MGN linear probe recording illustration. b Representative click-triggered PSTHs for channels in rostral MGv, MGd, MGm, and BIC. Red lines: first-spike latencies. Adjacent histology images: corresponding coronal brain sections with DiI-marked probe tracks. c Click response latencies at reconstructed recording sites across MGN divisions. Dorsal view of 3-D reconstructions from 26 mice. MGd excluded to visualize the transition between caudal MGv and MGm/BIC. d First-spike latencies of click responses from responsive multi-units, analyzed by individual channels within each MGN division (n = 189, 10, 21, 15 responsive units for MGv, MGd, MGm, BIC; MGv vs. MGd: p = 0.022; MGd vs. MGm: p = 0.0088; MGd vs. BIC: p = 0.027; two-sided Wilcoxon rank sum test with Bonferroni correction). Black lines: median. e Left: distribution of click response latencies in MGv along the rostrocaudal axis (Pearson’s correlation; two-sided t-test). Red line: linear fit. Right: click response latencies in rostral vs. caudal MGv (rostral MGv: n = 101 units; caudal MGv: n = 88 units; ***p = 1.86 × 10−5; two-sided Wilcoxon rank sum test). f Left: P-T interval and P-T ratio example. Right: two-dimensional heat maps showing the probability distribution of P-T intervals (x-axis) and P-T ratio (y-axis) for each MGN division. g–i k-means clustering of MGm spike waveforms. g Left: averaged spike waveforms for units in Cluster 1 (red) and Cluster 2 (blue). Top right: two clusters of MGm spikes in PC space. Bottom right: elbow point analysis (optimal cluster number = 2). WCSS: within-cluster sum of squares. h Distributions of P-T interval and P-T ratio for individual MGm clusters. i Click-triggered PSTHs for individual MGm clusters. Cluster 1 (short P-T intervals) shows short-latency responses. j Illustration of response latencies across MGN divisions. MGm shows heterogeneous latencies across subpopulations. *p < 0.05, **p < 0.01, ***p < 0.001. Source data are provided as a Source Data file.
Fig. 5
Fig. 5. Non-lemniscal origins of ascending pathways to caudal MGv, MGm, and rostral BIC.
a Illustration of retrograde tracer injection into the exposed MGN. Middle: Lateral view of exposed MGN and lateral geniculate nucleus (LGN) after cortex and hippocampus aspiration. b Representative tracing results of CTB594 (rostral MGv), Retrobeads (caudal MGv), and CTB488 (MGd) injections. Top: coronal MGN sections at injection sites. Bottom: caudal inferior colliculus sections with presynaptic neurons (white dots). c Presynaptic neuron distribution across inferior colliculus divisions for rostral MGv, caudal MGv, and MGd injections (rostral MGv: n = 4 mice; caudal MGv: n = 3 mice; MGd: n = 4 mice). For each injection, the fraction of labeled neurons in each input region was calculated relative to the total inferior colliculus input. Bar heights: mean. d Illustration of disynaptic rabies tracing (TRIO method). e Representative TRIO tracing results from A1 L6 (top) and A2 L6 (bottom). Left: starter cells in MGm/BIC expressing mKate and EGFP. Insets: magnified views of starter cells (arrowheads). Right: coronal brain sections showing EGFP-expressing input neurons at caudal, middle, and rostral inferior colliculus levels. f Input neuron distribution across inferior colliculus divisions for A1 L6 TRIO (top) and A2 L6 TRIO (bottom) (A1: n = 3 mice; A2: n = 3 mice). g Rostrocaudal distribution of presynaptic neurons to MGd (left), caudal MGv (middle), and MGmL6 (right), showing fractions of total counts within the inferior colliculus shell. Blue and green bars: mean of ECIC and DCIC, respectively. Inset pie charts: fraction of rostral (pink) vs. caudal (orange) shell, and ECIC (blue) vs. DCIC (green). h Revised schematic of ascending pathways through inferior colliculus, thalamus, and cortex. Caudal MGv is classified as part of the non-lemniscal pathway. Source data are provided as a Source Data file.
Fig. 6
Fig. 6. Rostral ECIC transmits sound information with short latencies.
a Inferior colliculus linear probe recording illustration. b Representative click-triggered PSTHs for channels in CIC, caudal ECIC, rostral ECIC, and DCIC. Red lines: first-spike latencies. Top: coronal sections with DiI-marked probe tracks. c Click response latencies at reconstructed recording sites across inferior colliculus divisions. Front view (left) and top view (right) of 3-D reconstructions from 13 mice. d First-spike latencies of click responses from responsive multi-units, analyzed by individual channels within each inferior colliculus division (CIC: n = 7 mice, 99 units; ECIC: n = 10 mice, 203 units; DCIC: n = 4 mice, 51 units; CIC vs. ECIC: p = 1.51 × 10−4; CIC vs. DCIC: p = 2.38 × 10−17; ECIC vs. DCIC: p = 9.41 × 10−17; two-sided Wilcoxon rank sum test with Bonferroni correction). Black bars: median. e Distribution of click response latencies in CIC along the rostrocaudal axis. Red line: linear fit (Pearson’s correlation; two-sided t-test). f Distribution of click response latencies in ECIC along the rostrocaudal axis. Blue line: linear fit (Pearson’s correlation; two-sided t-test). g First-spike latencies of click responses in individual responsive multi-units in rostral vs. caudal subdivisions of CIC and ECIC (n = 35, 64, 75, 128 for rostral CIC, caudal CIC, rostral ECIC, caudal ECIC; rostral CIC vs. caudal CIC: p = 1.10 × 10-4; rostral CIC vs. rostral ECIC: p = 0.88; rostral CIC vs. caudal ECIC: p = 3.77 × 10−9; caudal CIC vs. rostral ECIC: p = 6.40 × 10−5; caudal CIC vs. caudal ECIC: p = 1.17 × 10−4; rostral ECIC vs. caudal ECIC: p = 3.77 × 10−9; two-way ANOVA followed by Tukey’s HSD test). h Schematic showing a gradient of response latencies along the caudomedial-to-rostrolateral axis. ***p < 0.001. Source data are provided as a Source Data file.
Fig. 7
Fig. 7. Direct projections from the cochlear nucleus to non-lemniscal inferior colliculus.
a Illustration of retrograde tracing from inferior colliculus divisions. b Representative retrograde tracing results of tracer injections in CIC (WGA488), DCIC (WGA594), caudal ECIC (WGA594), and rostral ECIC (WGA647). Left: coronal inferior colliculus sections at injection sites. Right: presynaptic neurons (white circles) in cochlear nucleus at DCN, PVCN, and AVCN levels. c Presynaptic neuron distribution across cochlear nucleus divisions for CIC, DCIC, and ECIC injections (CIC: n = 3 mice; DCIC: n = 3 mice; caudal ECIC: n = 4 mice; rostral ECIC: n = 3 mice). For each injection, the fraction of labeled neurons in each input region was calculated relative to the total cochlear nucleus input. Bar heights: mean. d Revised schematic of parallel ascending pathways from the cochlear nucleus through the inferior colliculus and thalamus to distinct cortical layers. Source data are provided as a Source Data file.

Update of

Similar articles

References

    1. Beltramo, R. & Scanziani, M. A collicular visual cortex: neocortical space for an ancient midbrain visual structure. Science363, 64–69 (2019). - PubMed
    1. Tsukano, H. et al. Reconsidering tonotopic maps in the auditory cortex and lemniscal auditory thalamus in mice. Front. Neural Circuits11, 14 (2017). - PMC - PubMed
    1. El-Boustani, S. et al. Anatomically and functionally distinct thalamocortical inputs to primary and secondary mouse whisker somatosensory cortices. Nat. Commun.11, 3342 (2020). - PMC - PubMed
    1. Brenner, J. M., Beltramo, R., Gerfen, C. R., Ruediger, S. & Scanziani, M. A genetically defined tecto-thalamic pathway drives a system of superior-colliculus-dependent visual cortices. Neuron111, 2247–2257.e7 (2023). - PMC - PubMed
    1. Mo, C. et al. General Organization and Parallel Pathways in the Somatosensory System. in The Cerebral Cortex and Thalamus (eds. Usrey, M. W. & Sherman, M. S.) 258–268 (Oxford University PressNew York, 2023).

LinkOut - more resources