. 2025 Jul 1;16(1):5676.
doi: 10.1038/s41467-025-60896-x.

Multidimensional third-generation sequencing of modified DNA bases allows interrogation of complex biological systems

Affiliations

Multidimensional third-generation sequencing of modified DNA bases allows interrogation of complex biological systems

Serena S David et al. Nat Commun. .

Abstract

DNA exists biologically as a highly dynamic macromolecular complex subject to myriad chemical modifications that alter its physiological interpretation, yet most sequencing technologies only measure Watson-Crick base pairing interactions. Third-generation sequencing technologies can directly detect novel and modified bases, yet the difficulty and cost of training these techniques for each novel base has so far limited this potential. Here, we present a method based on barcoded split-pool synthesis to generate reference standard oligonucleotides allowing novel base sequencing. Using novel base detection, we perform multidimensional sequencing to retrieve information, both physiologically stored and experimentally encoded, from DNA, allowing us to characterize the preferential replication of deleterious mitochondrial genome mutations, the infection dynamics of a host-pathogen model, and the effect of chemotherapy on cancer cell DNA at the single molecule level. The low cost and experimental simplicity of this method make this approach widely accessible to the research community, enabling complex experimental interrogation across the biological sciences.


Conflict of interest statement

Competing interests: The authors declare no competing interests.

Figures

Fig. 1
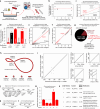
Fig. 1. Barcoded split-pool synthesis (BSPS) for the construction of novel base training libraries.
a Schematic displays split-pool approach. During each of k synthesis rounds, the products of previous rounds (or an initial common ‘acceptor’ oligo) are split into one of b split reactions, where a single base and a corresponding barcode are added. Following addition, these split reactions are pooled, mixed, and re-split. This process will create all possible bk combinations of k-mer base sequences, with barcodes corresponding to the encoded k-mers. b Split-pool strategy is outlined. In this example synthesis, five synthesis rounds of a five-base library, including the four standard base and a novel base N are performed. The specific path through the full oligo synthesis of an oligo encoding CATNT (with corresponding barcodes 3-2-4-5-4) is indicated through tan highlights. c The product of each split-pool step is highlighted. During each round, a single base is added to one of the growing oligo, while a corresponding barcode (bc) is added to the other end. The specific step-wise synthesis of the CATNT oligo is shown. Each synthesis reaction contains a mixture of all possible previous synthesis combinations; the number of distinct base/barcode sequences is shown at the right.
Fig. 2
Fig. 2. Barcoded Split-Pool Synthesis of a deoxyinosine reference library.
a The chemical structures of guanine and inosine are indicated, with inosine’s missing amine group highlighted by the red circle. b A five-round, five-split reaction was performed, with the four standard bases (dA, dG, dC, and dT) and dI. c The characteristics of the synthesized and sequenced library are presented. d Histograms depicts observed currents for all reads with a detected ‘CCGAC’ at the encoded fivemer (left), or these reads separated by barcode sequence (right) indicating either an encoded ‘CCGAC’ string (gold) or an encoded ‘CCIAC’ string (red). e Heatmap depicts full current values for all dI-containing five-mers. Top heatmap depicts absolute current value in increasing heat. Bottom depicts current difference of dI-containing fivemers to a reference five-mer with dG in place of each dI. Red depicts a current increase of dI compared to dG, blue depicts a current decrease, and gray indicates five-mers with no dIs. f Box plots depict current differences of dI-containing five-mers with specific characteristics to the dG reference five-mers. Left, five-mers with dI in position 3 (n = 625) are compared to five-mers that contain dI but not at position 3 (n = 1476). Right, five-mers with dI at position 2 are separated by the base at position 3 (n = 125 per group). g Plots depict effects on current of specific G > I substitutions of two five-mers: GGGTC (left) and GGTCG (right). For box plots, center lines depict medians, box limits depict quartiles, whiskers depict 1.5x interquartile range, and points are outliers. Source data are provided as a source data file.
Fig. 3
Fig. 3. In vivo and in vitro tracing of nucleotide synthesis with novel-base sequencing.
a Schematic depicts in vivo BrdU-labeling genetic single-molecule drug sensitivity experiment. Two glioma cell lines with differential dasatinib sensitivity (T98G – sensitive, LN229 – resistant) were cocultured in BrdU and dasatinib. Following isolation and sequencing of DNA, reads were assigned to either line by genetic single nucleotide polymorphisms (SNPs) unique to each cell line, and the response to drug was measured by BrdU incorporation. b Plot depicts BrdU detection in 1000 example reads, demonstrating separation of positive and negative reads. c Bar chart depicts single-molecule drug sensitivity as determined by BrdU incorporation in SNP-assigned reads. Significance calculated by two-sided t test, P = 0.0018. Points represent replicates and bar depicts average fold change. d Schematic depicts in vivo BrdU-labeling epigenetic single-molecule drug sensitivity experiment. BT142 glioma stem (GSC) and non-stem cells (non-GSCs) were co-cultured in dasatinib and BrdU (as in A); reads were assigned to stem or non-stem based on CpG methylation profiles. e Bar plot depicts single-molecule drug sensitivity as determined by BrdU incorporation in meCpG-assigned reads. f Schematic depicts in vitro dU-labeling experiment. cDNA was synthesized with dUTP; synthesized cDNA should be labeled with dU while contaminating gDNA should not. g Histograms depict dU score (estimated error-corrected T > U replacement fraction) of reads with the indicated dU concentration during cDNA synthesis. h Plot depicts read centers by position along chrM (x-axis) and dU score (y-axis). Read color indicates strandedness; blue reads map to the light (-) strand, while salmon reads map to the heavy (+) strand. Mitochondrial genes are indicated by boxes along bottom of plot, with strand orientation indicated. i Pie charts depict fraction of reads that align to heavy or light chain, separated by presence of dU-labeling. j Plots depict coverage of the mitochondrial genome (excluding the rRNA loci), separated by strand and dU content. dU+ reads are more frequently found on the reverse strand and cluster around gene location, unlike dU- reads. Source data are provided as a source data file.
Fig. 4
Fig. 4. Exploration of mitochondrial genome dynamics in human disease.
a Schematic depicts paradigm of maintenance of deleterious heteroplasmy in human disease. Defective mitochondria are targeted for mitophagy more frequently, yet persist at high levels in the cell due to increased mutant chrM replication. On normal chrM, the protease LONP is associated with the mtDNA, and will degrade the protein ATF5 preventing it from binding to the DNA. On mutant chrM, the protease is not recruited, so ATF5 can bind and recruit POLG, leading to preferential replication of the mutated chromosome. b Plot depicts read coverage of each chromosome (in reads per million per MB chromosome); chrM has ~1000-fold higher aligned reads per MB than nuclear chromosomes. c Plot depicts detected 5mCpG on reads aligning to either chrM (n = 3986) or nuclear chromosomes (n = 10,416); plotted is the average log likelihood ratio of methylation across each read, with positive values being more likely methylated and negative values being more likely unmethylated. d Histogram depicts frequency of reads by length; total reads are plotted in gray, and reads aligning to chrM are plotted in red. e Example alignments of 20 example full-length chrM reads, colored by strand orientation. The ~5 KB deletion associated with KSS is clearly visible. f Replication of chrM genomes by mutation status, determined by BrdU incorporation. Reads representing chrMmut display elevated levels of replication. Points depict replicates (sequencing runs from independent cultures) while bars depict averages. Significance calculated by two-sided t test, P = 0.0069. For box plots in this figure, center lines depict medians, box limits depict quartiles, whiskers depict 1.5x interquartile range, and points are outliers. Source data are provided as a source data file.
Fig. 5
Fig. 5. Complex characterization of a human pathogen infection model.
a Schematic depicts bacterial infection model; polarized colonic epithelial cells were infected apically with Shigella flexneri for 24 h, then BrdU was added to the culture media. Total DNA was isolated and sequenced. Two infections were performed and sequenced independently, points in panels b, c, d, and m represent results from each infection. b Plot depicts one-dimensional sequencing analysis, showing the proportion of reads from each timepoint that aligned to the Shigella reference genome. c Plot depicts two-dimensional sequencing analysis, showing the genome divisions detected by BrdU+ reads separated by alignment to either the human or Shigella genomes. d Bar graph depicts levels of the indicated base modifications in reads that aligned to either the human or Shigella genomes. e, f Plots depict concordance between dcm (E) and dam (F) methylation with reads either unaligned (x-axis) or aligned to the respective reference genome (y-axis). Alignment permits correction of sequencing errors (e.g. a C5mCAGG called sequence aligning to a C5mCGGG reference sequence). g Strategy of modification-based bacterial read isolation. Reads from all infected conditions across both timepoint replicates were aggregated, and 6mA was detected in non-hg38 aligning reads; positive reads were used as input for genome assembly in flye. h Contigs generated by flye are depicted, along with sizes and read coverage. Three contigs (1-3) comprised the main bacterial genome and contigs 4-7 are circular plasmids of the indicated size. i Concordance between assembled contigs and reference genomes are depicted by pairwise alignment graphs. j The alignment of the twenty one type III secretion system genes to assembled contig 4 are depicted. The locus architecture is identical to the reference. The alignment of the reference sequence for the dam (k) and dcm (l) methyltransferases to the assembled contig 2 are depicted. m Relative genome divisions (calculated from BrdU read positivity) are depicted for the genomic assembly as well as each of the assembled plasmids. n Table depicts the corresponding reference, relative division rate, and notable genes of each plasmid. Source data are provided as a source data file.
Fig. 6
Fig. 6. Multidimensional sequencing reveals the dynamics of chemotherapy response in Glioblastoma.
a Schematic depicts mechanism of temozolomide (TMZ) action. O-6-methylation of guanine residues results in mispairing to thymine; this lesion is recognized by mismatch repair pathways but not repairable through MMR. Instead, the enzyme MGMT can directly remove the aberrant methylation. b Schematic depicts experimental setup; glioma cells were cultured in TMZ and BrdU, then the DNA from the MGMT promoter was isolated via Cas9, and sequenced. c Plot depicts methylation status at the CpG island overlapping the MGMT promoter. Reads are represented as rows, black circles depict methylated CpGs and white circles represent unmethylated CpGs. Methylation status of the MGMT promoter is clearly distinguishable. d Bar plot depicts detected 5-hydroxymethyl-cytosine at reads overlapping the MGMT promoter, separated by drug treatment and read methylation status. e Bar plots depict relative DNA replication (detected by BrdU incorporation) in prMGMT reads, separated by methylation status, derived from both cells treated with 20 µM TMZ or DMSO. Drug conditions were sequenced separately and are normalized to each unmethylated promoter BrdU frequency. Points depict replicates treated and sequenced independently, significance was calculated for TMZ-treated cells by two-sided t test, P = 0.024. f Schematic depicts a single read from above experiment, which is characterized further in G-K. g The read in F had detected BrdU on the reverse strand ( ~ 40% T > BrdU replacement) and not on the forward strand. h Read displayed promoter methylation at MGMT. i At a single fivemer within this read, we detected a signature of O6mG (see j), with the opposite strand fivemer displaying a current consistent with a mispaired dT (see k). (j) Histograms depict current values for reference fivemers (GAGTG, gold; GAATG, green) are depicted, compared to detected current of read (black line). Also indicated is training library current data for O6mG (red). k Histograms depict current values for reference sequences at CACTC (blue) and CATTC (green), with read current indicated with black line. Source data are provided as a source data file.

References

    1. Allis, C. D. & Jenuwein, T. The molecular hallmarks of epigenetic control. Nat. Rev. Genet.17, 487–500 (2016). - PubMed
    1. Margueron, R. & Reinberg, D. Chromatin structure and the inheritance of epigenetic information. Nat. Rev. Genet.11, 285–296 (2010). - PMC - PubMed
    1. Flavahan, W. A., Gaskell, E. & Bernstein, B. E. Epigenetic plasticity and the hallmarks of cancer. Science357, eaal2380 (2017). - PMC - PubMed
    1. Rivera, C. M. & Ren, B. Mapping human epigenomes. Cell155, 10.1016 (2013). - PMC - PubMed
    1. Sanger, F., Nicklen, S. & Coulson, A. R. DNA sequencing with chain-terminating inhibitors. Proc. Natl Acad. Sci. USA74, 5463–5467 (1977). - PMC - PubMed

LinkOut - more resources