. 2025 Jul 1;16(1):5805.
doi: 10.1038/s41467-025-60893-0.

Decoding polyubiquitin regulation of KV7. 1 (KCNQ1) surface expression with engineered linkage-selective deubiquitinases

Affiliations

Decoding polyubiquitin regulation of KV7. 1 (KCNQ1) surface expression with engineered linkage-selective deubiquitinases

Sri Karthika Shanmugam et al. Nat Commun. .

Abstract

Polyubiquitin chain diversity generates a 'ubiquitin code' that universally regulates protein abundance, localization, and function. Functions of polyubiquitin diversity are mostly unknown, with lack of progress due to an inability to selectively tune protein polyubiquitin linkages in live cells. We develop linkage-selective engineered deubiquitinases (enDUBs) by fusing linkage-selective DUB catalytic domains to GFP-targeted nanobody and use them to investigate polyubiquitin linkage regulation of an ion channel, YFP-KCNQ1. YFP-KCNQ1 in HEK293 cells has polyubiquitin chains with K48/K63 linkages dominant. EnDUBs yield unique effects on channel surface abundance with a pattern indicating: K11 promotes ER retention/degradation, enhances endocytosis, and reduces recycling; K29/K33 promotes ER retention/degradation; K63 enhances endocytosis and reduces recycling; and K48 is necessary for forward trafficking. EnDUB effects differ in cardiomyocytes and on KCNQ1 disease mutants, emphasizing ubiquitin code mutability. The results reveal distinct polyubiquitin chains control different aspects of KCNQ1 abundance and subcellular localization and introduce linkage-selective enDUBs as potent tools to demystify the polyubiquitin code.


Conflict of interest statement

Competing interests: S.A.K. and H.M.C. are inventors on a patent held by Columbia University for “Compositions and methods for using engineered deubiquitinases for probing ubiquitin-dependent cellular processes.” H.M.C. is a scientific co-founder and on the SAB of two startups, Stablix, Inc. and Flux Therapeutics, pursuing targeted protein stabilization therapeutics. S.A.K. is a co-founder and employee of Stablix, Inc. The remaining authors declare no competing interests.

Figures

Fig. 1
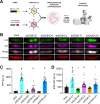
Fig. 1. KCNQ1-YFP subcellular distribution and polyubiquitination in HEK293 cells and design of linkage-selective enDUBs.
A Representative confocal images of HEK293 cells showing co-localization of expressed KCNQ1-YFP (green) and immunolabelled subcellular organelle markers (red) [calnexin - endoplasmic reticulum (ER); RCAS1 – Golgi; EEA1 - early endosome (EE); Rab9A - late endosome (LE); LAMP2 - lysosome (lyso); and PSMA2 - proteasome (protea)]. Scale bar, 5 μm. B Co-localization of Q1-YFP with subcellular markers assessed by Pearson’s co-localization coefficient. (N = 3 independent experiments; n > 20 cells for each subcellular organelle imaged. C Schematic of BBS-KCNQ1-YFP with BTX-647 bound to an extracellular bungarotoxin-binding site (BBS). D Representative flow cytometry cumulative distribution function (CDF) plots showing total (YFP fluorescence) and surface (BTX-647) channels in YFP-positive cells expressing BBS-KCNQ1-YFP in untreated (black) and MG132 treated (red) conditions. Here and throughout, appropriate gates were used to determine cells vs debris (FSC/SSC) and single cells vs doublets (FSC-A/FSC-H). Fluorescence gates (CFP, YFP, BTX-647) were determined from single color controls compared to untransfected cells. E Representative Coomassie-stained SDS PAGE of pulled down KCNQ1-YFP. Black boxes indicate KCNQ1 monomeric and dimeric protein bands excised for mass spectrometry. F Representative ms2 spectra traces for ubiquitin peptides with di-glycine modification of K48 (top) and K63 (bottom), respectively. G Fractional distribution of Ub linkages on pulled down KCNQ1-YFP as assessed by mass spectrometry of associated di-glycine modified lysine residues on associated ubiquitin peptides. H Schematic of linkage-selective engineered deubiquitinases (enDUBs). I Top, KCNQ1-YFP pulldowns probed with anti-KCNQ1 in untransfected cells (UT), cells expressing KCNQ1-YFP with nano (control) or the indicated enDUBs. The four bands represent KCNQ1-YFP monomeric, dimeric, trimeric and tetrameric species. Bottom, same blots stripped and probed with anti-ubiquitin. J Relative KCNQ1-YFP ubiquitination computed as the ratio of ubiquitin/(monomeric + dimeric KCNQ1) signal intensities here and throughout (mean ± SEM); N = 3 biological replicates. One-way ANOVA and Dunnett’s multiple comparisons test, #p < 0.0001, *** p < 0.0003 and **p = 0.0016. Source data are provided as a Source Data file.
Fig. 2
Fig. 2. Differential impact of distinct enDUBs on KCNQ1 steady-state abundance, subcellular localization, and function.
A Experimental design schematic; BBS-KCNQ1-YFP is co-expressed with either GFP/YFP targeting nanobody (nano, control) or an enDUB in HEK293 cells. B Representative flow cytometry CDF plots showing channel abundance (YFP fluorescence) in cells expressing BBS-Q1-YFP and either nano alone (black) or each of the enDUBs (enDUB-O1, cyan; enDUB-O4, green; enDUB-Cz, magenta; enDUB-Tr, orange; enDUB-U21, blue). C Quantification of flow cytometry experiments for total KCNQ1-YFP expression analyzed from YFP- and CFP- positive cells (N = 10 biological replicates; #p < 0.0001, one-way ANOVA with Dunnett’s multiple comparisons: p = 0.9970, nano vs enDUB-O1; p = 0.9136, nano vs enDUB-O4; #p < 0.0001, nano vs enDUB-Cz; *p = 0.0117, nano vs enDUB-Tr; #p < 0.0001, nano vs enDUB-U21). Data were normalized to values from the nano control group (dotted line) and presented as mean ± SEM. D Representative CDF plots showing surface fluorescence (BTX-647) in cells expressing BBS-KCNQ1-YFP and either nano alone (black) or an enDUB (enDUB-O1, cyan; enDUB-O4, green; enDUB-Cz, magenta; enDUB-Tr, orange; enDUB-U21, blue). E Quantification of flow cytometry experiments for KCNQ1-YFP surface expression analyzed from YFP- and CFP- positive cells (N = 10 biological replicates; #p < 0.0001, one-way ANOVA with Dunnett’s multiple comparisons; p = 0.9995, nano vs enDUB-O1; **p = 0.0012, nano vs enDUB-O4; **p = 0.0041, nano vs enDUB-Cz; #p < 0.0001, nano vs enDUB-Tr; p > 0.9999, nano vs enDUB-U21). Data were normalized to values from the nano control group (dotted line) and presented as mean ± SEM. FJ Co-localization of KCNQ1-YFP with subcellular markers assessed by Pearson’s co-localization coefficient (N = 3, n > 20 for each subcellular organelle; ER #p < 0.0001, one-way ANOVA and Dunnett’s multiple comparisons test: p = 0.01125, nano vs enDUB-O1; #p < 0.0001, nano vs enDUB-O4; p = 0.4620, nano vs enDUB-Cz; *p = 0.0109, nano vs enDUB-Tr; p = 0.3397, nano vs enDUB-U21. Golgi #p < 0.0001, one-way ANOVA and Dunnett’s multiple comparisons test: p = 0.9999, nano vs enDUB-O1; *p = 0.0213, nano vs enDUB-O4; **p = 0.0080, nano vs enDUB-Cz; p = 0.4119, nano vs enDUB-Tr; p = 0.9990, nano vs enDUB-U21. EE p = 0.3250, one-way ANOVA and Dunnett’s multiple comparisons test: p = 0.9992, nano vs enDUB-O1; p = 0.9998, nano vs enDUB-O4; p = 0.9845, nano vs enDUB-Cz; p = 0.8955, nano vs enDUB-Tr; p = 0.3685, nano vs enDUB-U21. LE #p < 0.0001, one-way ANOVA and Dunnett’s multiple comparisons test: p = 0.8850, nano vs enDUB-O1; p > 0.9999, nano vs enDUB-O4; p = 0.2278, nano vs enDUB-Cz; p = 0.9927, nano vs enDUB-Tr; #p < 0.0001, nano vs enDUB-U21. Lyso #p < 0.0001, one-way ANOVA and Dunnett’s multiple comparisons test: *p = 0.0209, nano vs enDUB-O1; p = 0.0645, nano vs enDUB-O4; p = 0.4973, nano vs enDUB-Cz; p = 0.1985, nano vs enDUB-Tr; p = 0.7449, nano vs enDUB-U21). K Exemplar KCNQ1 + KCNE1 current traces from whole-cell patch clamp measurements in CHO cells. L Population I-V curves for nano control (black, n = 25), enDUB-O1 (cyan, n = 9), enDUB-O4 (green, n = 9), enDUB-Cz (magenta, n = 16), enDUB-Tr (orange, n = 16) and enDUB-U21 (blue, n = 8). Pooled data were collected across N = 3 independent experiment days and presented as mean ± SEM; #p < 0.0001, two-way ANOVA, with Tukey’s multiple comparisons: p = 0.1996, nano vs enDUB-O1; #p < 0.0001, nano vs enDUB-O4; #p < 0.0001, nano vs enDUB-Cz; #p < 0.0001, nano vs enDUB-Tr; p = 9463, nano vs enDUB-U21. Source data is provided as a Source Data file.
Fig. 3
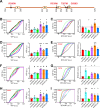
Fig. 3. Distinctive impact of different enDUBs on dynamic KCNQ1 delivery to and removal from the plasma membrane.
A Schematic of optical pulse-chase assay to measure BBS-KCNQ1-YFP forward trafficking. B Representative flow cytometry BTX-647 fluorescence histograms showing time evolution of surface channel increase in cells expressing BBS-KCNQ1-YFP with nano (black, top) or enDUB-Tr (orange, bottom). C Time evolution of channel forward trafficking to the surface in cells expressing BBS-KCNQ1-YFP with either nano or an enDUB (enDUB-O1, cyan; enDUB-O4, green; enDUB-Cez, magenta; enDUB-Tr, orange; enDUB-U21, blue; N = 3 for each data point; p = 0.8047, nano vs enDUB-O1; p < 0.0001, nano vs enDUB-O4; p = 0.0014, nano vs enDUB-Cz; p < 0.0001, nano vs enDUB-Tr; p = 0.0053, nano vs enDUB-U21; two-way ANOVA, with Tukey’s multiple comparisons). Data are normalized to the max value of nano control (black) and presented as mean ± SEM. Smooth curves are fits of an exponential growth function to the data: y = Ae1/τ + y0. D Schematic of endocytosis pulse-chase assay. E Representative flow cytometry BTX-647 fluorescence histograms showing time evolution of surface channel decrease in cells expressing BBS-KCNQ1-YFP with nano (black, top) or enDUB-O1 (turquoise, bottom). F Time evolution of channel removal from the surface in cells expressing BBS-KCNQ1-YFP with either nano (black, t1/2 = 12.02 mins or an enDUB (enDUB-O1, cyan, t1/2 = 38.32 mins; enDUB-O4, green, t1/2 = 12.43 mins; enDUB-Cz, magenta, t1/2 = 21.79 mins; enDUB-Tr, orange, t1/2 = 15.06 mins; enDUB-U21, blue, t1/2 = 15.61 mins; N = 3 for each data point; p < 0.0001, nano vs enDUB-O1, p = 0.0171, nano vs enDUB-O4, p = 0.0104, nano vs enDUB-Cz, p = 0.9326, nano vs enDUB-Tr, p = 0.0708, nano vs enDUB-U21, two-way ANOVA with Tukey’s multiple comparisons). Data are presented as mean values ± SEM. Smooth curves are fits of an exponential growth function to the data: y= Ae-1/τ + y0. Source data is provided as a Source Data file.
Fig. 4
Fig. 4. KCNQ1 surface density is downregulated by the E3 ligases NEDD4-2 and ITCH with distinct polyubiquitin signatures.
A Representative flow cytometry CDF plots showing surface channel density (BTX-647 fluorescence) in cells expressing BBS-KCNQ1-YFP with nano (black), NEDD4-2 (red) or ITCH (blue). B Mean BBS-KCNQ1-YFP surface expression (BTX-647 fluorescence) analyzed from YFP-positive cells (N = 3-4; #p < 0.0001, one-way ANOVA and Dunnett’s multiple comparisons test: #p < 0.0001, nano vs NEDD4-2 and #p < 0.0001, nano vs ITCH). Data were normalized to values from the nano control group (dotted line) and presented as mean ± SD. C Exemplar KCNQ1 current traces from whole-cell patch clamp measurements in CHO cells. D Population I-V curves for KCNQ1 + nano (control; black, n = 14), KCNQ1 + NEDD4-2 (red, n = 9), and KCNQ1 + ITCH (blue, n = 11) (#p < 0.0001, two-way ANOVA, with Tukey’s multiple comparisons: #p < 0.0001, nano vs NEDD4-2 and #p < 0.0001, nano vs ITCH). Data are presented as mean values ± SEM. E Quantification of ubiquitin that was pulled down with KCNQ1-YFP expressed with nano (control, n = 4), NEDD4-2 (n = 4) or ITCH (n = 2), as assessed by mass spectrometry. ‘n’ is the number of monomeric and dimeric KCNQ1 bands analyzed across N = 2 independent experiments. Data were normalized to the control group and represented as the mean value. F Mass spectrometric evaluation of ubiquitin lysine residues that are di-gly modified (number of monomeric and dimeric KCNQ1 bands analyzed n = 4 across N = 2 independent experiments). Data were normalized to the control group. G Fractional distribution of Ub linkages as assessed by mass spectrometric analysis of immunoprecipitated and gel excised bands of KCNQ1-YFP co-expressed with NEDD4-2 or ITCH. H Top, cartoon of KCNQ1 with di-gly-modified lysine residues identified by mass spectrometry shown in red. Bottom, representative MS2 spectra trace of KCNQ1 peptide with di-gly modification of K598. I Quantification of di-gly-modified lysine residues on KCNQ1 peptides (N = 2 independent experiments). Source data are provided as a Source Data file.
Fig. 5
Fig. 5. Differential impact of distinct linkage-selective enDUBs on reversing KCNQ1 functional downregulation by NEDD4-2.
A Experimental design schematic; BBS-KCNQ1-YFP is co-expressed with NEDD4-2 and either nano (control) or an enDUB in HEK293 cells. B Left, Western blot of KCNQ1-YFP pulldowns from cells expressing KCNQ1-YFP + NEDD4-2 and either nano or the indicated enDUB, probed with anti-KCNQ1 antibody. Right, same blot stripped and probed with anti-ubiquitin. C Relative KCNQ1 ubiquitination computed by the ratio of anti-ubiquitin/anti-KCNQ1 signal intensities. Data are presented as mean values ± SEM; (N = 3 biological replicates); ***p = 0.0002, one-way ANOVA with Dunnett’s multiple comparisons: **p = 0.0010, nano vs enDUB-O1; **p = 0.0041, nano vs enDUB-O4; ***p = 0.0002, nano vs enDUB-Cz; *p = 0.0123, nano vs enDUB-Tr; #p < 0.0001, nano vs enDUB-U21. D Representative flow cytometry CDF plots showing total channel expression (YFP fluorescence) in cells expressing BBS-KCNQ1-YFP + NEDD4-2 and either nano or an enDUB. E Mean KCNQ1 expression analyzed from YFP- and CFP- positive cells. Data were normalized to values from the nano control group (dotted line) and presented as mean values ± SEM (N = 3; ***p = 0.0002, one-way ANOVA with Dunnett’s multiple comparisons: p = 0.2619, nano vs enDUB-O1; p = 0.9039, nano vs enDUB-O4; ***p = 0.0008, nano vs enDUB-Cz; p = 0.0624, nano vs enDUB-Tr; **p = 0.0014, nano vs enDUB-U21). F Representative CDF plots showing surface channels (BTX-647 fluorescence) in cells expressing BBS-KCNQ1-YFP + NEDD4-2 and either nano or an enDUB. G Mean BBS-KCNQ1-YFP surface expression analyzed from YFP- and CFP- positive cells. Data were normalized to values from the nano control group (dotted line) and presented as mean values ± SEM (N = 3; #p < 0.0001, one-way ANOVA with Dunnett’s multiple comparisons: #p < 0.0001, nano vs enDUB-O1; p = 0.9328, nano vs enDUB-O4; #p < 0.0001, nano vs enDUB-Cz; p = 0.9979, nano vs enDUB-Tr; ***p = 0.0009, nano vs enDUB-U21). H Exemplar KCNQ1 + KCNE1 currents from whole-cell patch clamp measurements in CHO cells. I Population I-V curves for nano (control; red, n = 18), enDUB-O1 (turquoise, n = 9), enDUB-O4 (green, n = 9), enDUB-Cz (pink, n = 10), enDUB-Tr (orange, n = 10) and enDUB-U21 (blue, n = 8). Data are presented as mean values ± SEM; #p < 0.0001, two-way ANOVA, with Tukey’s multiple comparisons: #p < 0.0001, nano vs enDUB-O1; p > 0.9999, nano vs enDUB-O4; #p < 0.0001, nano vs enDUB-Cz; p > 0.9999, nano vs enDUB-Tr; #p < 0.0001, nano vs enDUB-U21. Source data are provided as a Source Data file.
Fig. 6
Fig. 6. Differential impact of distinct linkage-selective enDUBs on reversing KCNQ1 functional downregulation by ITCH.
A Experimental design schematic; BBS-KCNQ1-YFP is co-expressed with ITCH and either nano (control) or an enDUB in HEK293 cells. B Left, Western blot of KCNQ1-YFP pulldowns from cells expressing KCNQ1-YFP + ITCH and either nano or the indicated enDUB, probed with anti-KCNQ1 antibody. Right, same blot stripped and probed with anti-ubiquitin. C Relative KCNQ1 ubiquitination computed by the ratio of anti-ubiquitin/anti-KCNQ1 signal intensities. Data are presented as mean values ± SEM; N = 3 biological replicates; #p < 0.0001, one-way ANOVA with Dunnett’s multiple comparisons: #p < 0.0001, nano vs every enDUB. D Representative flow cytometry CDF plots showing total channel expression (YFP fluorescence) in cells expressing BBS-KCNQ1-YFP + ITCH and either nano or an enDUB. E Mean KCNQ1 expression analyzed from YFP- and CFP- positive cells (N = 3; #p < 0.0001, one-way ANOVA with Dunnett’s multiple comparisons: p > 0.9999, nano vs enDUB-O1; p = 0.9479, nano vs enDUB-O4; #p < 0.0001, nano vs enDUB-Cz; ***p = 0.0007, nano vs enDUB-Tr; *p = 0.0189, nano vs enDUB-U21). Data were normalized to values from the nano control group (dotted line) and presented as mean values ± SEM. F Representative CDF plots showing surface channels (BTX-647 fluorescence) in cells expressing BBS-KCNQ1-YFP + NEDD4-2 and either nano or an enDUB. G Mean BBS-KCNQ1-YFP surface expression analyzed from YFP- and CFP- positive cells (N = 3; #p < 0.0001, one-way ANOVA with Dunnett’s multiple comparisons: #p < 0.0001, nano vs enDUB-O1; p = 0.9928, nano vs enDUB-O4; #p < 0.0001, nano vs enDUB-Cz; *p = 0.0265, nano vs enDUB-Tr; **p = 0.0012, nano vs enDUB-U21). Data were normalized to values from the nano control group (dotted line) and presented as mean values ± SEM. H Exemplar KCNQ1 + KCNE1 currents from whole-cell patch clamp measurements in CHO cells. I Population I-V curves for nano (control; red, n = 18), enDUB-O1 (turquoise, n = 9), enDUB-O4 (green, n = 8), enDUB-Cez (pink, n = 10), enDUB-Tr (orange, n = 10) and enDUB-U21 (blue, n = 8). Data are presented as mean values ± SEM; #p < 0.0001, two-way ANOVA with Tukey’s multiple comparisons: #p < 0.0001, nano vs enDUB-O1; p = 0.7895, nano vs enDUB-O4; #p < 0.0001, nano vs enDUB-Cz; #p < 0.0001, nano vs enDUB-Tr; #p < 0.0001, nano vs enDUB-U21. Source data are provided as a Source Data file.
Fig. 7
Fig. 7. Differential impact of linkage-selective enDUBs on KCNQ1 abundance and surface density in cardiomyocytes.
A Schematic of the experimental design. Created in BioRender. Colecraft, H. (https://BioRender.com/8ncfwc8) B Representative confocal images (maximum intensity Z-projection) of adult guinea pig ventricular cardiomyocytes expressing BBS-KCNQ1-YFP with either nano-IRES-mCherry or an enDUB-IRES-mCherry, showing YFP (top row), BTX-647 (second row), YFP and BTX-647 overlay (third row), and mCherry (bottom) fluorescence signals. Scale bar, 10 µm. C Quantification of YFP fluorescence intensity (total channel expression) measured from confocal images (N = 3 isolations; mean and SEM; #p < 0.0001, one-way ANOVA and Dunnett’s multiple comparisons test: #p < 0.0001, nano vs enDUB-O1; p = 0.9964, nano vs enDUB-O4; **p = 0.0054, nano vs enDUB-Cz; p = 0.9666, nano vs enDUB-Tr; #p < 0.0001, nano vs enDUB-U21). D Quantification of the surface BTX-647 fluorescence intensity (surface channels) measured from confocal images (N = 3 isolations; mean and SEM; #p < 0.0001, one-way ANOVA and Dunnett’s multiple comparisons test: #p < 0.0001, nano vs enDUB-O1; *p = 0.0346, nano vs enDUB-O4; **p = 0.0072, nano vs enDUB-Cz; p = 0.7954, nano vs enDUB-Tr; *p = 0.0189, nano vs enDUB-U21). Source data are provided as a Source Data file.
Fig. 8
Fig. 8. KCNQ1 disease mutants alter signature pattern of responsiveness to distinct enDUBs.
A Scheme of LQT1 mutations mapped on a cartoon of the KCNQ1 C-terminus. B Left, representative flow cytometry CDF plots of YFP fluorescence (channel total expression) in cells expressing BBS-KCNQ1[R366W]-YFP and either nano or an enDUBs. Right, mean values ± SEM of channel expression analyzed from YFP- and CFP- positive cells (N = 3 independent experiments). Data were normalized to the values from WT BBS-KCNQ1-YFP + nano control group (dotted line, black). Red dotted line corresponds to the values of mutant BBS-KCNQ1-YFP + nano. *p = 0.0114, one-way ANOVA and Dunnett’s multiple comparisons test: p = 0.8543, nano vs enDUB-O1; p = 0.9973, nano vs enDUB-O4; *p = 0.0117, nano vs enDUB-Cz; p = 0.1149, nano vs enDUB-Tr; *p = 0.0321, nano vs enDUB-U21. C Left, representative CDF plots showing BTX-647 fluorescence (surface channels) in cells expressing BBS-KCNQ1[R366W]-YFP and either nano or an enDUB. Right, mean values ± SEM of channel expression analyzed from YFP- and CFP- positive cells (N = 3). Data were normalized to values from WT BBS-Q1-YFP+nano control group (black dotted line). ***p = 0.0003, one-way ANOVA and Dunnett’s multiple comparisons test: p = 0.9665, nano vs enDUB-O1; *p = 0.0372, nano vs enDUB-O4; p = 0.8216, nano vs enDUB-Cz; **p = 0.0058, nano vs enDUB-Tr; p = 0.9345, nano vs enDUB-U21. D Data for BBS-KCNQ1[R539W]-YFP; same format as B. ***p = 0.0002, one-way ANOVA and Dunnett’s multiple comparisons test: p = 0.8416, nano vs enDUB-O1; p = 0.5072, nano vs enDUB-O4; ***p = 0.0003, nano vs enDUB-Cz; *p = 0.0184, nano vs enDUB-Tr; ***p = 0.0008, nano vs enDUB-U21. E Data for BBS-KCNQ1[R539W]-YFP; same format as C. ***p = 0.0002, one-way ANOVA and Dunnett’s multiple comparisons test: p = 0.9949, nano vs enDUB-O1; p = 0.5228, nano vs enDUB-O4; p = 0.0538, nano vs enDUB-Cz; ***p = 0.0007, nano vs enDUB-Tr; p = 0.6163, nano vs enDUB-U21. F Data for BBS-KCNQ1[T587M]-YFP; same format as B. #p < 0.0001, one-way ANOVA and Dunnett’s multiple comparisons test: #p < 0.0001, nano vs enDUB-O1; **p = 0.001, nano vs enDUB-O4; #p < 0.0001, nano vs enDUB-Cz; #p < 0.0001, nano vs enDUB-Tr; #p < 0.0001, nano vs enDUB-U21. G Data for BBS-KCNQ1[T587M]-YFP; same format as C. ***p = 0.0001, one-way ANOVA and Dunnett’s multiple comparisons test: #p < 0.0001, nano vs enDUB-O1; p = 0.9995, nano vs enDUB-O4; *p = 0.0344, nano vs enDUB-Cz; *p = 0.0344, nano vs enDUB-Tr; p = 0.096, nano vs enDUB-U21. H Data for BBS-KCNQ1[G589D]-YFP; same format as B. *p = 0.02, one-way ANOVA and Dunnett’s multiple comparisons test: p = 0.6523, nano vs enDUB-O1; p = 0.9993, nano vs enDUB-O4; *p = 0.0166, nano vs enDUB-Cz; p = 0.2805, nano vs enDUB-Tr; *p = 0.042, nano vs enDUB-U21. I Data for BBS-KCNQ1[G589D]-YFP; same format as C. ***p = 0.0003, one-way ANOVA and Dunnett’s multiple comparisons test: ***p = 0.0003, nano vs enDUB-O1; p = 0.9999, nano vs enDUB-O4; **p = 0.0051, nano vs enDUB-Cz; *p = 0.0228, nano vs enDUB-Tr; *p = 0.0428, nano vs enDUB-U21. Source data are provided as a Source Data file.
Fig. 9
Fig. 9. Differential roles of distinct polyubiquitin linkages in regulating KCNQ1 expression and trafficking in HEK293 cells.
Cartoon showing proposed differential roles of distinct polyubiquitin chains in regulating KCNQ1 expression and trafficking among subcellular compartments in HEK 293 cells under basal conditions. This polyubiquitin code for KCNQ1 is not immutable and can be changed by both extrinsic (changing cellular conditions or cell types) and intrinsic (mutations in the substrate) factors. Created in BioRender. Shanmugam, S. (https://BioRender.com/w3nu0kx).

Update of

Similar articles

References

    1. Komander, D. & Rape, M. The ubiquitin code. Annu Rev. Biochem81, 203–229 (2012). - PubMed
    1. Schulman, B. A. & Harper, J. W. Ubiquitin-like protein activation by E1 enzymes: the apex for downstream signalling pathways. Nat. Rev. Mol. Cell Biol.10, 319–331 (2009). - PMC - PubMed
    1. Akutsu, M., Dikic, I. & Bremm, A. Ubiquitin chain diversity at a glance. J. Cell Sci.129, 875–880 (2016). - PubMed
    1. French, M. E., Koehler, C. F. & Hunter, T. Emerging functions of branched ubiquitin chains. Cell Discov.7, 6 (2021). - PMC - PubMed
    1. Kwon, Y. T. & Ciechanover, A. The Ubiquitin code in the ubiquitin-proteasome system and autophagy. Trends Biochem Sci.42, 873–886 (2017). - PubMed

LinkOut - more resources